4400
Accelerating Multi-Echo GRASE with CAIPIRINHA for Fast and High-Resolution Myelin Water Imaging1Advanced Clinical Imaging Technology, Siemens Healthcare AG, Lausanne, Switzerland, 2Department of Radiology, Centre Hospitalier Universitaire Vaudois (CHUV), Lausanne, Switzerland, 3LTS5, École Polytechnique Fédérale de Lausanne (EPFL), Lausanne, Switzerland, 4Application Development, Siemens Healthcare GmbH, Erlangen, Germany
Synopsis
Impaired myelin plays a central role in a wide range of degenerative brain diseases. A method for non-invasive and in vivo assessment of myelin content within clinically acceptable acquisition times is thus desirable. In this work, a 3D multi-echo gradient and spin-echo (GRASE) sequence was accelerated with CAIPIRINHA to achieve high-resolution and whole-brain myelin imaging in less than ten minutes. Myelin water fraction (MWF) maps were derived from multi-echo GRASE data in a cohort of healthy subjects and values proved to be consistent with MWF maps computed from a conventional multi-echo spin-echo acquisition.
Introduction
Impaired myelin severely compromises brain activity and plays a central role in a wide range of neurodegenerative deseases1–3. Therefore, various methods to achieve in vivo myelin water imaging (MWI) were investigated4. However, it remains challenging to image the whole brain in a clinically acceptable acquisition time (TA).
Prasloski et al.5 introduced the multi-echo gradient and spin-echo (GRASE) sequence as an alternative to a conventional multi-echo spin-echo (MESE) sequence for deriving myelin water fraction (MWF) maps in multi-echo T2 (MET2) experiments6. Twenty brain slices of 5 mm thickness were acquired in 14.4 minutes5. In this work, a multi-echo GRASE was accelerated using CAIPIRINHA7 to increase resolution and reduce the TA. Resulting MWF values were validated by comparison with MWF maps derived from a reference MESE sequence.
Methods
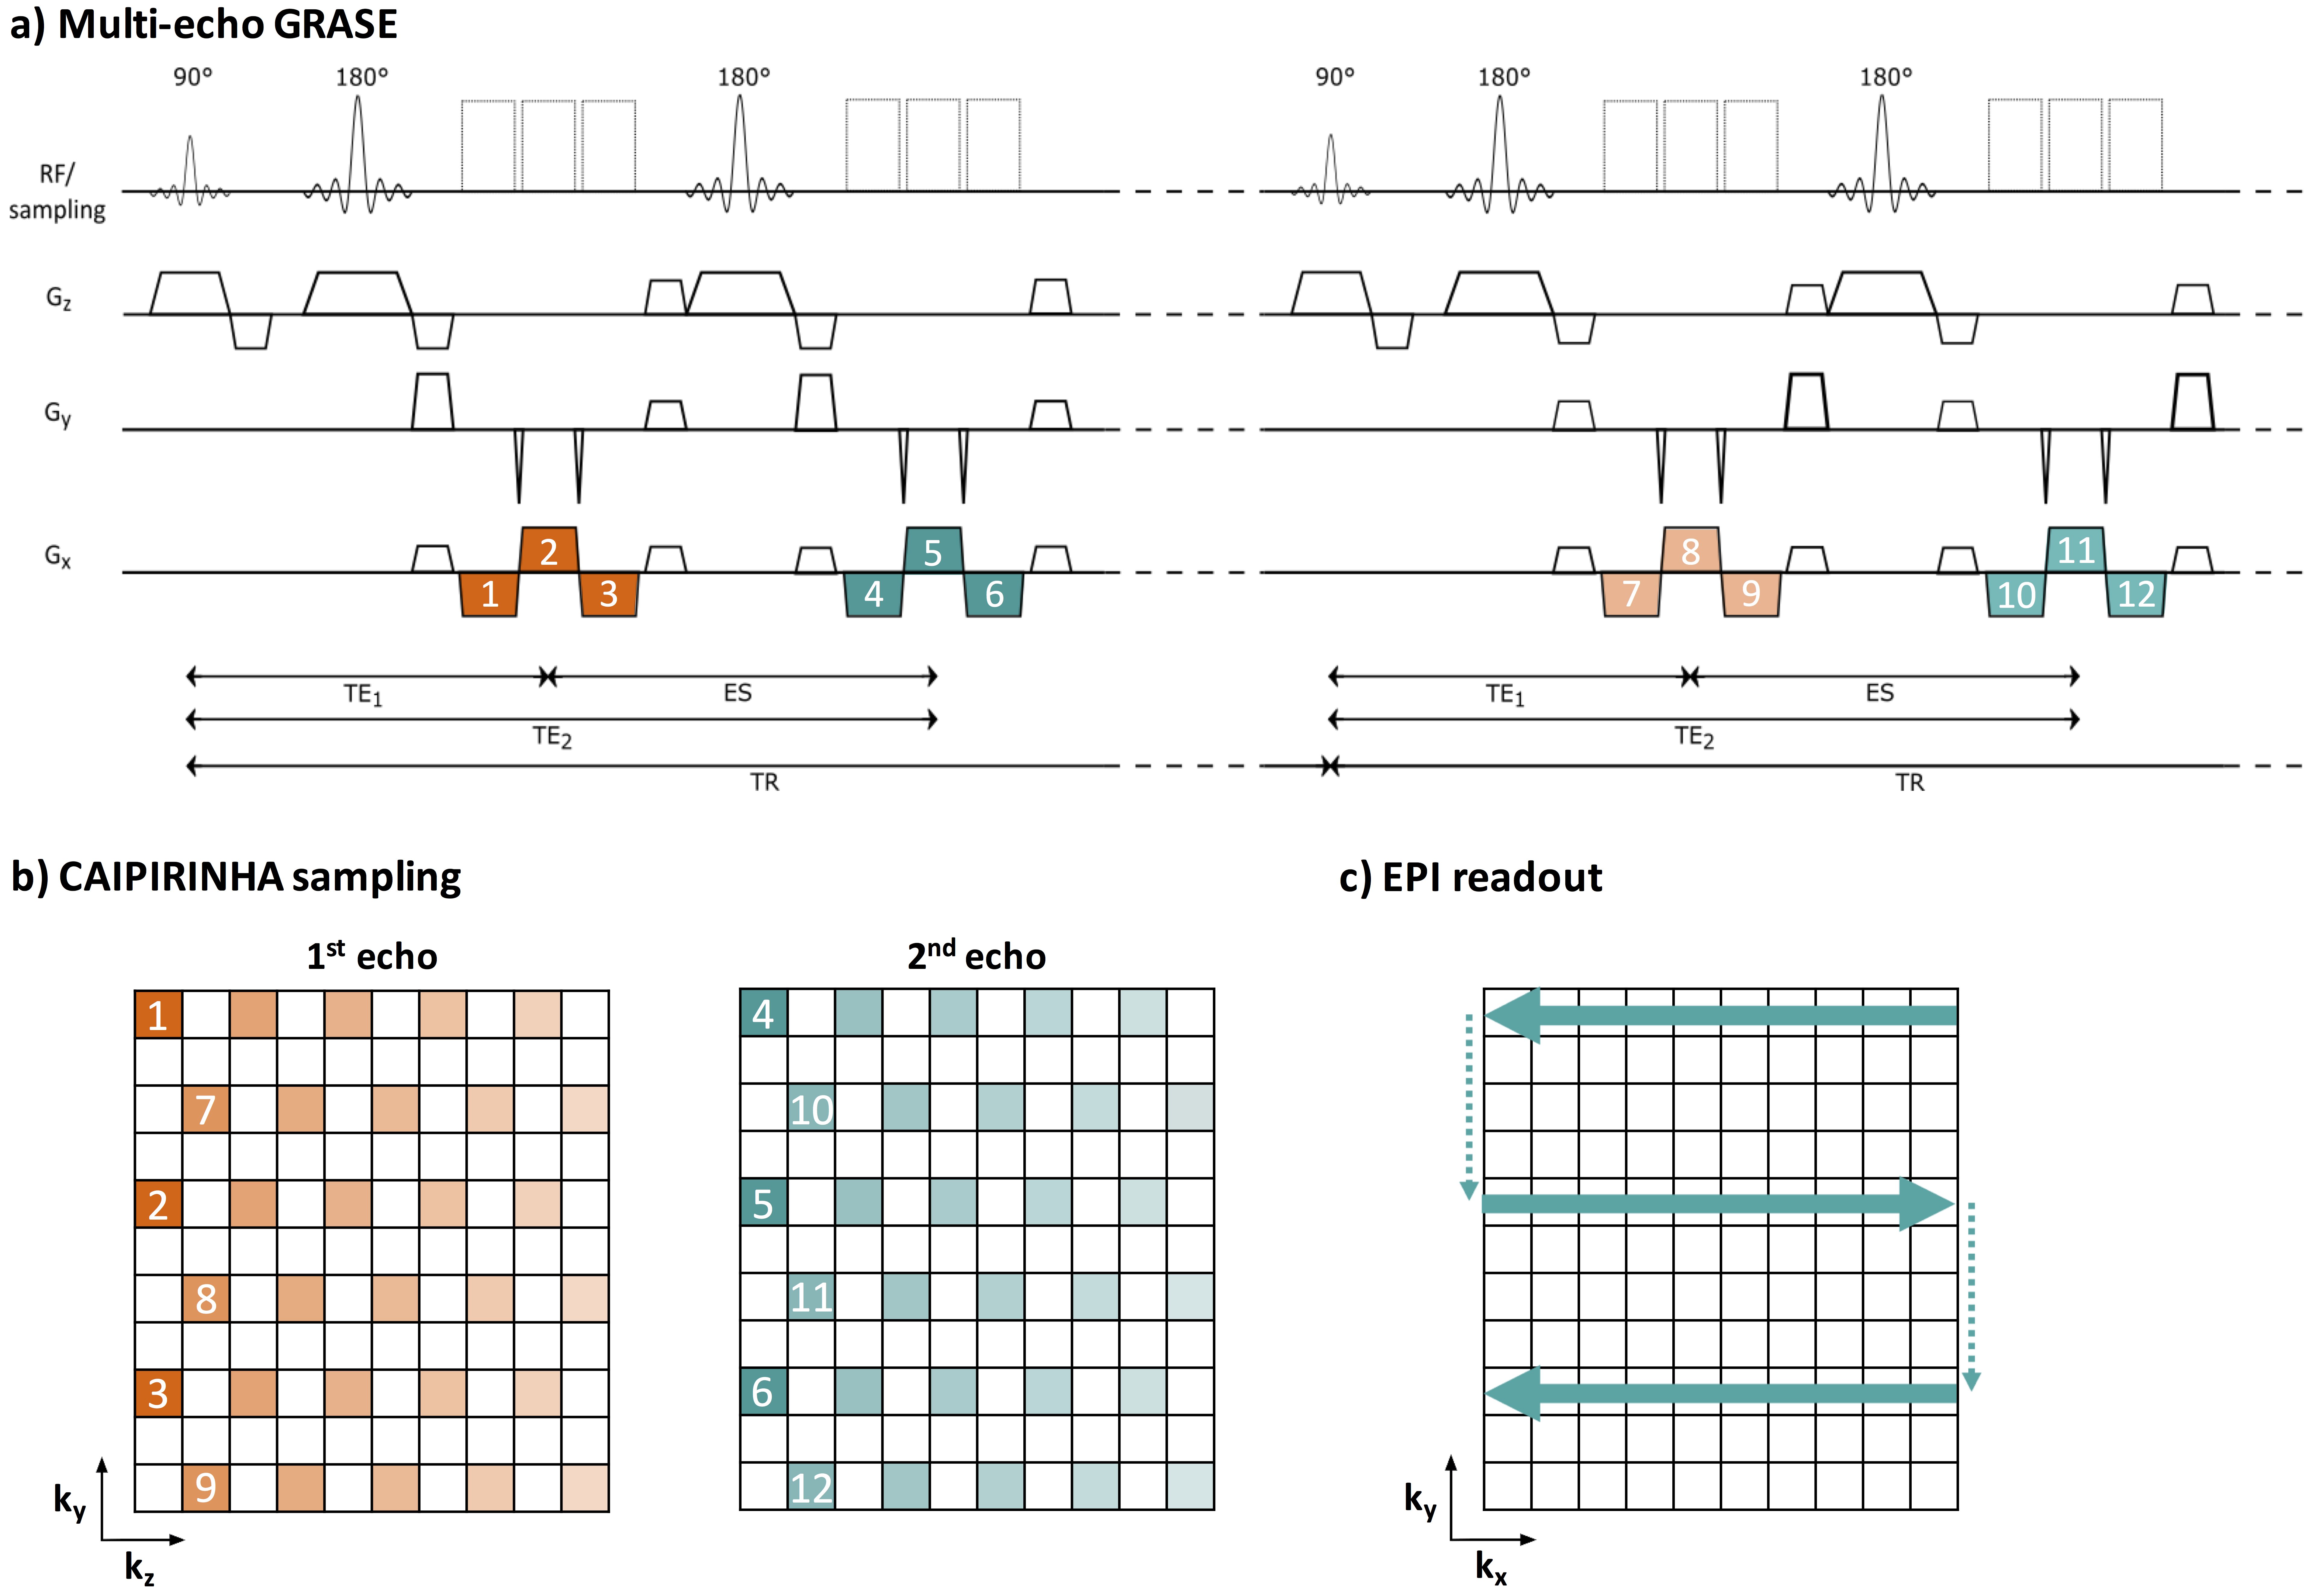
The diagram of the implemented prototype 3D multi-echo GRASE sequence is shown in Figure 1. Parallel imaging is supported in both phase-encoding directions (G$$$_y\,$$$and G$$$_z$$$). CAIPIRINHA shifts (Δk$$$z$$$) are applied between samples of subsequent TRs, i.e. samples acquired within one EPI readout have the same Δk$$$z$$$. A separate FLASH scan is acquired as calibration data to train the reconstruction kernels.
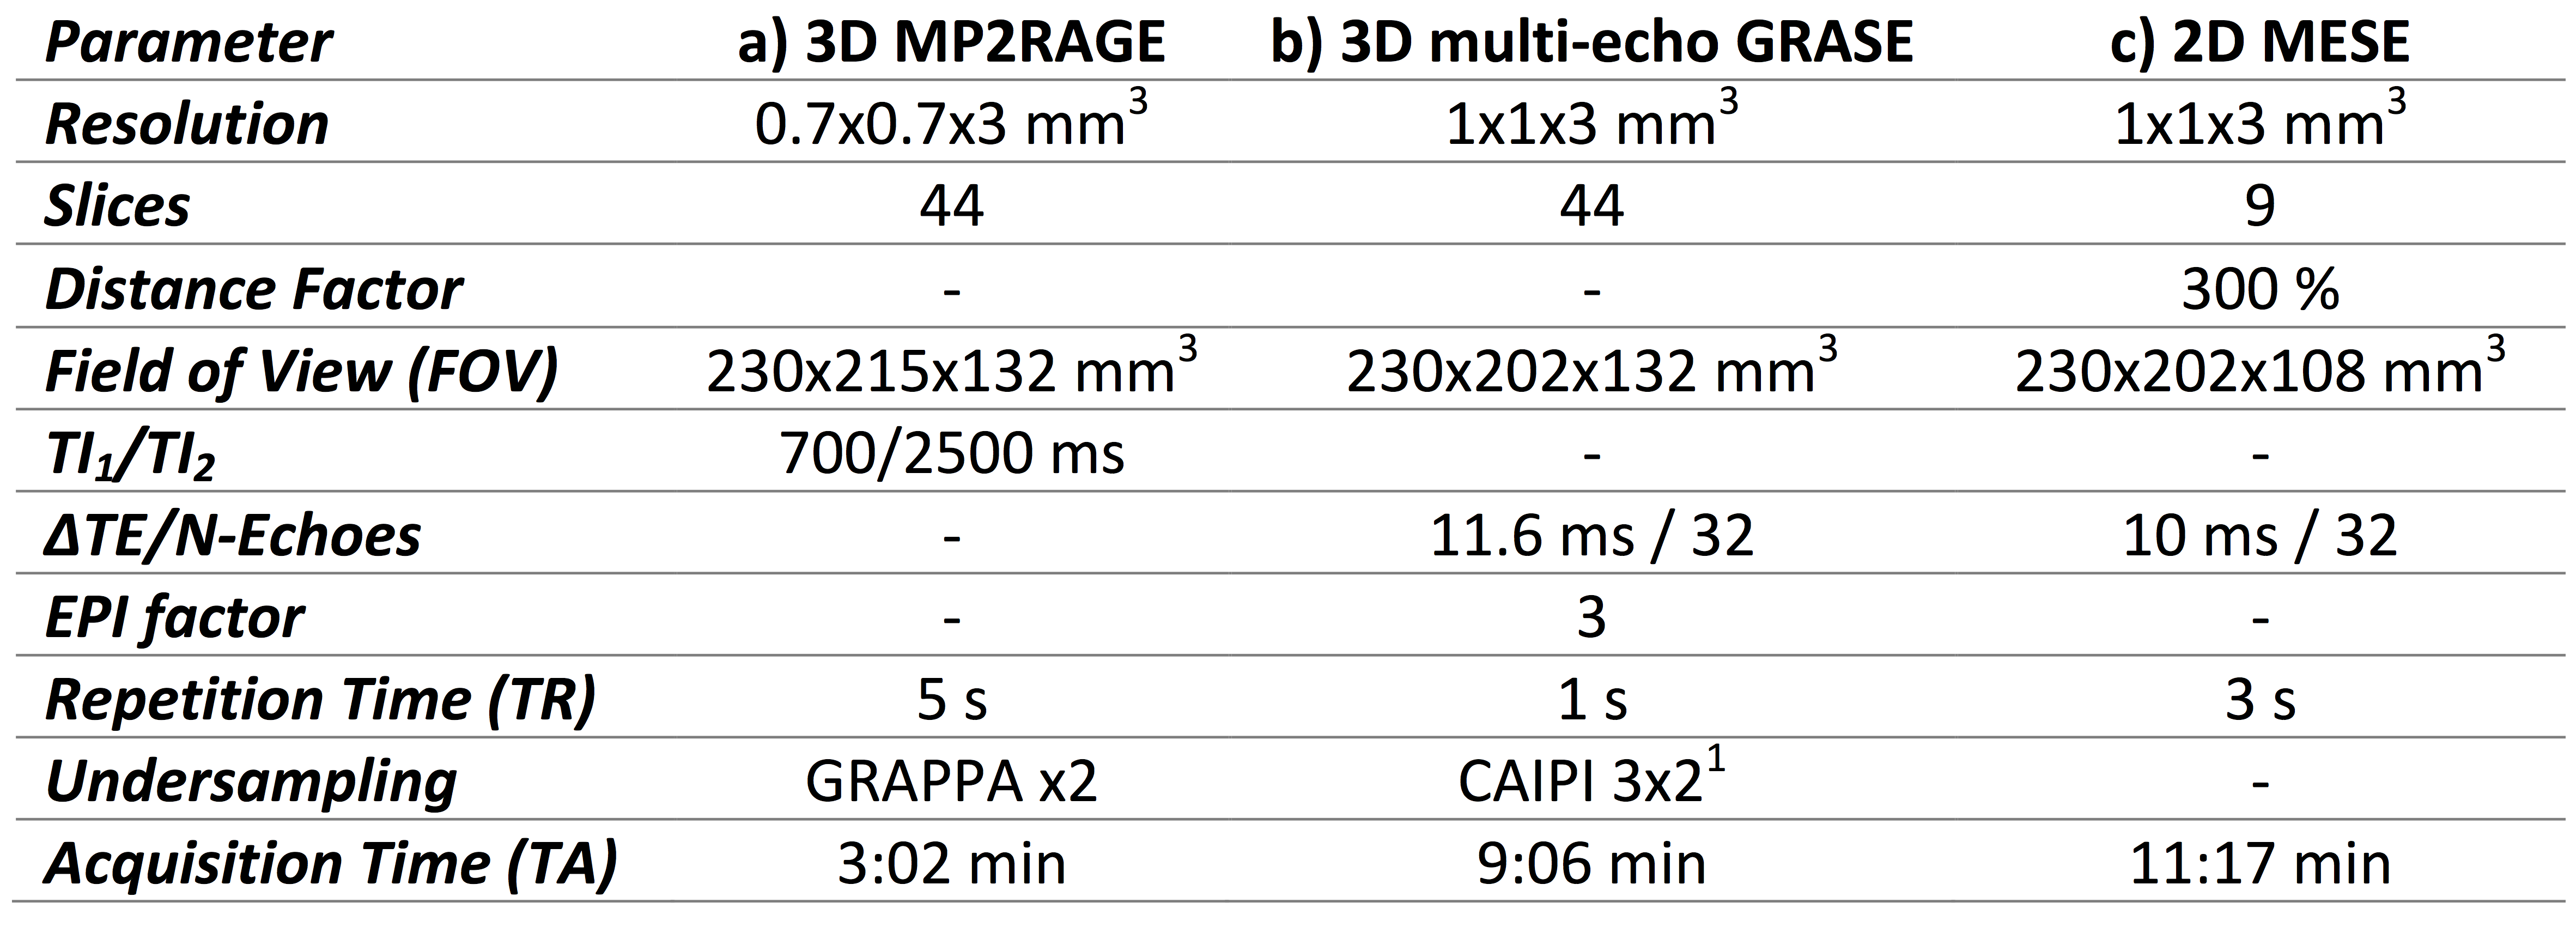
To study the impact of undersampling on the T2 decay, the multi-echo GRASE sequence was used to acquire data from a multipurpose phantom (five compartments with different concentrations of MnCl2$$$\cdot$$$4H2O). Sequence parameters are listed in Table 1 and the following sampling schemes were applied:
1) fully sampled (TA=54.03$$$\,$$$minutes);
2) CAIPIRINHA, R$$$_y$$$xR$$$_z\!$$$Δk$$$z$$$:
- 1x21 (TA=26:59$$$\,$$$minutes);
- 2x21,$$$\,$$$1x41,$$$\,$$$1x42,$$$\,$$$1x43 (TA=13:36$$$\,$$$minutes each);
- 2x31, 2x32,$$$\,$$$3x21,$$$\,$$$1x61,$$$\,$$$1x62,$$$\,$$$1x63,$$$\,$$$1x64,$$$\,$$$1x65 (TA=9:06$$$\,$$$minutes each);
- 3x31,$$$\,$$$3x32 (TA=6:24$$$\,$$$minutes each).
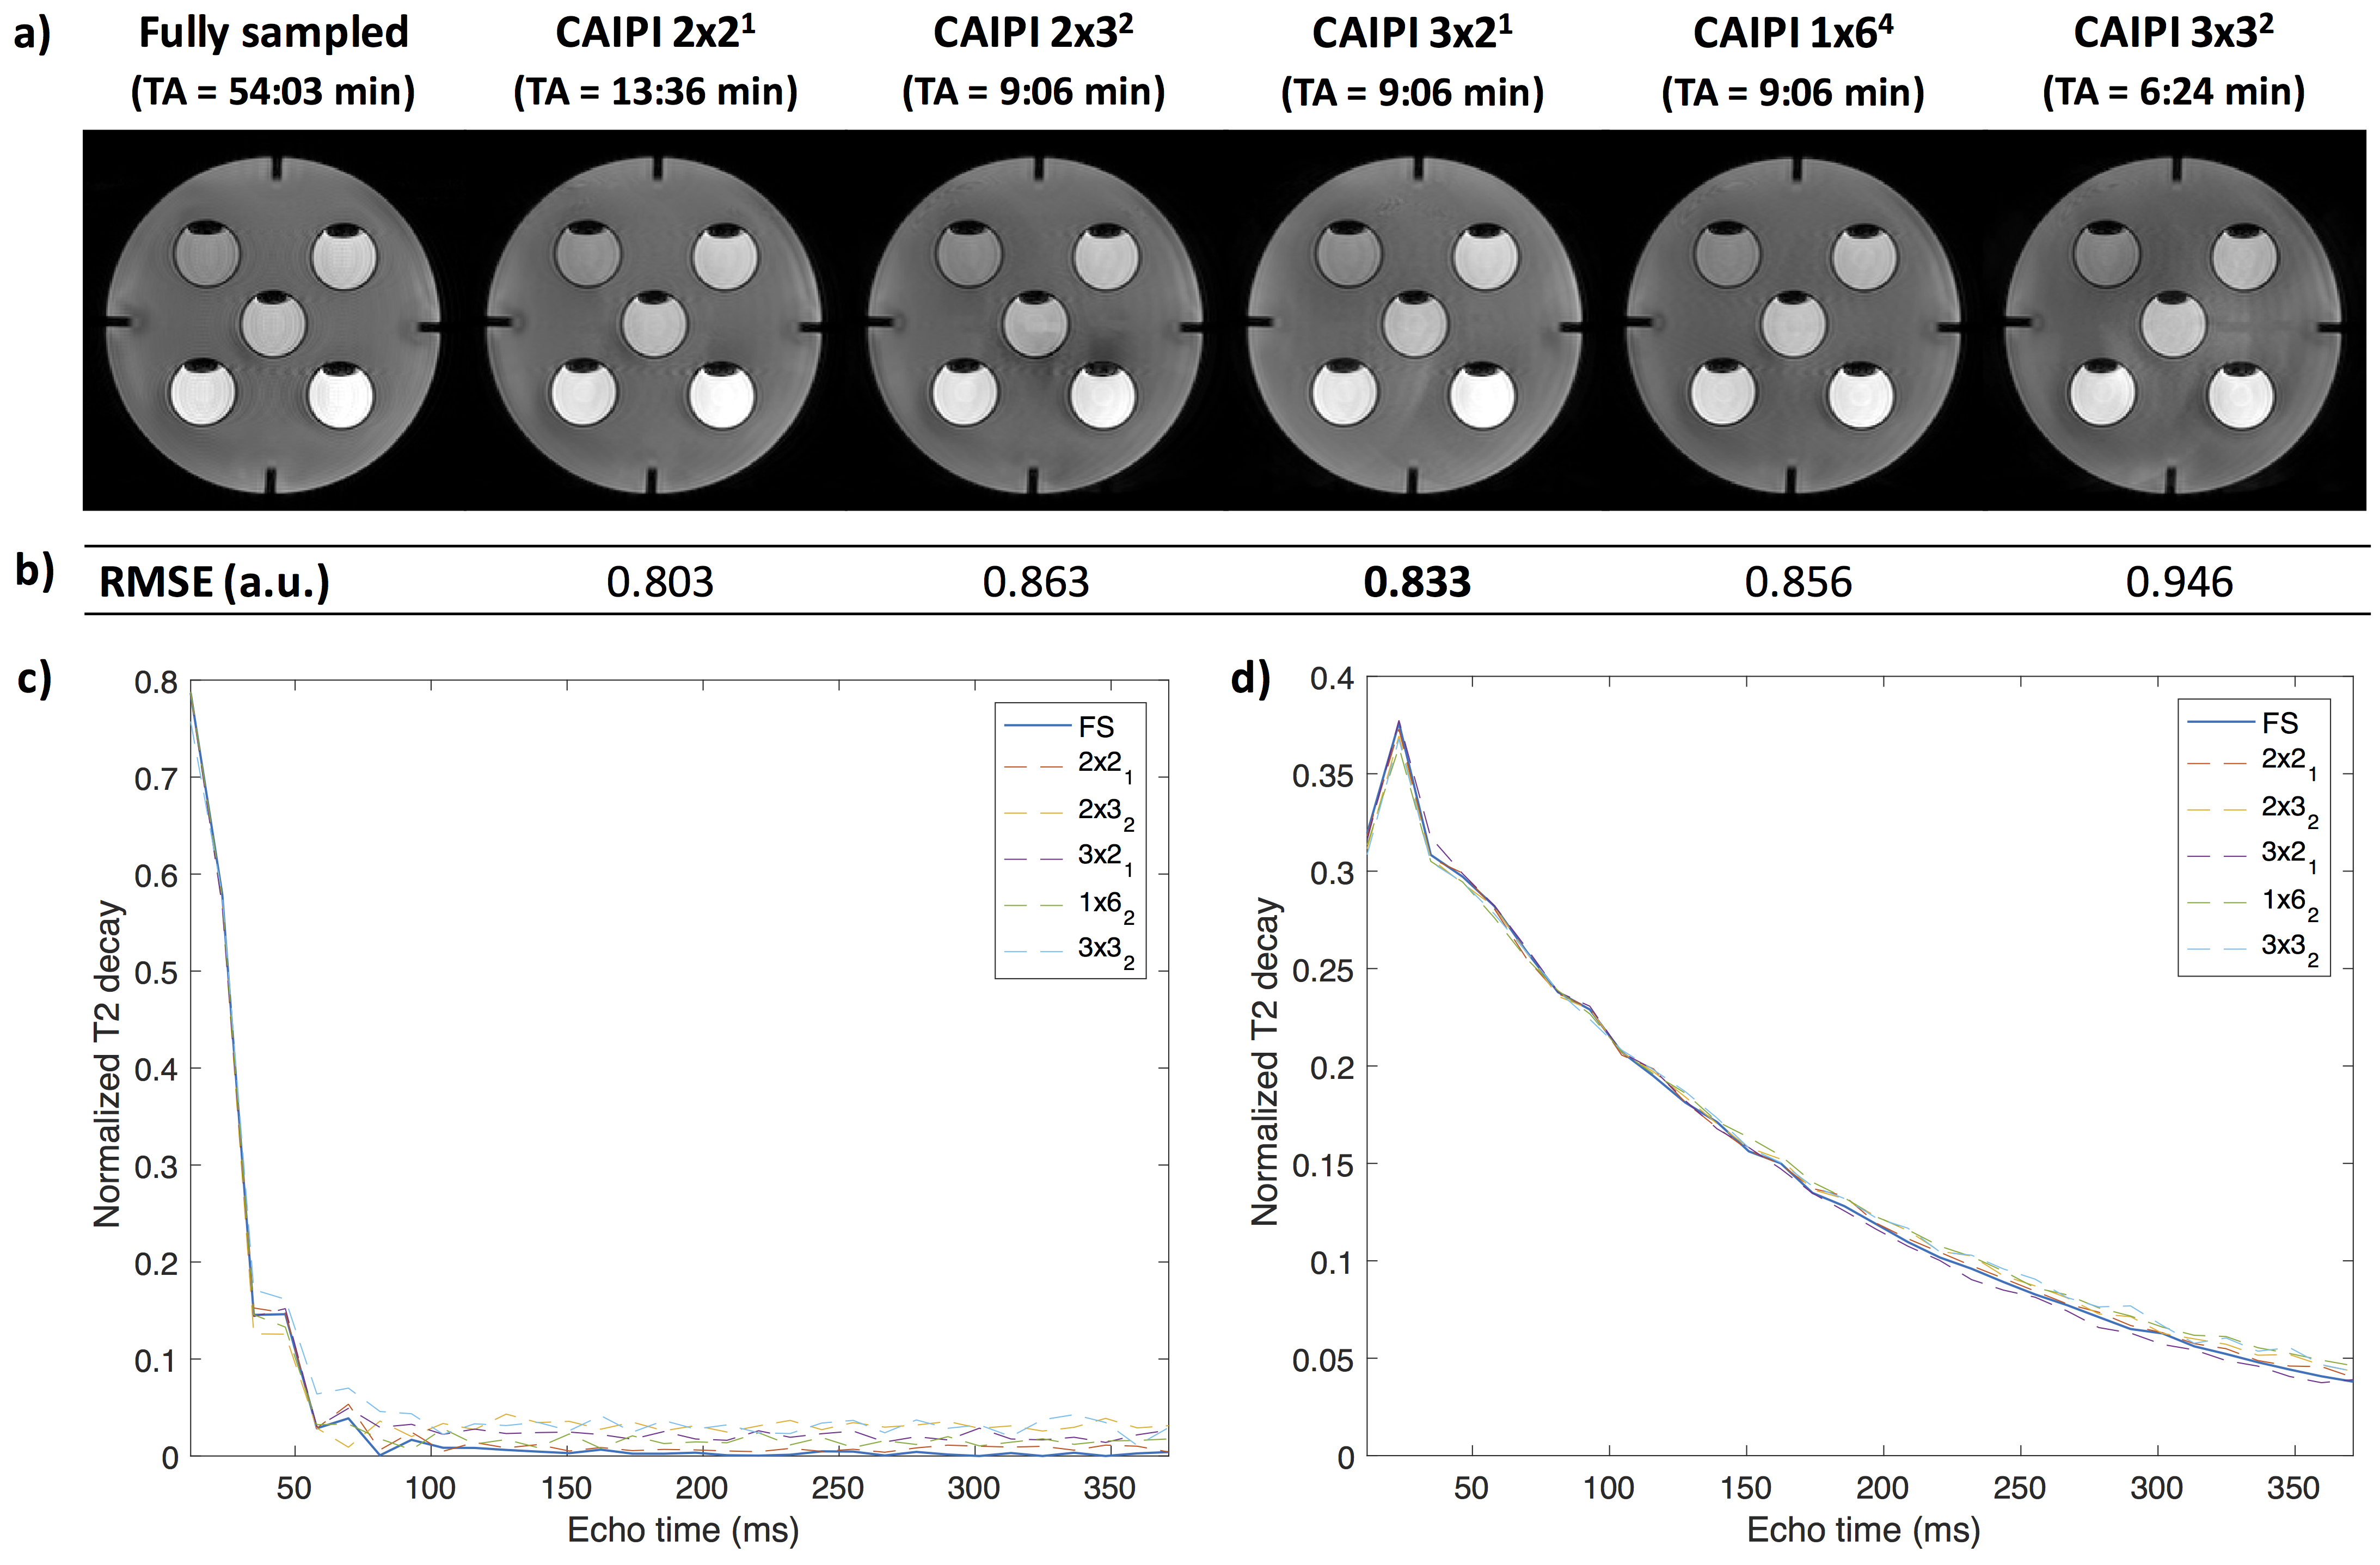
Root-mean-squared errors (RMSE) were computed between the fully sampled acquisition and each undersampled dataset.
After obtaining written informed consent, the multi-echo GRASE prototype sequence was used to acquired data from eleven volunteers (five men, age range = [23-29]$$$\,$$$y/o) at 3T (MAGNETOM Skyra, Siemens Healthcare, Erlangen, Germany) using a standard 64-channel head/neck coil. The R$$$_y$$$xR$$$_z\!$$$Δk$$$z$$$$$$\,$$$=$$$\,$$$3x21 CAIPIRINHA protocol was used since it provided the best compromise between T2 decay alterations and TA in the phantom experiment. Furthermore, a conventional 2D MESE was scanned for comparison and an MP2RAGE8 as anatomical reference (Table 1).
Brain tissues were segmented using the prototype software MorphoBox9 on the MP2RAGE volumes, which were then rigidly registered to the first echo of the MESE and multi-echo GRASE using Elastix10. MWF maps were derived from MESE (MWFMESE) and multi-echo GRASE (MWFGRASE) acquisitions using a novel MET2 analysis proposed by Canales-Rodríguez et al.11. The method employs extended-phase-graph modeling for stimulated-echo correction12 and introduces assumptions on the underlying T2 spectrum to promote its smoothness, and to better detect the myelin compartment. MWFMESE and MWFGRASE values were averaged within twelve ROIs for each volunteer, and their distributions were compared with a two-tailed t-test. Agreement was investigated via a correlation analysis and Bland-Altman plot13.
Results
In the phantom experiment, the RMSE increased with the acceleration factor; T2 decays increasingly deviated from the fully sampled dataset with the echo time (Figure 2). The undersampling introduced ghosting artefacts in the T2-weighted images, whereas the position of these artifacts depends on the CAIPIRINHA scheme. The undersampling R$$$_y$$$xR$$$_z\!$$$Δk$$$z$$$$$$\,$$$=$$$\,$$$3x21 provided a smaller RMSE among the schemes with an acceleration factor of six and was thus selected for the in vivo acquisitions.
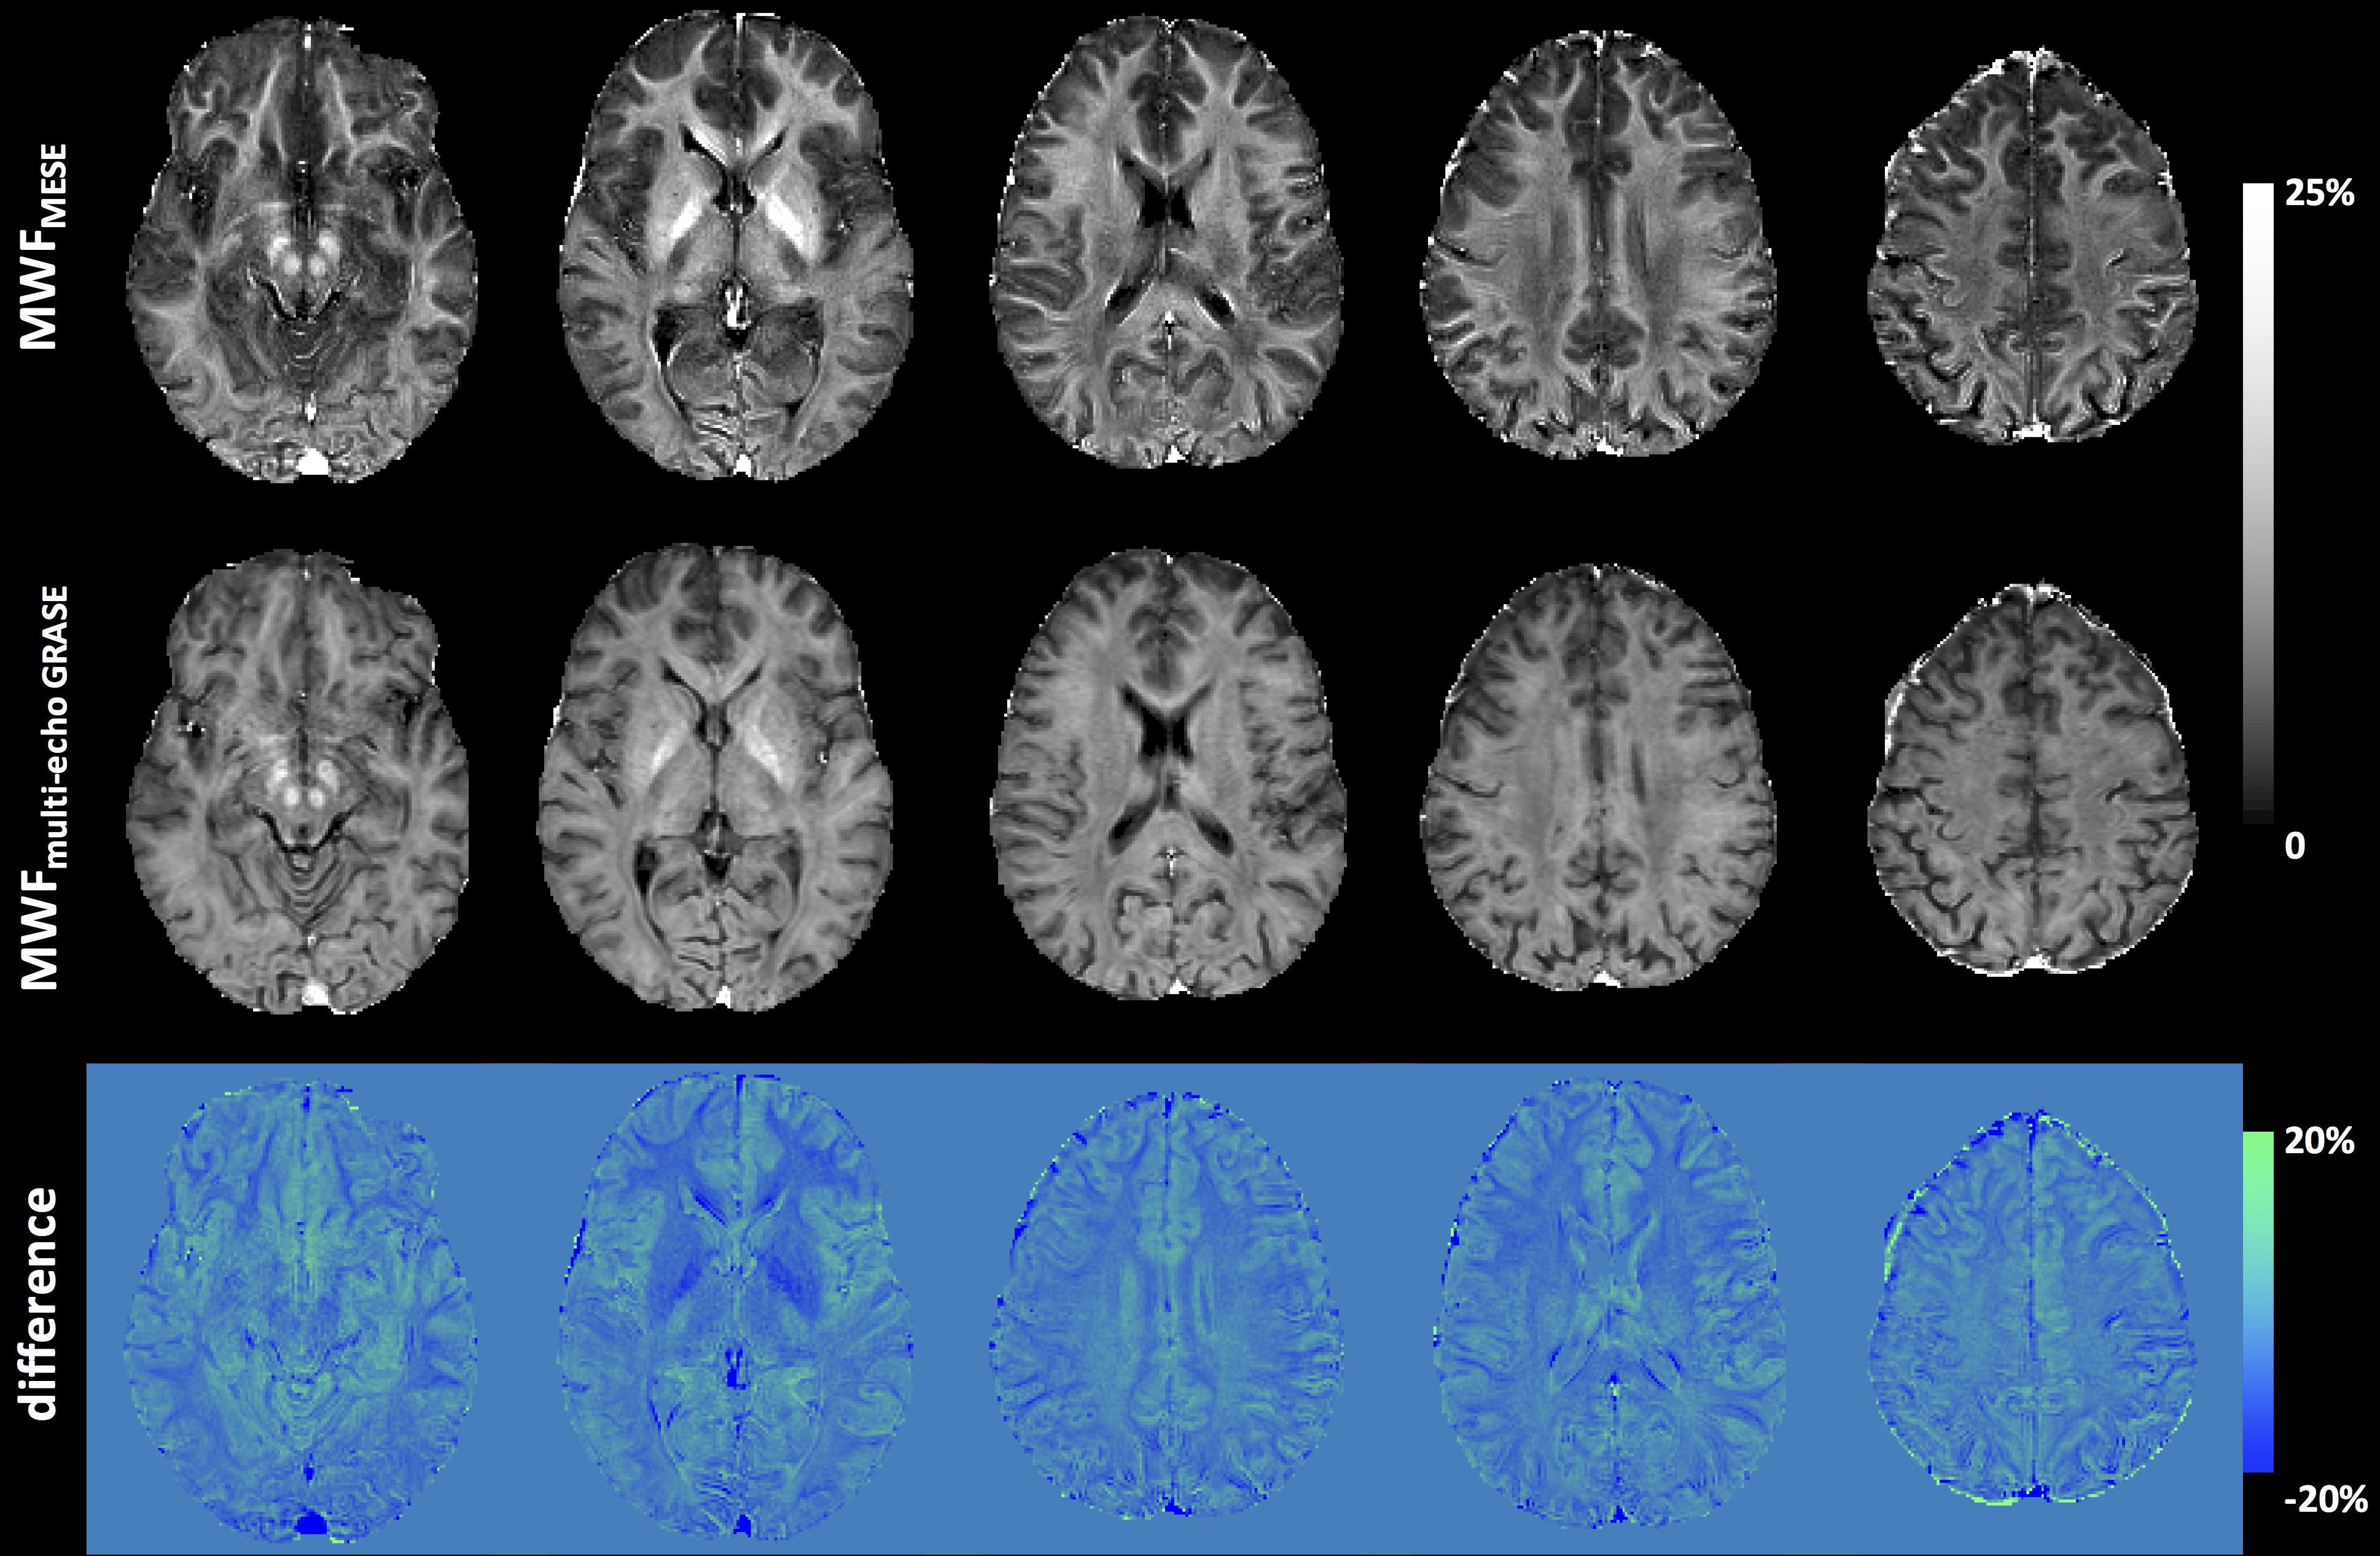
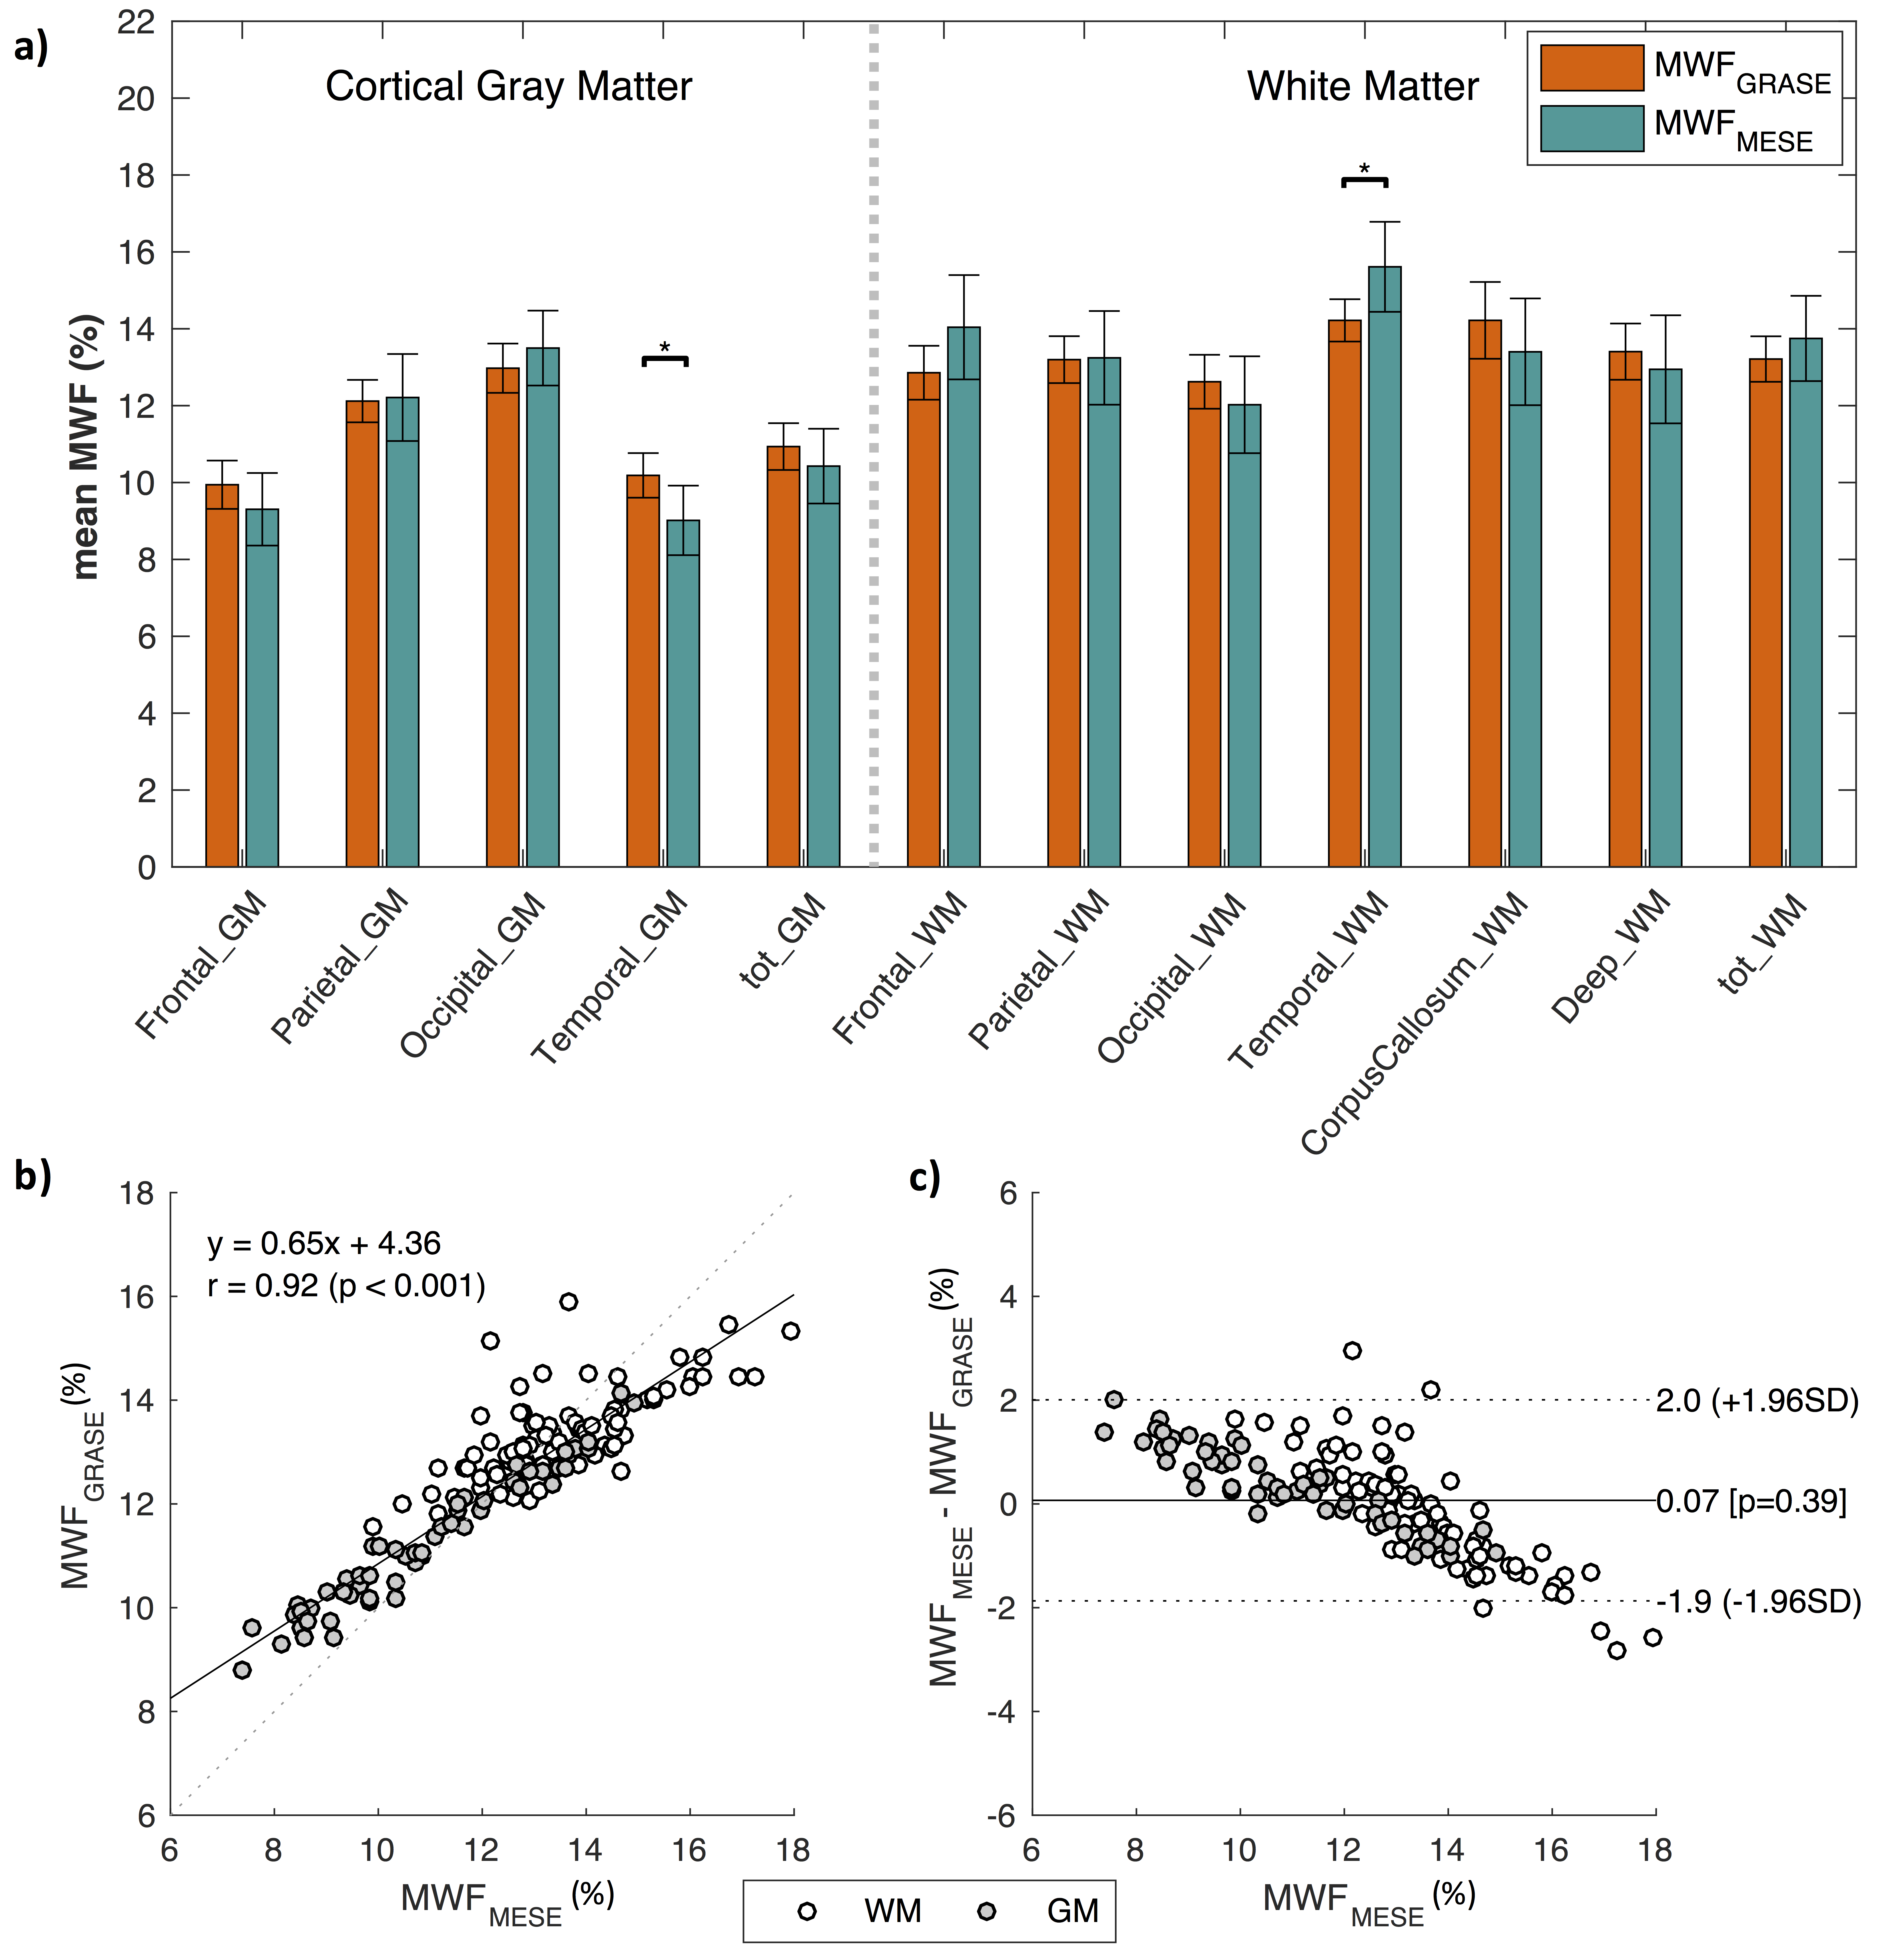
Example MWFMESE and MWFGRASE maps are shown in Figure 3. The comparison among the selected ROIs only showed a significant difference (p<0.0042 after Bonferroni’s correction) between MWFMESE and MWFGRASE in the WM and GM of the temporal lobe (Figure 4). High correlation was found between MWFMESE and MWFGRASE values (Pearson’s r=0.92). The Bland-Altman analysis revealed a mean difference of 0.07% with the 95% of confidence interval spanned from -1.9% and 2% (Figure 4).
Discussion
The proposed multi-echo GRASE sequence provides MWF maps comparable with the gold-standard method based on MESE acquisitions. The 3D nature of the GRASE sequence overcomes the limitations of the MESE related to interleaved slice sampling (e.g., SAR deposition and magnetization transfer impact on T2 decays14). By combining the multi-echo GRASE with CAIPIRINHA, resolution and TA were improved with respect to the state-of-art5.
Future work is planned to investigate different undersampling strategies to even further accelerate the sequence. For instance, a study with retrospective undersampling of fully sampled acquisitions and compressed sensing reconstruction showed promising results15. Moreover, clinical validation of the maps remains to be performed, e.g. by comparison with post-mortem samples.
Conclusion
Whole-brain MWI was achieved with a 3D multi-echo GRASE (44 slices, 1x1x3$$$\,$$$mm3) in 9:06 minutes using CAIPIRINHA. Resulting MWF values correlate with conventional MESE-based maps (r=0.92). The increased resolution and shortened TA may help to widen the use of MWI in clinical research.Acknowledgements
No acknowledgement found.References
1. Reich DS, Lucchinetti CF, Calabresi PA. Multiple Sclerosis. N Engl J Med. 2018;378(2):169-180.
2. Bouhrara M, Reiter DA, Bergeron CM, et al. Evidence of demyelination in mild cognitive impairment and dementia using a direct and specific magnetic resonance imaging measure of myelin content. Alzheimer’s Dement. 2018;14(8):998-1004.
3. Dean III DC, Sojkova J, Hurley S, et al. Alterations of myelin content in parkinson’s disease: a cross-sectional neuroimaging study. PLoS One. 2016;11(10):e0163774.
4. Heath F, Hurley SA, Johansen-Berg H, Sampaio-Baptista C. Advances in noninvasive myelin imaging. Dev Neurobiol. 2018;78(2):136-151.
5. Prasloski T, Rauscher A, MacKay AL, et al. Rapid whole cerebrum myelin water imaging using a 3D GRASE sequence. Neuroimage. 2012;63(1):533-539.
6. Mackay A, Whittall K, Adler J, Li D, Paty D, Graeb D. In vivo visualization of myelin water in brain by magnetic resonance. Magn Reson Med. 1994;31(6):673-677.
7. Breuer FA, Blaimer M, Mueller MF, et al. Controlled aliasing in volumetric parallel imaging (2D CAIPIRINHA). Magn Reson Med. 2006;55(3):549-556.
8. Marques JP, Kober T, Krueger G, van der Zwaag W, Van de Moortele P-F, Gruetter R. MP2RAGE, a self bias-field corrected sequence for improved segmentation and T1-mapping at high field. Neuroimage. 2010;49(2):1271-1281.
9. Schmitter D, Roche A, Maréchal B, et al. An evaluation of volume-based morphometry for prediction of mild cognitive impairment and Alzheimer’s disease. NeuroImage Clin. 2015;7:7-17.
10. Klein S, Staring M, Murphy K, Viergever MA, Pluim JPW. Elastix: a toolbox for intensity-based medical image registration. IEEE Trans Med Imaging. 2010;29(1):196-205.
11. Canales-Rodríguez EJ, Pizzolato M, Piredda GF, et al. Robust Myelin Water Imaging from multi-echo T2 data using second-order Tikhonov regularization with control points. Submitted in parallel to ISMRM 2019.
12. Hennig J. Multiecho imaging sequences with low refocusing flip angles. J Magn Reson. 1988;78(3):397-407.
13. Altman DG, Bland JM. Measurement in Medicine: The Analysis of Method Comparison Studies. Source J R Stat Soc Ser D (The Stat). 1983;32(3):307-317.
14. Santyr GE. Magnetization transfer effects in multislice MR imaging. Magn Reson Imaging. 1993;11(4):521-532.
15. Szu H, Chen -Meng, Ljungberg E, Mackay AL, Kozlowski P. Compressed Sensing 3D GRASE with Group-Sparse Reconstruction for Brain Myelin Water Imaging. Proc Int Soc Magn Reson Imaging. 2017.
Figures