4249
Comparison of 7T MRS Reproducibility Using either Creatine or Water Referencing in Patients with SchizophreniaAnna Min Wang1,2, Laura M Rowland1,3, Andrea Wijtenburg3, and Peter B Barker1,2
1Department of Radiology and Radiological Science, The Johns Hopkins University School of Medicine, Baltimore, MD, United States, 2F. M. Kirby Research Center for Functional Brain Imaging, Kennedy Krieger Institute, Baltimore, MD, United States, 3Department of Psychiatry, Maryland Psychiatric Research Center, University of Maryland School of Medicine, Baltimore, MD, United States
Synopsis
This study investigated the reproducibility of 7T MRS of gray and white matter in ten patients with schizophrenia (SZ), using either water or total creatine (tCr) as internal references. All ‘high concentration’ metabolites such as NAA, glutamate, choline and others, and some low concentration metabolites, such as glutamine and NAAG were reliably determined. Referencing to either water or tCr gave similar reproducibility.
Purpose
Establishing the reproducibility of spectroscopic measurements is of high importance when planning studies in clinical populations; this is especially true in conditions such as psychiatric diseases, where metabolic changes are often very subtle (1). Results may also be influenced by choice of reference signal for quantification; the two most commonly used internal references are either total creatine (tCr) or the unsuppressed water signal from the same voxel. The aim of this study was to assess the reproducibility of metabolite measurements in representative gray and white matter voxel locations at 7T in patients with SZ using either referencing to tCr or water.Methods
Ten clinically stable patients with SZ (7 males, 39.2±12.4 years-old) were scanned twice, one-week apart, using a 7T scanner (Philips ‘Achieva’, Best, Netherlands) equipped with a 32-channel head coil (Nova Medical, Wilmington, MA, max B1 = 15 μT). Spectra were acquired using a STEAM sequence (TR/TE/TM=3000/14/33 ms, 64 NEX) with VAPOR water suppression from the anterior cingulate cortex (ACC; 30x20x20 mm3) and left centrum semiovale (CSO; 40x20x15 mm3). In addition, a scan without water suppression was also acquired from each voxel (2 NEX, 1 dummy scan) to be used for phase and eddy current correction. Spectra were analyzed using the LCModel software package (2) and a basis set containing 20 metabolites simulated from VeSPA (3). Metabolite concentrations of γ-aminobutyric acid (GABA), glutamate (Glu), glutamine (Gln), glutathione (GSH), myo-inositol (mI), N-acetylaspartate (NAA), N-acetylaspartylglutamate (NAAG), total Choline (tCho), total NAA (tNAA), Glx (Glu+Gln) and tCr are reported referenced to both unsuppressed water and tCr. Results with CRLB > 20% were excluded (except for NAAG in ACC which the CRLB cutoff was set as 40%). Reproducibility was assessed via intra-class correlation coefficients (ICCs) and coefficients of variation (CVs). The ICC was calculated using a two-way random-effect model with measures of absolute agreement (4). The CV was calculated as the SD/mean within patients, i.e. between two measurements. The paired t-test was employed to compare the CV between referencing to water and to tCr with significance set to p<0.05.Results
Figure 1 (A) displays T1W images acquired from one participant with the voxel localizations shown as red boxes. Representative ACC spectra from two visits are presented in Figure 1 (B). A summary of the average measurement outcomes of all included metabolites in ACC and CSO is shown as Table 1. The general fitting quality is shown as the average CRLB values from LCModel. Figure 2 illustrates the ICC results testing the absolute agreement of the measurement from the two visits. Figure 3 presents comparison of the CVs of the two referencing methods for all included metabolites. The two referencing methods have similar reproducibility in both ACC and CSO. ACC had worse CV for Gln and NAAG. NAAG in CSO has a significantly lower CV with referencing to water than to tCr (p = 0.02, t = 2.82).Discussion
This study measured the reproducibility of 7T MRS in a SZ patient cohort for both high concentration metabolites such as NAA, tCho, mI and Glu, as well as low concentration metabolites such as Gln, GSH, NAAG and GABA that may play an important role in the pathophysiology of schizophrenia. In general, the ICC was good for most metabolites, except GABA and GSH in the ACC (which might be due to the small inter-subject variations). Similar CVs were found for both referencing methods, suggesting that choice of reference compound does not have a large influence on reproducibility. A priori, however, there is no particular reason to expect either reference signal to remain unchanged over time or regions in pathological conditions. A number of confounds that may affect the voxel water signal include the need for CSF-correction, chemical shift displacement effects (if the transmit frequency is not set on resonance for the water reference), steady-state magnetization effects (e.g. for a small number of excitations), variable water content (depends on tissue fractions) and relaxation times, magnetization transfer effects from OVS pulses, and others. Similarly, the tCr signal will vary depending on tissue composition, and also has a magnetization transfer effect from water. Therefore, neither signal is ideal as a reference and alternative quantitation techniques may be valuable to develop in the future.Conclusion
7T MRS in patients with SZ gave reproducible measurements for all the high concentration compounds as well as some of the lower concentration metabolites such Gln and NAAG in ACC and CSO regions. Referencing to either water or tCr gave similar reproducibility.Acknowledgements
No acknowledgement found.References
[1] R.G. Steen, R.M. Hamer, J.A. Lieberman, Measurement of brain metabolites by 1H magnetic resonance spectroscopy in patients with schizophrenia: a systematic review and meta-analysis, Neuropsychopharmacology, 30 (2005) 1949-1962. [2] S.W. Provencher, Automatic quantitation of localized in vivo 1H spectra with LCModel, NMR in Biomedicine, 14 (2001) 260-264. [3] B. Soher, P. Semanchuk, D. Todd, J. Steinberg, K. Young, VeSPA: integrated applications for RF pulse design, spectral simulation and MRS data analysis, Proc Int Soc Magn Reson Med, 2011, pp. 1410. [4] T.K. Koo, M.Y. Li, A guideline of selecting and reporting intraclass correlation coefficients for reliability research, Journal of chiropractic medicine, 15 (2016) 155-163.Figures
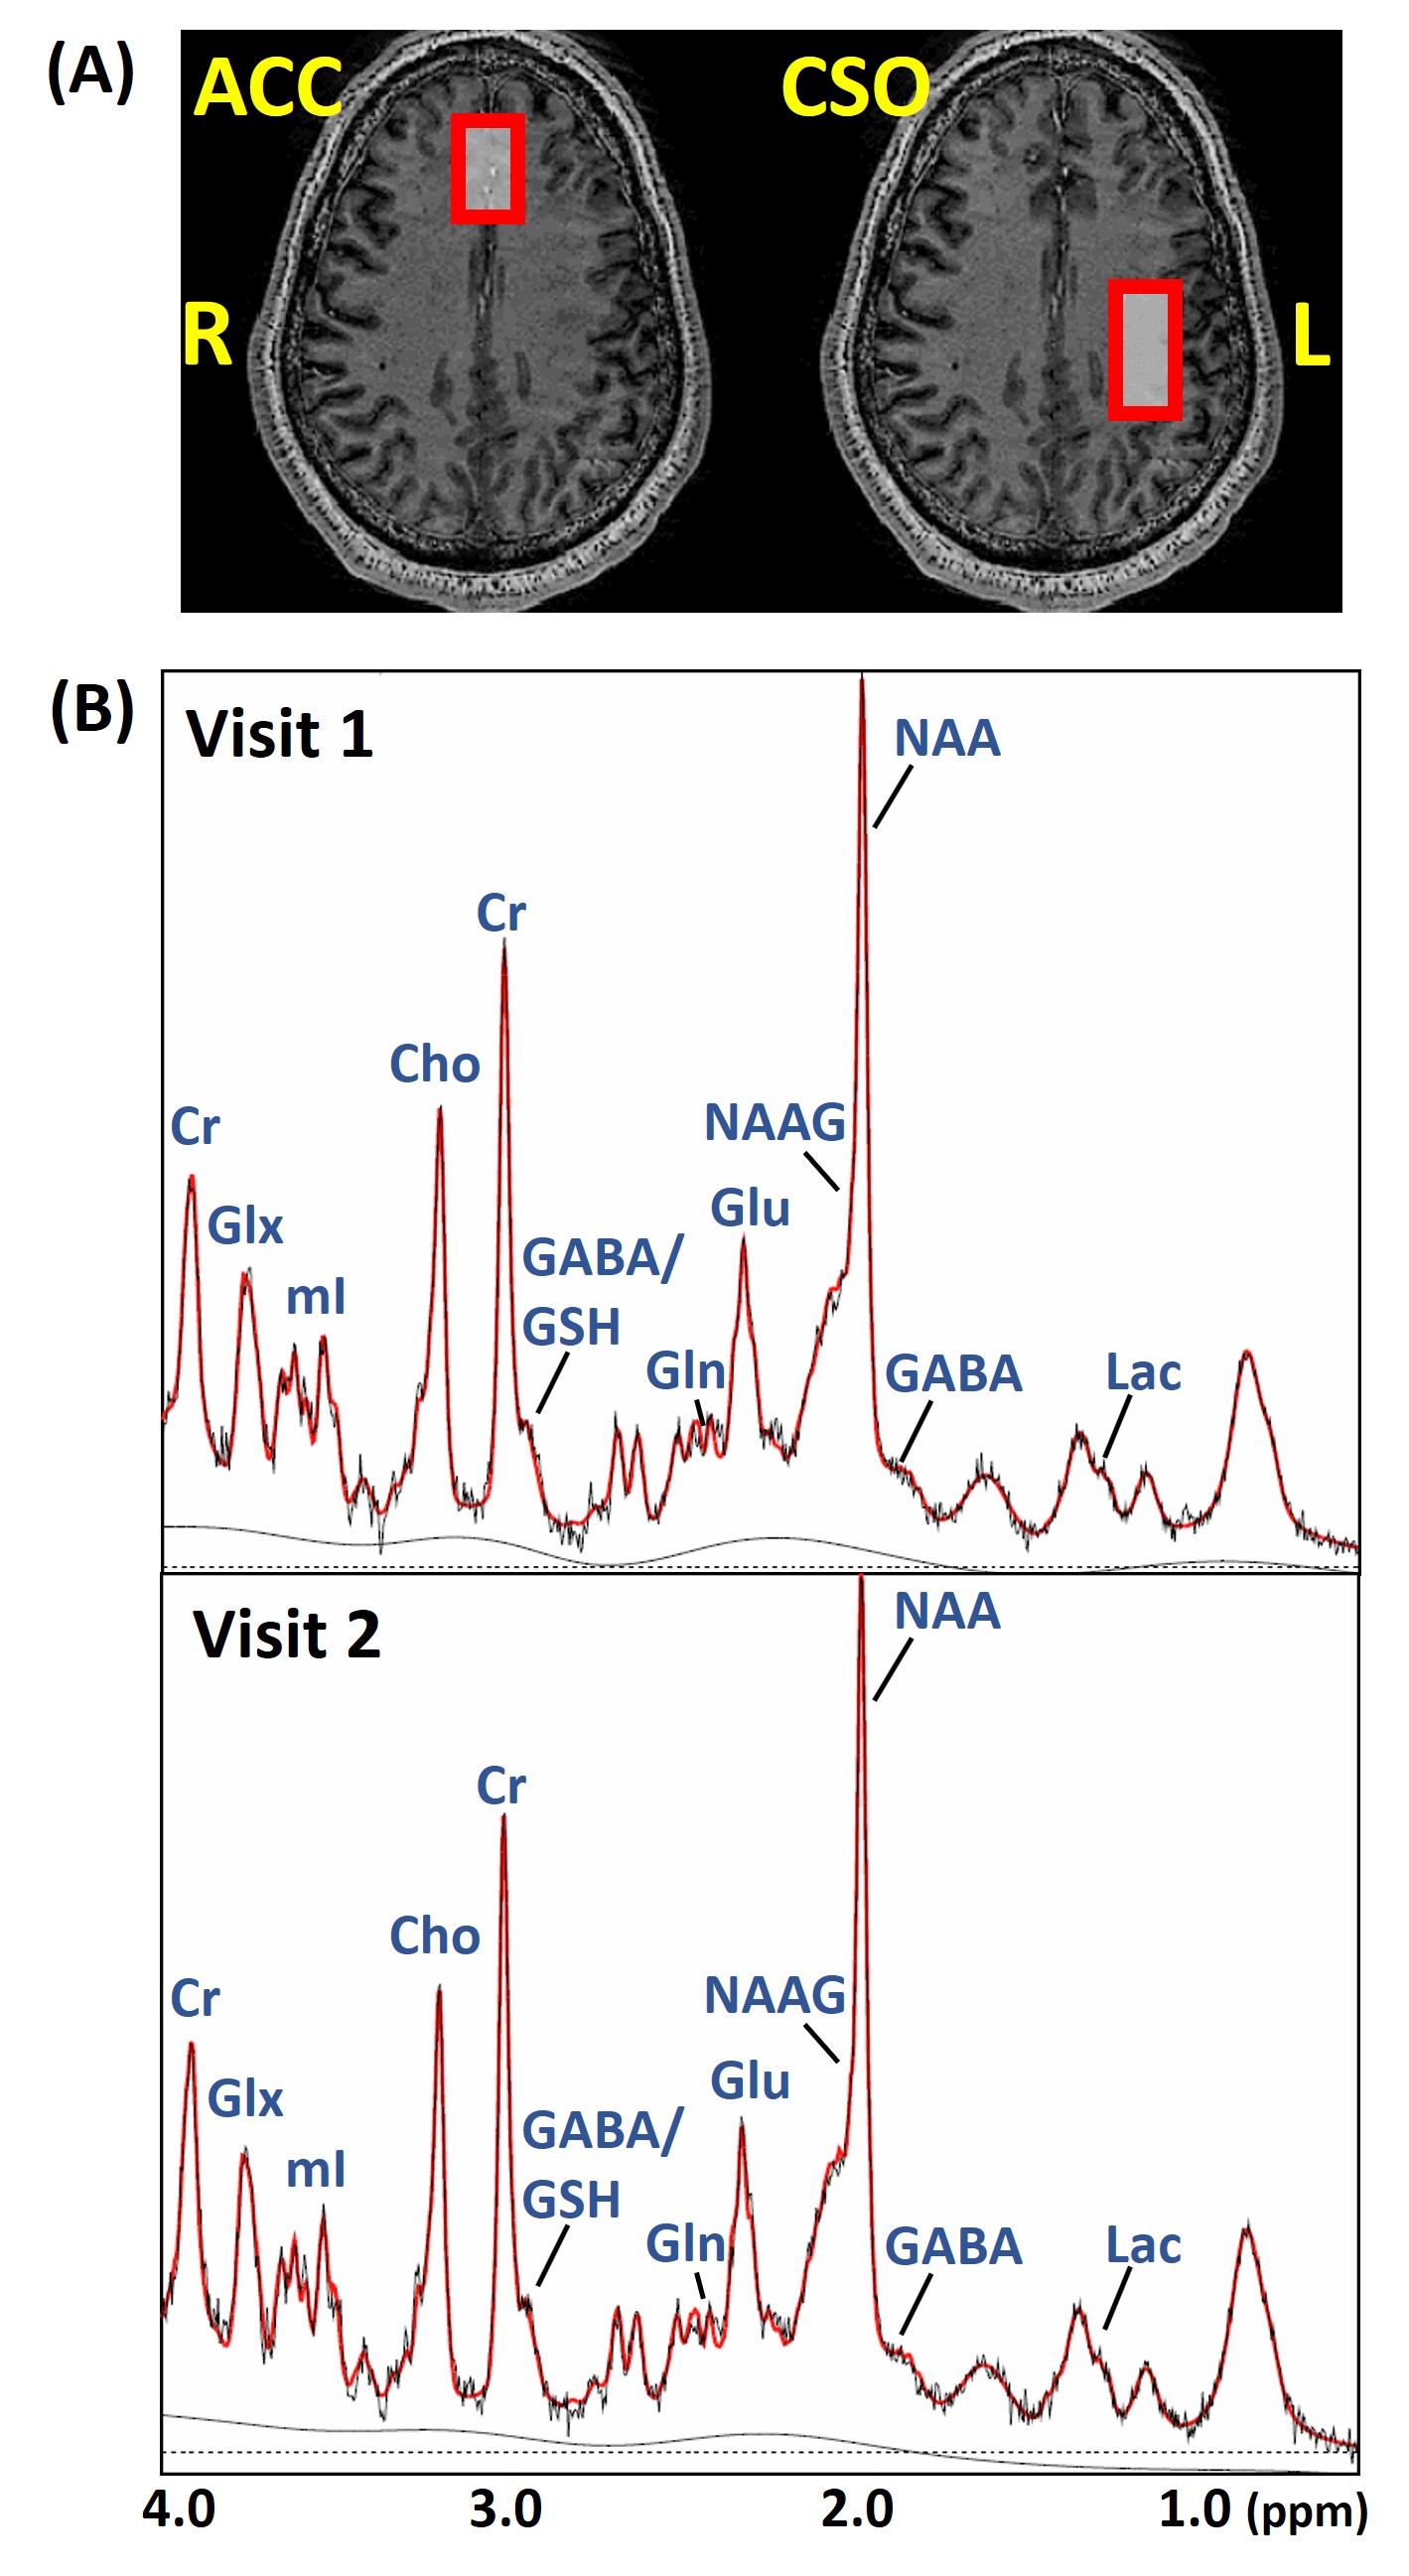
Figure 1. (A) T1W images
from one subject. Red boxes represent the MRS voxel locations. (B) Typical ACC spectra
acquired at two time points from one participant.
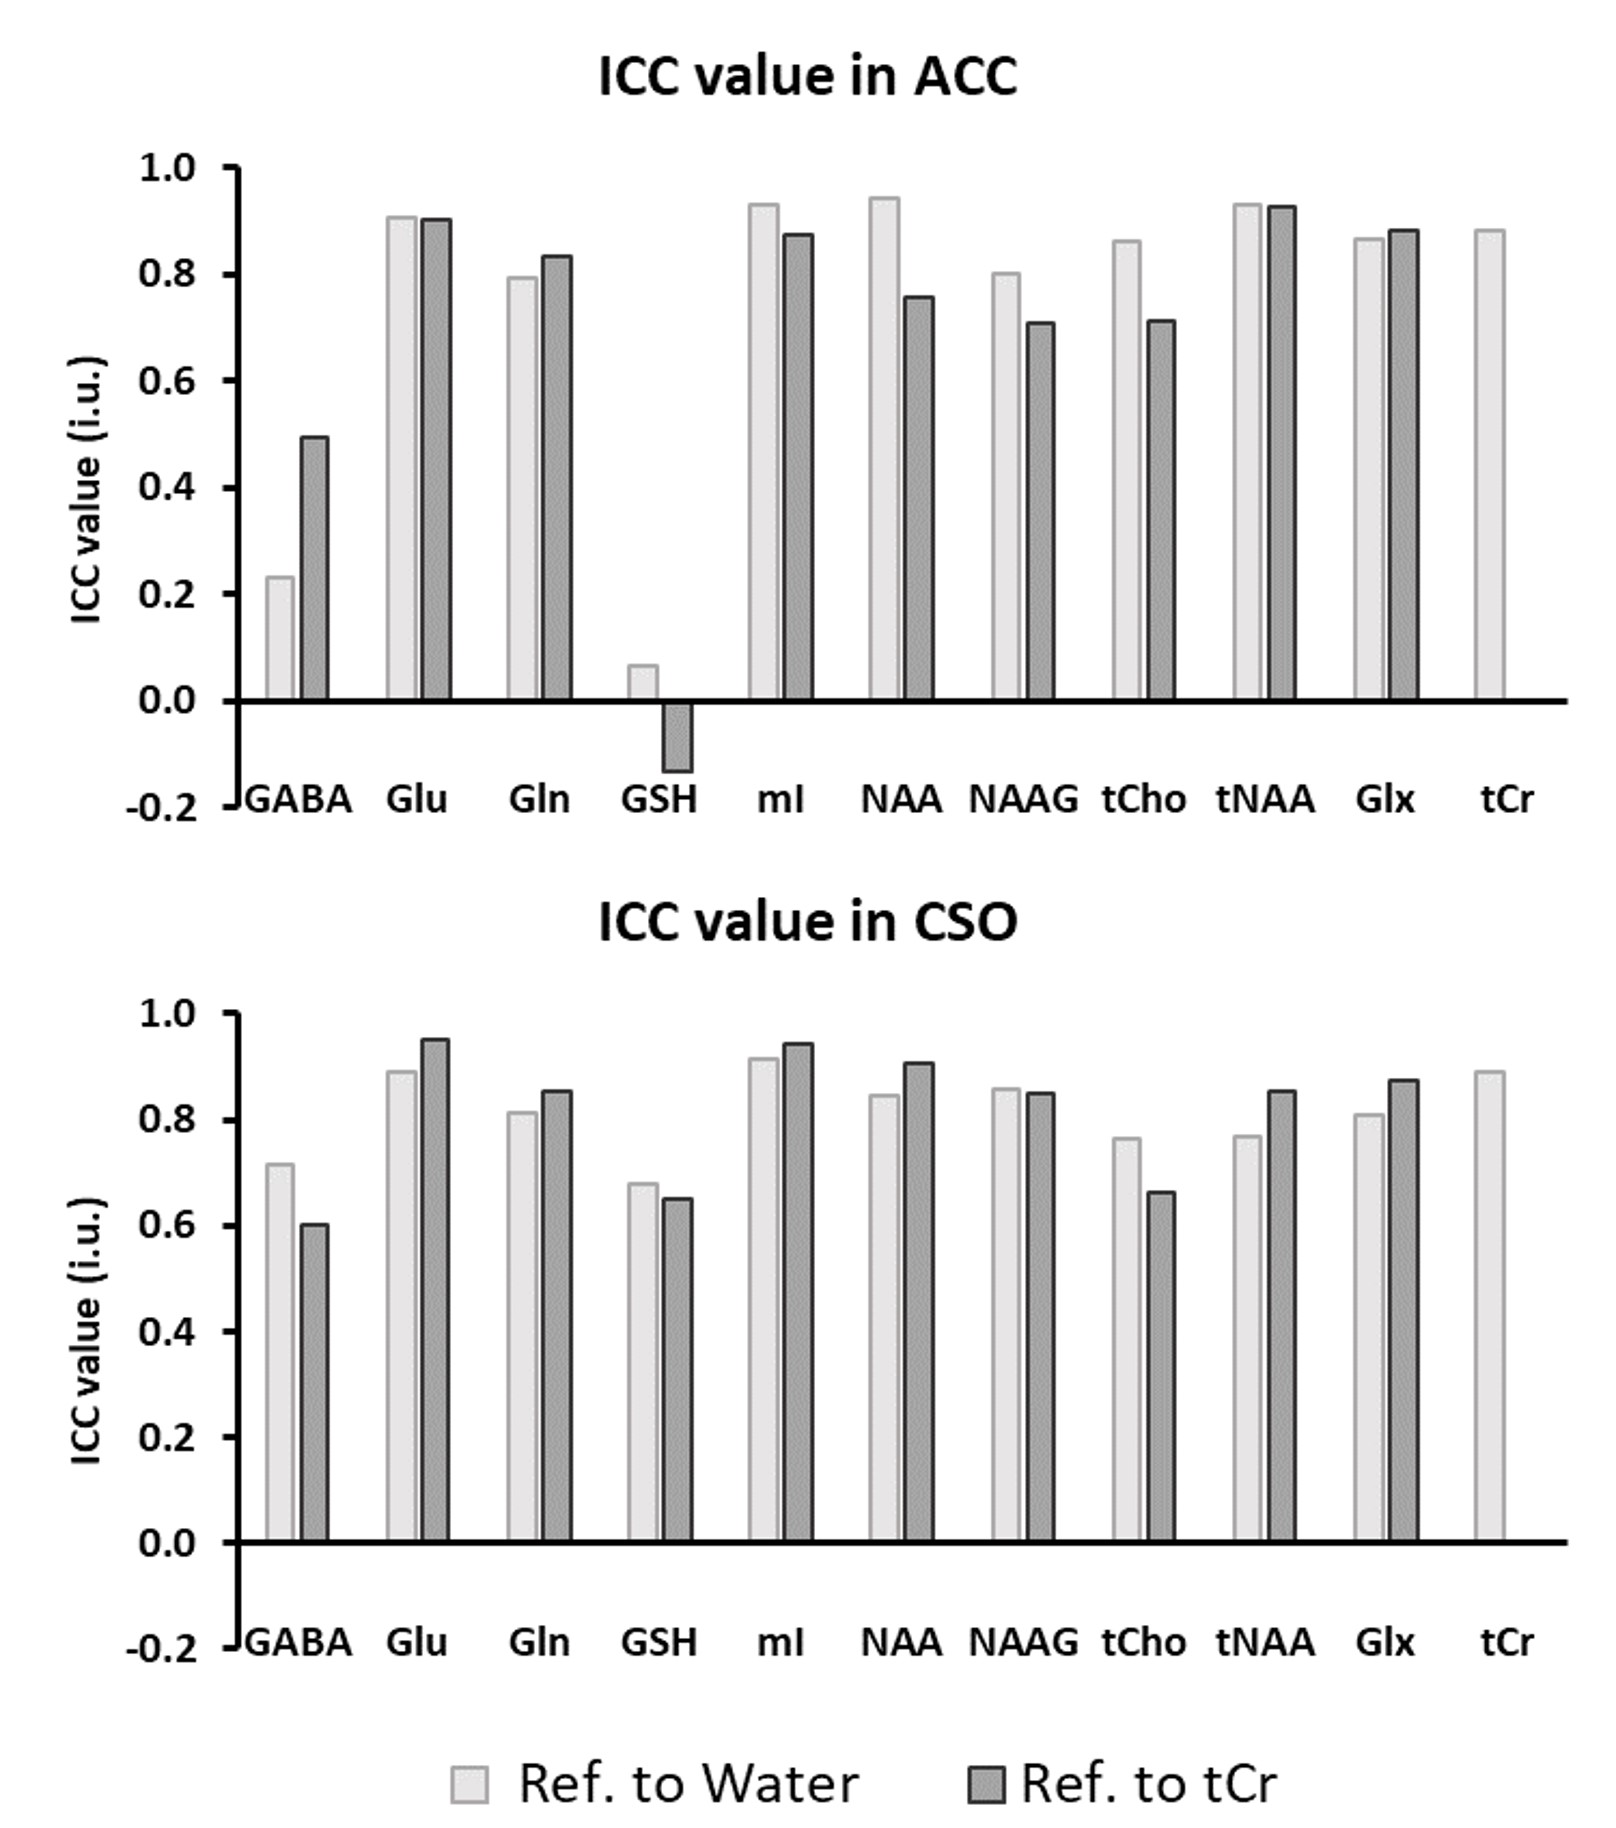
Figure 2. Summary of ICC values for all
included metabolites in ACC and CSO
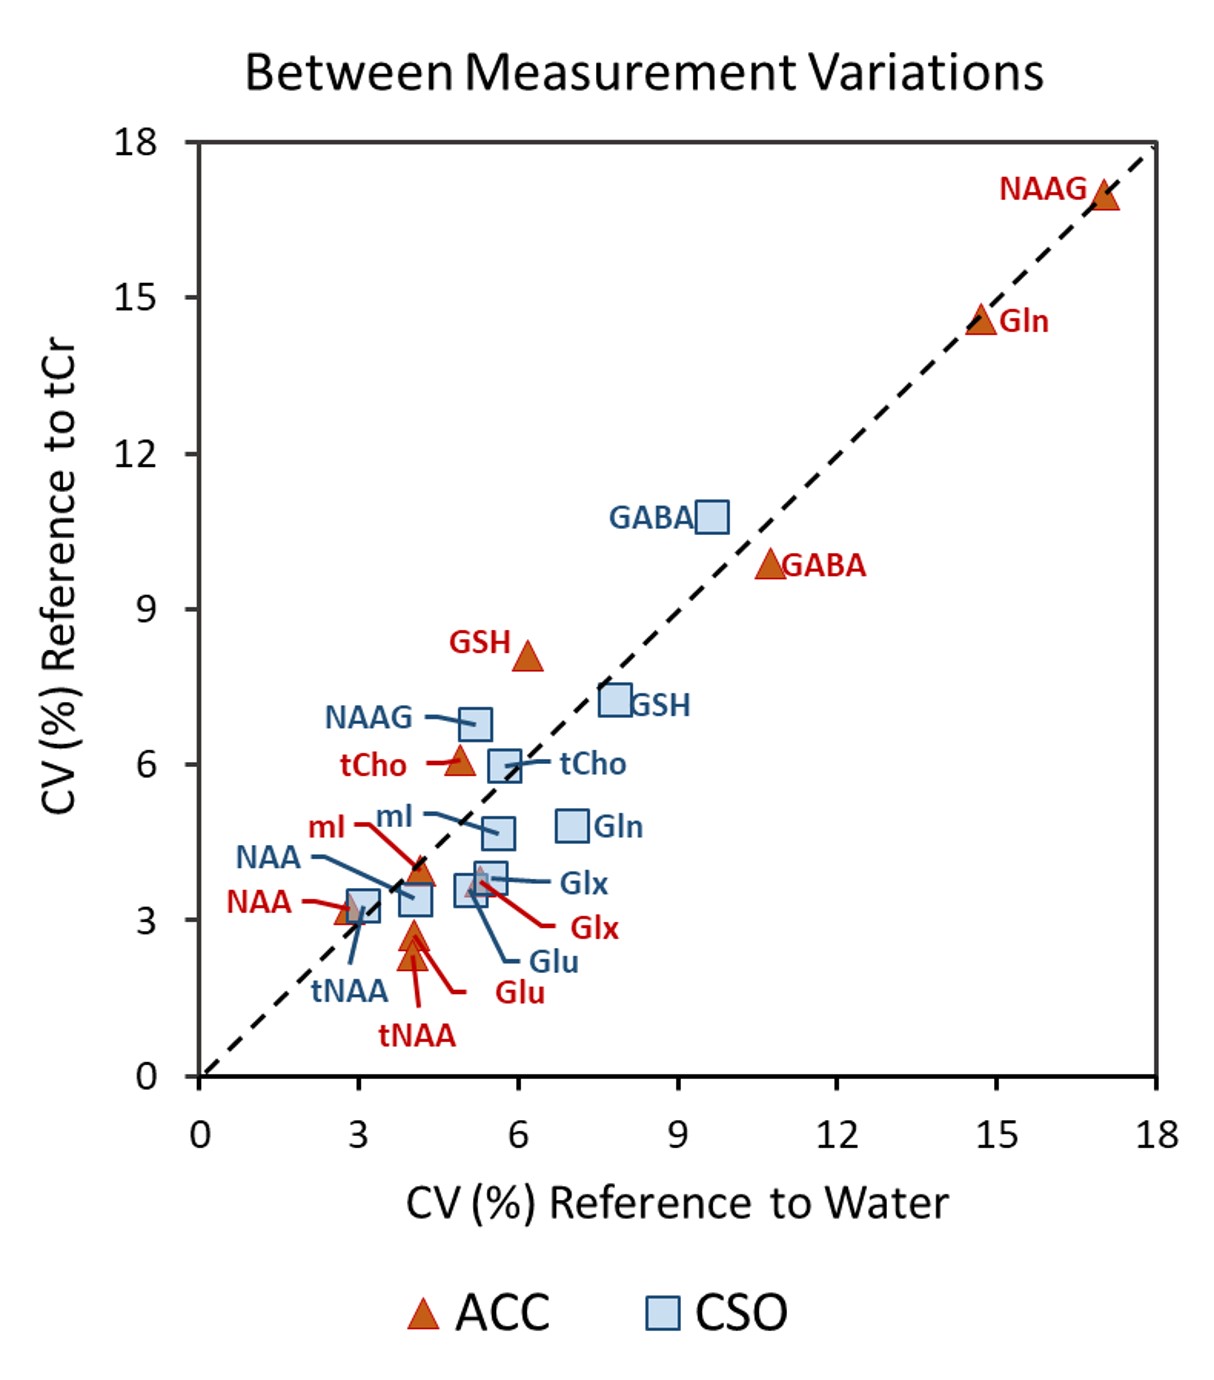
Figure 3. The comparison of the averaged
between measurement variations of the two referencing methods in ACC and CSO
for all included metabolites.
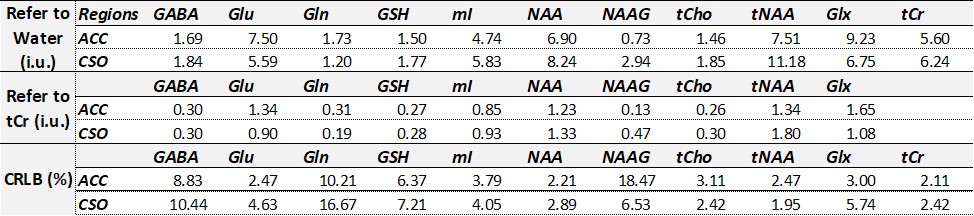
Table 1. Summary of all the average
values of metabolite levels referencing to water and to tCr, as well as the
average CRLB (%SD) values.