4236
Personalised Water Scaling: Quantifying absolute metabolite concentrations using measured tissue water content and attenuation maps1Physics and Astronomy, University of British Columbia, Vancouver, BC, Canada, 2International Collaboration on Repair Discoveries (ICORD), Vancouver, BC, Canada, 3Business Unit MR, Philips, Mississauga, ON, Canada, 4UBC MRI Research Centre, University of British Columbia, Vancouver, BC, Canada, 5ImageTech Lab, Simon Fraser University, Surrey, BC, Canada, 6Radiology, University of British Columbia, Vancouver, BC, Canada, 7Pathology and Laboratory Medicine, University of British Columbia, Vancouver, BC, Canada
Synopsis
A quantitative total water content and relaxation method (TWC) was compared to the commonly used segmentation based approach (SEG) to calculate absolute metabolite concentrations in magnetic resonance spectroscopy. Significantly different water concentrations and attenuation factors were found between TWC and SEG in both grey and white matter from scans of 6 healthy controls at 3T. These differences led to significantly different concentrations of total creatine and myo-inositol in white matter, and N-acetyl-aspartate, total creatine, and glutamate in grey matter. The TWC approach is a promising alternative to improve MRS concentration estimates across healthy and diseased cohorts, and different MRI scanners.
Introduction
Magnetic resonance spectroscopy (MRS) measures relative signals arising from spins on different metabolites, to increase the specificity and sensitivity to changes caused by disease, it is optimal to convert these relative signals to absolute concentrations. Several methods are often used, including segmentation-based (SEG) approaches and external phantoms1. At higher fields, external phantoms suffer from B1 inhomogeneity that can be difficult to correct. While the SEG method is more convenient, it relies on assumed tissue water relaxation constants and concentrations ([H2O]), to estimate the actual [H2O] and attenuation (ATTH2O) used to scale the water peak from the non-water suppressed spectrum. While these assumptions generally hold true in healthy controls and diseases in which water-related tissue constants are unchanged, they may not be accurate in diseases involving tissue composition changes. A novel approach is to acquire T1 and T2 maps of water from each participant to directly calculate the voxel [H2O] and ATTH2O scaling factors, which we have termed the total water content (TWC) approach. While this model requires fewer initial assumptions, additional scan time is required. The objective of our study was to investigate the feasibility of calculating absolute metabolite concentrations using the TWC approach ([met]TWC) compared to those obtained from the standard segmentation-based approach ([met]SEG).Methods
Subjects and experiments: 6 healthy volunteers (4 female/2 male, median age (range) = 24(22-26)yrs) were scanned on a 3T Philips Achieva system (Best, The Netherlands) with an 8 channel SENSE head coil. Data collection included (1) 3D-T1 MPRAGE (1mm isotropic resolution (FOV(ap/fh/rl)=256/256/165mm, TE/TR/TI/shot interval=3.5/8/950/3000ms, 6min); (2) PRESS2 (2 voxels (left white matter (WM), parietal grey matter (GM), see Figure 1), TE/TR=31/4000ms, 16 non-water suppressed acquisitions, 64 acquisitions with CHESS water suppression, 7min per SVS); (3) modified 48 echo GRASE (first echo/spacing=8ms, TR=1073ms, FOV=230/100/190mm, resolution=1/1/2.5 mm, 8min); (4) 3D inversion recovery T1 series (TIs = 150/400/750/1200/2100ms, TE/TR/shot interval=5/8/3000ms, 6min).
Post-processing: Figure 2 summarizes TWC and SEG approaches for [met] determination. All post-processing was conducted in Matlab (R2017b).
[met]TWC: T1 and T2 maps were used to calculate ATTH2O and [H2O] for each pixel, as described previously3,4 and with a T1,CSF=4.1s5. [H2O] and ATTH2O were then averaged over each MRS voxel.
[met]SEG: The 3DT1 was segmented with FSL’s BET and FAST6 and the partial volume fractions of WM, GM and CSF (fWM, fGM, fCSF) were applied to compute the scaling factors with tissue specific constants5,7-9 (Figure 3) according to:
$$[H_{2}O]=55556\text{mM}\cdot\sum_{i\in[WM,GM,CSF]}[H_{2}O]_i\cdot f_{i}$$
and
$$ATTH_{2}O=\sum_{i\in[WM,GM,CSF]}e^{-\frac{TE}{T_{2,i}}}\cdot(1-e^{-\frac{TR}{T_{1,i}}})$$
Raw spectra were phase corrected (zero & first order), eddy current corrected and frequency aligned with in-house software, before fitting with LCModel10. All spectra were visually inspected for quality.
Statistics: Due to the smaller sample size, Wilcoxon rank-sum tests were used to investigate differences in [H2O], ATTH2O, and between [met]TWC and [met]SEG. Uncorrected p-values are reported.
Results
Spectra had excellent linewidths (median full width half max (FWHM)WM(range) =4.9(4.0-5.9) Hz, FWHMGM= 4.3(3.4-5.9) Hz and signal to noise (SNR) (SNRWM=45(39-48), SNRGM=41(36-43)) allowing the reliable fit of N-acetylaspartate (NAA), total creatine (tCr), glutamate (Glu), total choline containing compounds (tCho) and myo-Inositol (Ins) (Figure 1C/D).
Relative to [H2O]SEG, [H2O]TWC was significantly decreased in both WM (-6.5%,p=0.002) and GM (-11.7%,p=0.008). Relative to ATTH2OSEG, ATTH2OTWC was decreased in WM (-1.8%,p=0.002), but increased in GM (+3.9%,p=0.008) (Figure 4). The scaling factors effects had a significant impact on the absolute metabolite concentrations for WM (tCr: -6.4%,p=0.002; Ins: -7.5%,p=0.004) and GM (NAA: -8.8%,p=0.008, tCr: -9.7%,p=0.008; Glu: -8.4%,p=0.03) (Figure 5).
Discussion
The TWC method was acquired within a reasonable timeframe (14mins), making it a feasible alternative to the segmentation-based approach (7mins). Despite the longer scan time requirement, in comparison to other alternatives e.g. external phantom, the TWC method does not require extra equipment or a special set-up. While a faster TWC mapping protocol exists11, it is based on T2* weighted imaging which is confounded by a signal dependence on the orientation of WM fibre bundles with respect to the B0 field12, and does not allow measurement of voxel specific ATTH2O.
The different impact of the scaling factors on WM and GM can, in part, be explained by differences in CSF partial volume fraction (mean fCSF,WM=2.0%, fCSF,GM=17.5%). Since a T1,CSF=4.1s for both methods is assumed, this may impact the initial scaling of the measured proton density in brain tissue in comparison to CSF, which is assumed to be 99% water. Future work finding an objective measure for T1,CSF that can sample longer inversion times while minimising flow artefacts is required.
Conclusion
The TWC method for calculating absolute metabolite concentrations in MRS showed promising results, offering a potential alternative for the currently widely used SEG approach.Acknowledgements
We sincerely thank all volunteers, and the UBC MRI Research Centre technologists and administrators. Carina Graf is the recipient of an endMS Master’s Studentship award from the Multiple Sclerosis Society of Canada. Erin L MacMillan receives salary support from Philips Healthcare, Canada. Cornelia Laule holds operating grants from the Multiple Sclerosis Society of Canada and an NSERC Program Discovery Grant.
References
- Kreis R. Quantitative localized 1H MR spectroscopy for clinical use. Prog. Nucl. Magn. Reson. Spectrosc. 1997;31(2):155–195.
- Bottomley P. Selective volume method for performing localized NMR spectroscopy. United States Pat. Trademark Off. 1985;3(1):iv–v.
- Meyers SM, Kolind SH, Laule C, et al. Measuring water content using T2 relaxation at 3T: Phantom validations and simulations. Magn. Reson. Imaging 2016;34(3):246–251.
- Meyers SM, Kolind SH, MacKay AL. Simultaneous measurement of total water content and myelin water fraction in brain at 3T using a T2 relaxation based method. Magn. Reson. Imaging 2017;37:187–194.
- Lin C, Bernstein M, Huston J, et al. Measurements of T1 Relaxation times at 3.0T: Implications for clinical MRA. In: Proceedings of the 9th Annual Meeting of ISMRM, Glasgow Scotland. Glasgow; 2001. p. 1391.
- Jenkinson M, Beckmann CF, Behrens TEJJ, et al. FSL. Neuroimage 2012;62(2):782–790.
- Vavasour IM, Laule C, Kolind SH, et al. Hydration status does not affect brain water content or myelin water fraction in healthy volunteers. In: 19th Annual International Society for Magnetic Resonance in Medicine Annual Meeting & Exhibition. Vol. 17. Honolulu; 2009. p. 3217.
- Liang ALW, Vavasour IM, Mädler B, et al. Short-term stability of T1 and T2 relaxation measures in multiple sclerosis normal appearing white matter. J. Neurol. 2012;259(6):1151–1158.
- Laule C, Vavasour IM, Kolind SH, et al. Long T2 water in multiple sclerosis: what else can we learn from multi-echo T2 relaxation? J. Neurol. 2007;254(11):1579–1587.
- Provencher SW. Estimation of metabolite concentrations from localized in vivo proton NMR spectra. Magn. Reson. Med. 1993;30(6):672–679.
- Oeltzschner G, Schnitzler A, Wickrath F, et al. Use of quantitative brain water imaging as concentration reference for J-edited MR spectroscopy of GABA. Magn. Reson. Imaging 2016;34(8):1057–1063.
- Hernández-Torres E, Kassner N, Forkert ND, et al. Anisotropic cerebral vascular architecture causes orientation dependency in cerebral blood flow and volume measured with dynamic susceptibility contrast magnetic resonance imaging. J. Cereb. Blood Flow Metab. 2017;37(3):1108–1119.
Figures
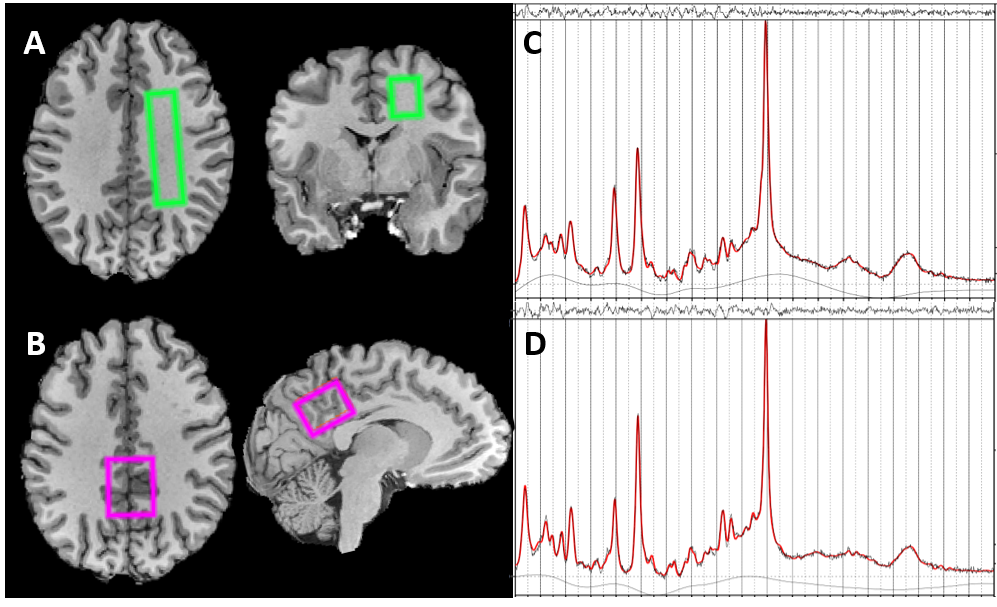
Figure 1: Sample voxel placements (A,B) and LCModel fits of spectra (C,D)
Representative voxel placements (A,B) and resulting spectra from one volunteer for white (WM) and grey matter (GM). Voxel dimensions (WM: ap/rl/fh=65/15/20mm3≈20 mL, GM: ap/rl/fh=30/25/21.5mm3=16mL) and locations (left WM, posterior GM) were chosen to subjectively maximise WM and GM tissue fraction. High quality spectra (C,D) acquired with PRESS2, TE/TR/NSA=31/4000/64 were fit in LCModel10 (version 6.3-1H) from 0.2-4ppm with water-scaling allowing the quantification of the five major metabolites NAA, tCr, Glu, tCho and Ins with CRLB<6%.
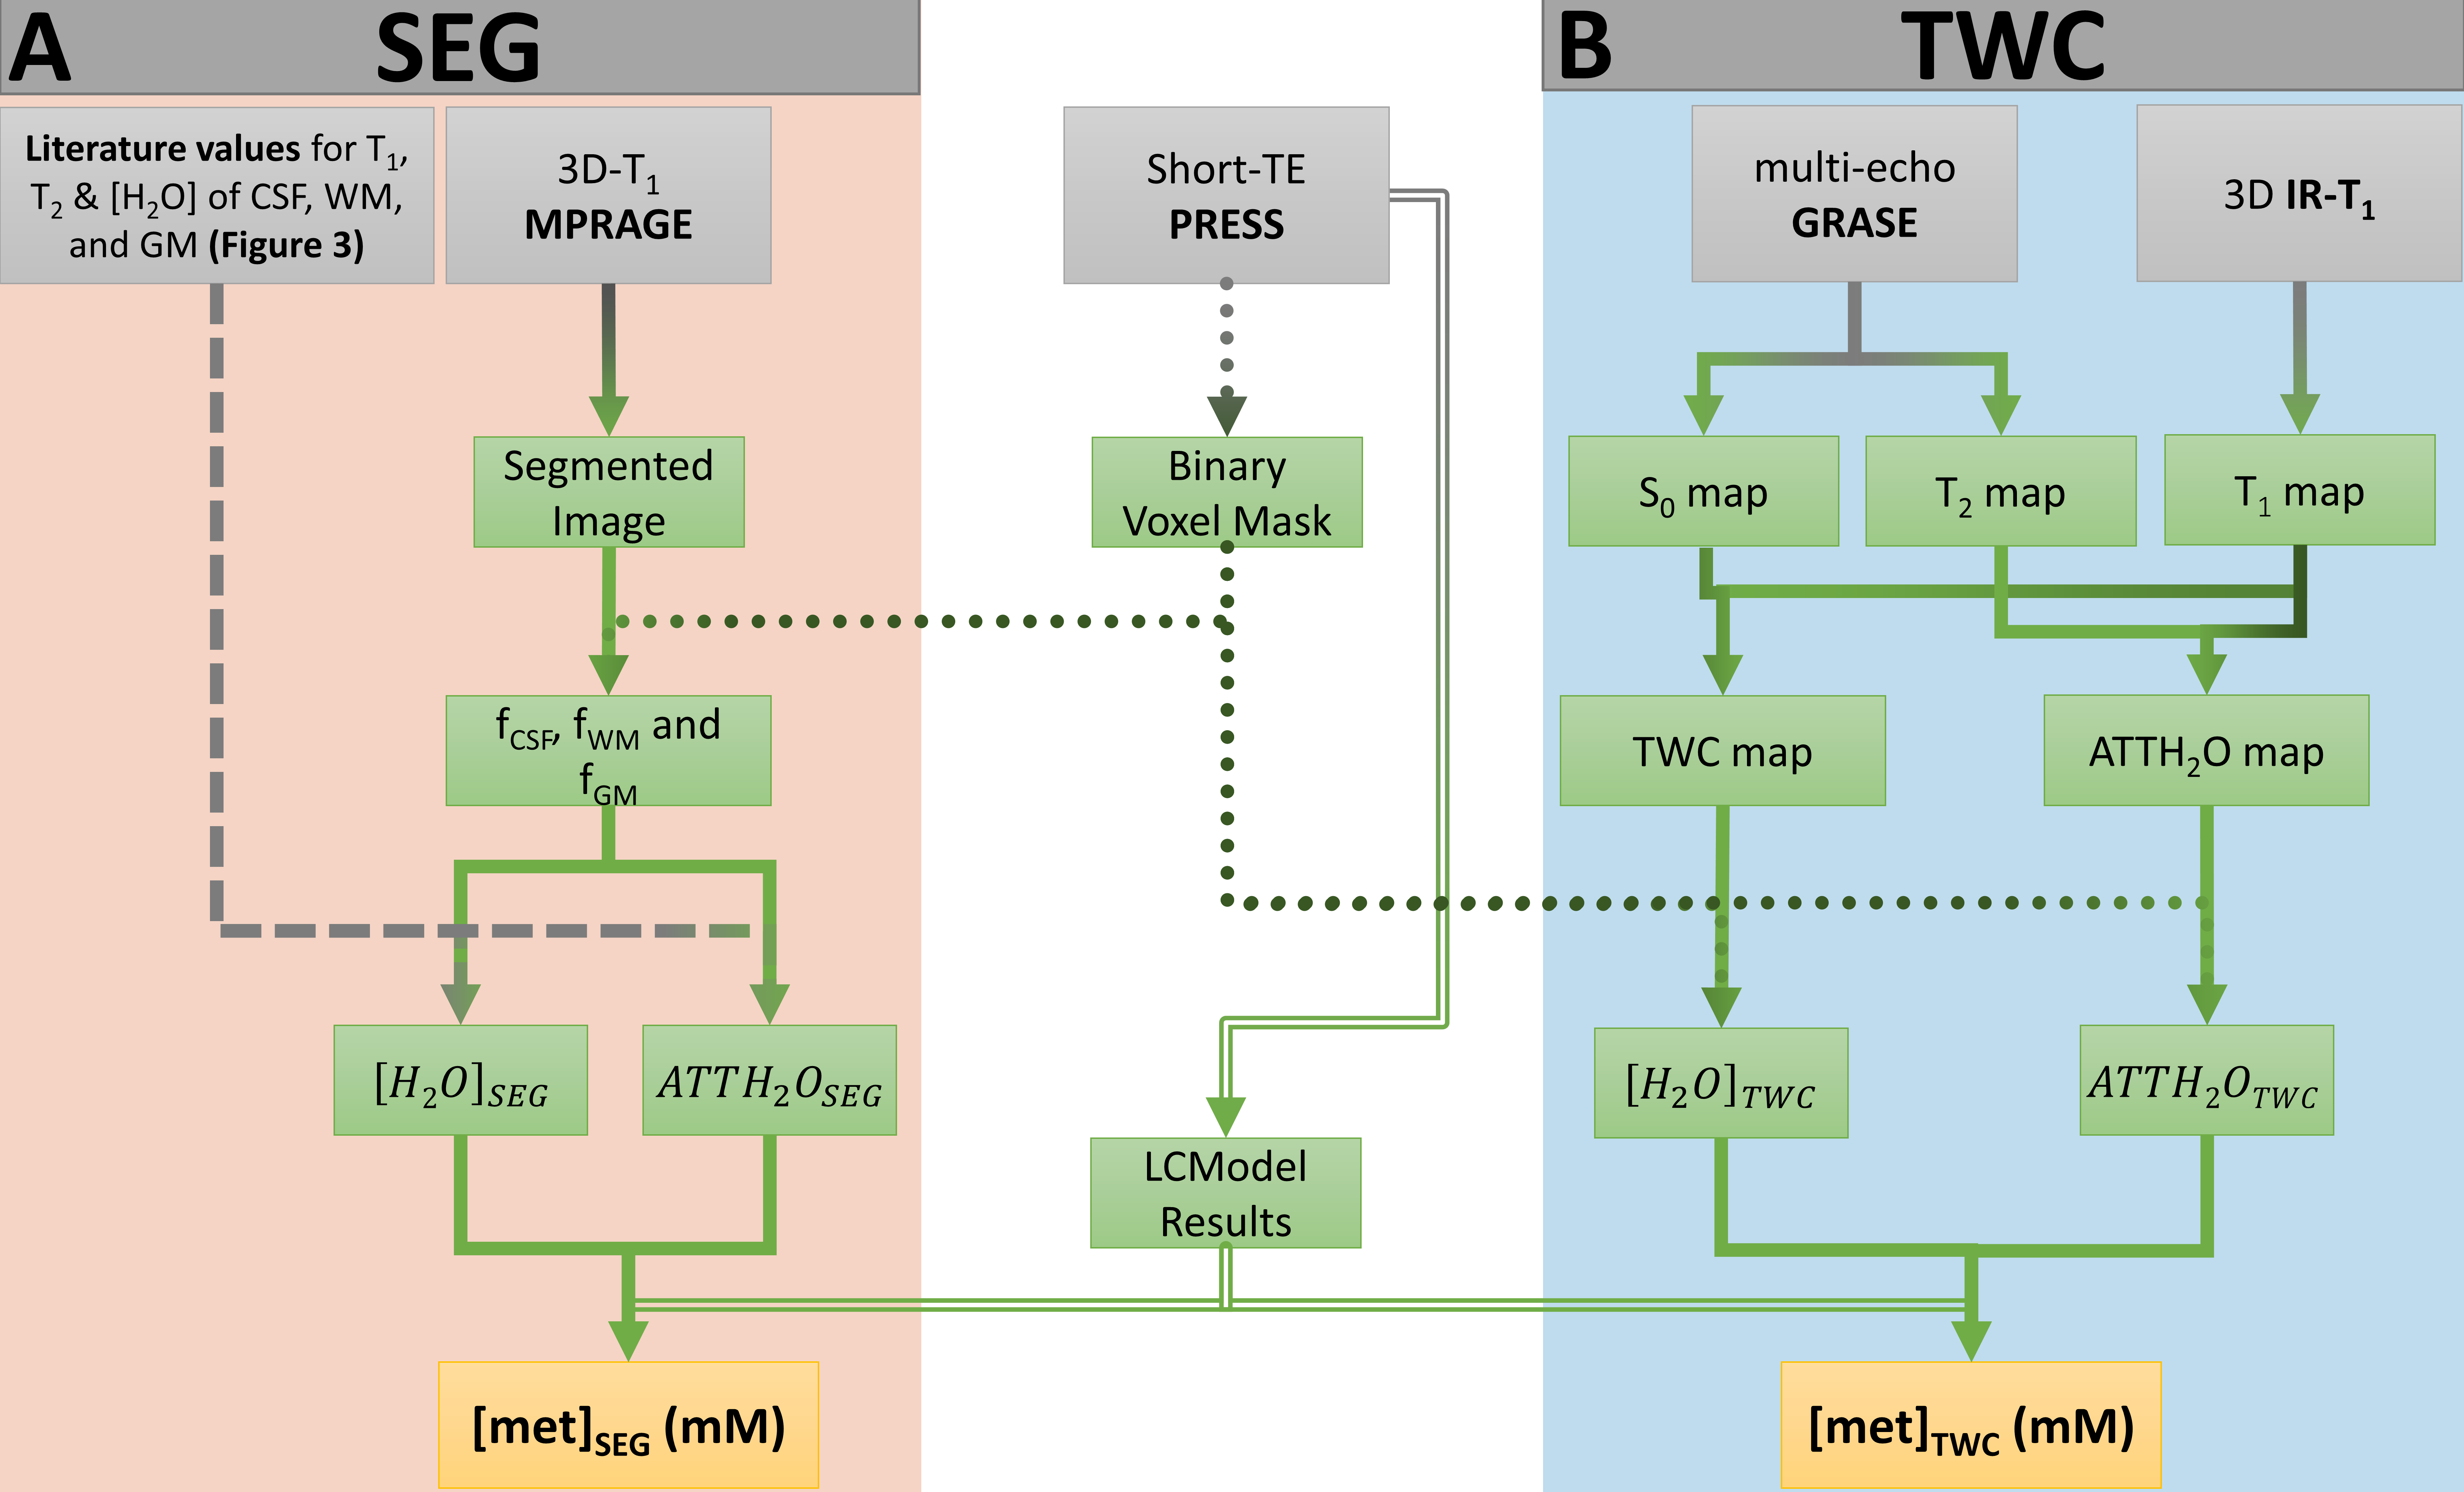
Figure 2: Comparison of analysis methods.
(A) The segmentation based (SEG) approach solely requires the acquisition of a high resolution and high contrast image to allow for segmentation. The partial volume fractions (fCSF, fWM and fGM) are used in combination with literature values of tissue specific T1, T2 and [H2O] (Figure 3) to calculate the absolute metabolite concentrations [met]SEG.
(B) The total water content (TWC) method uses a signal intensity (S0) map extracted from a multi-exponential T2 decay curve as described previously4, and the water T1 and a T2 maps to calculate the mean [H2O] and ATTH2O.
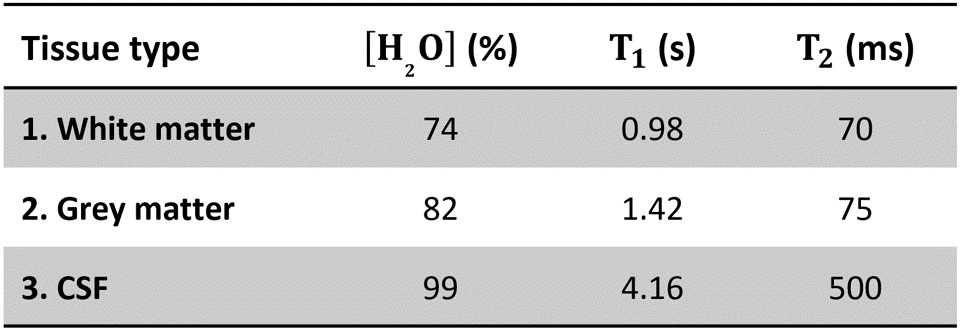
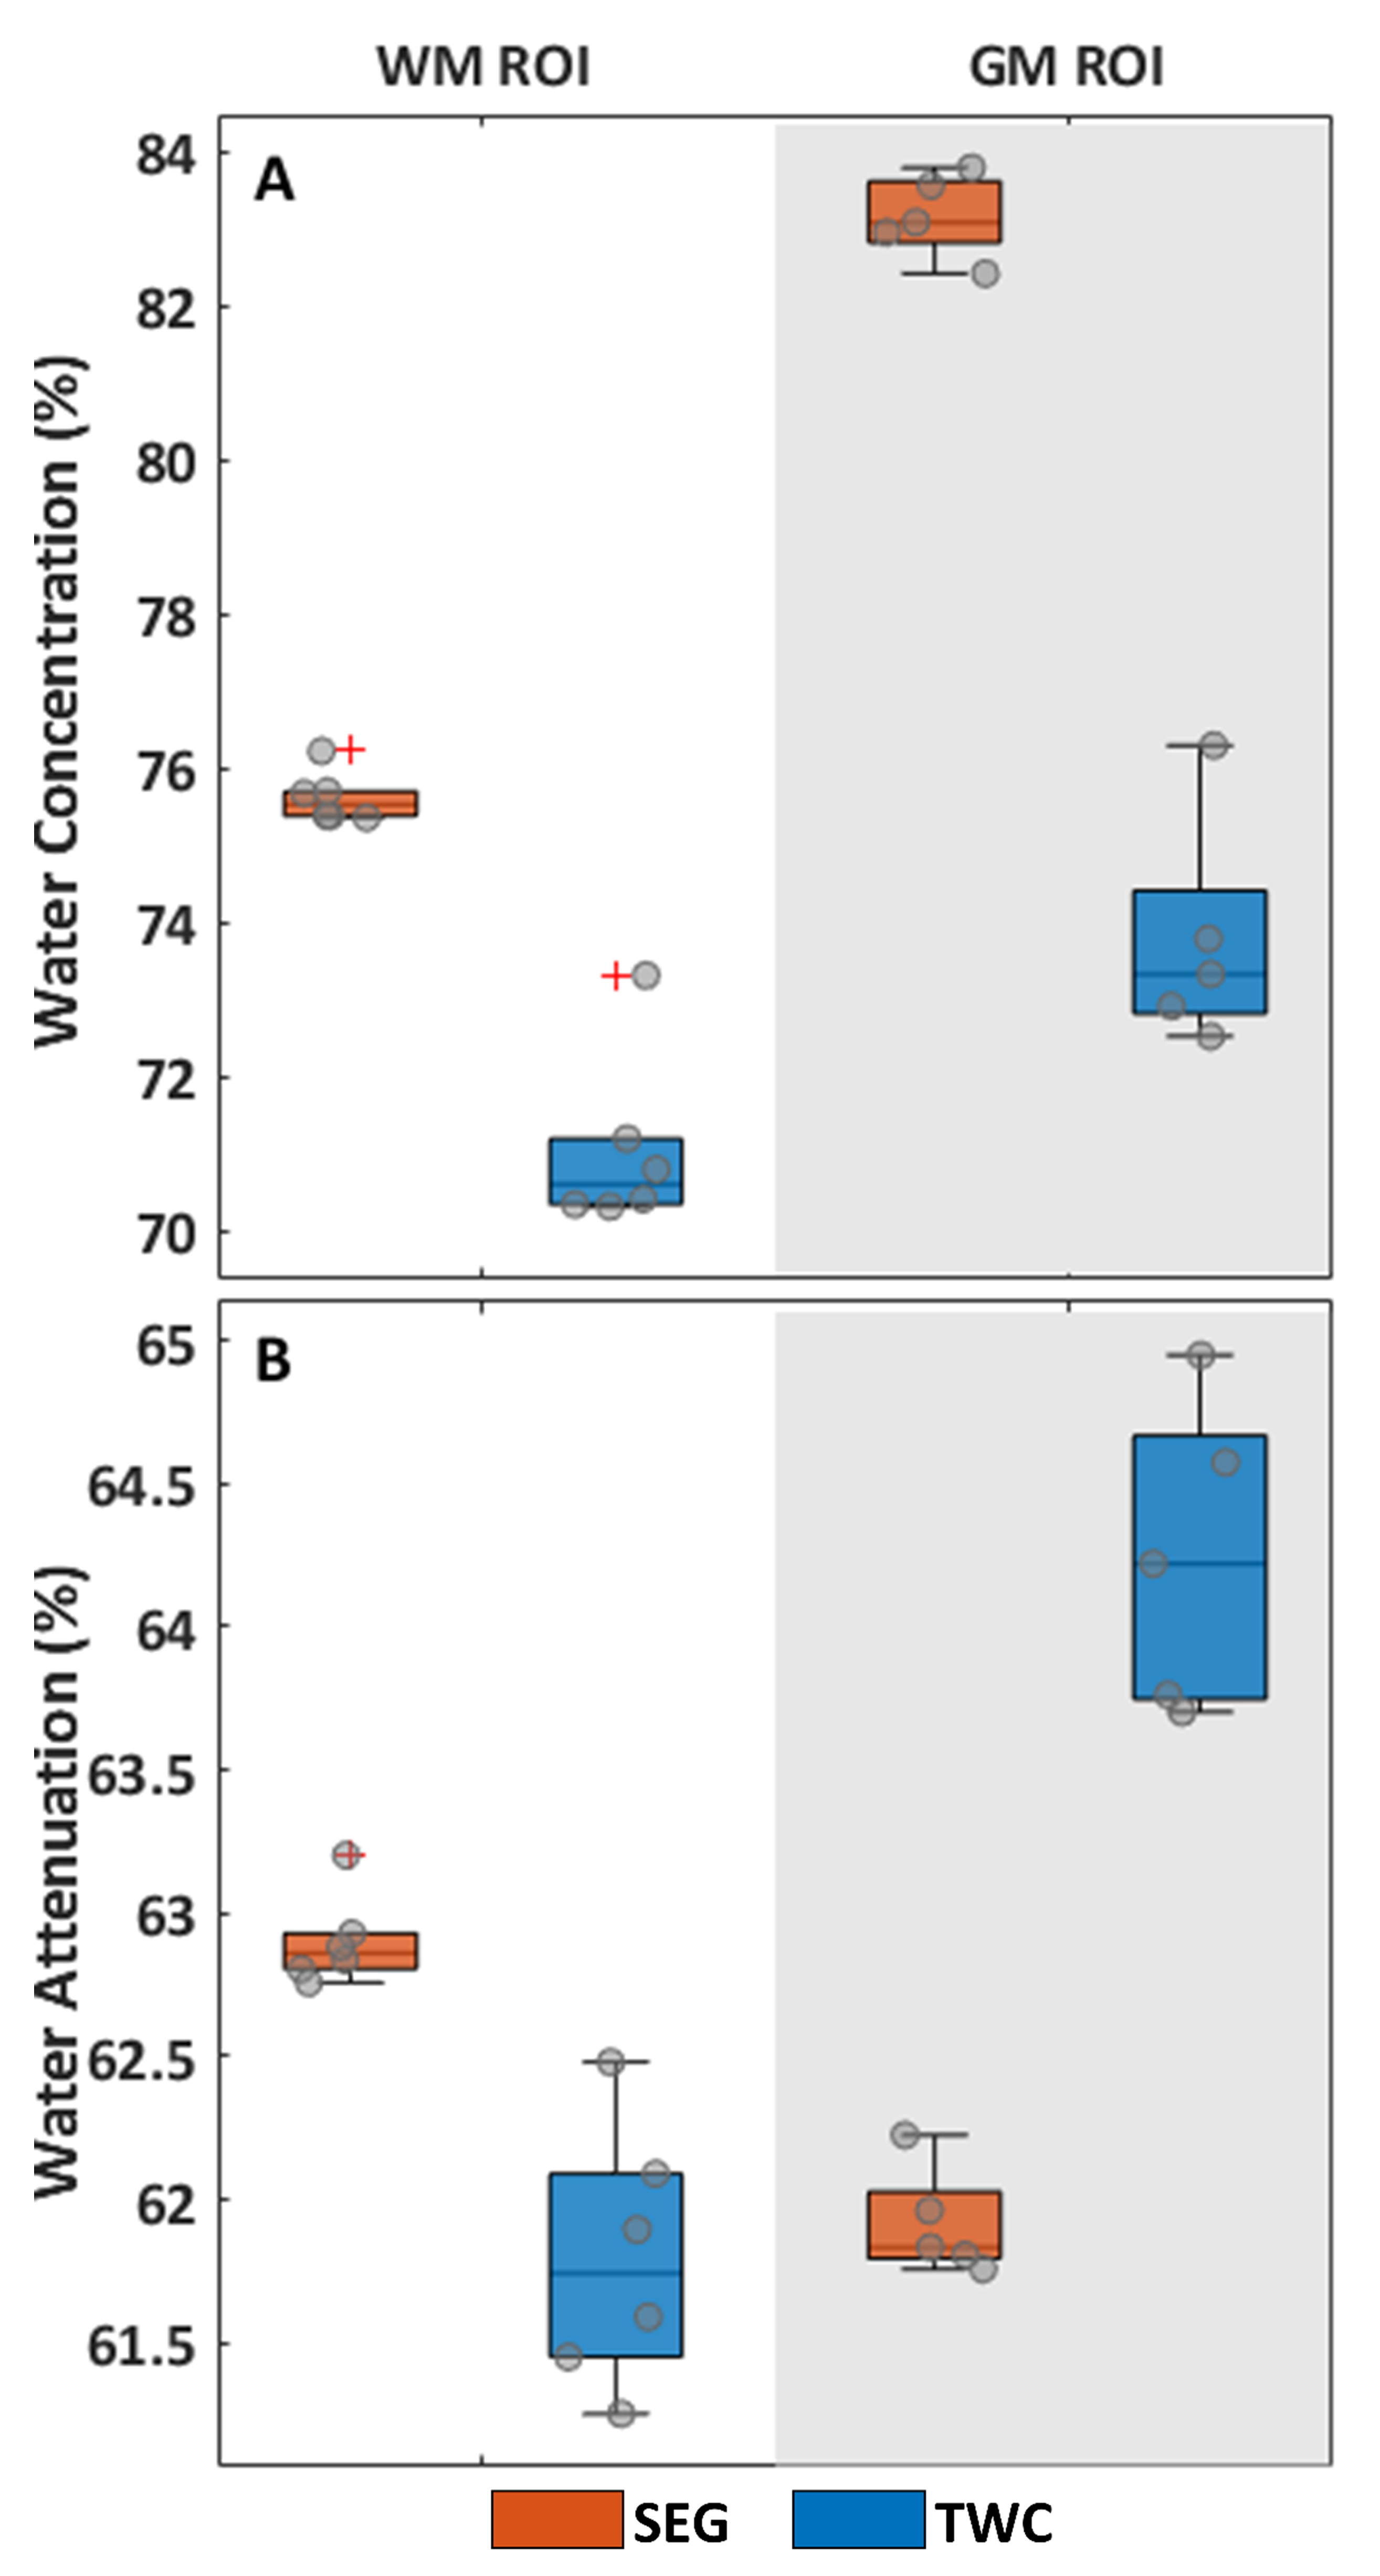
Figure 4: Scaling factors for [met], derived with both the segmentation based (SEG) and total water content method (TWC) methods
(A) Boxplots of water concentration, [H2O], calculated for each participant in the white matter and grey matter ROI. [H2O]TWC was lower by -6.5% in comparison to [H2O]SEG (p=0.002) in the white matter ROI and -11.7% in GM ROI (p=0.008).
(B) Boxplots of mean water attenuation (ATTH2O), showing significantly lower ATTH2O with the TWC method in the WM ROI (-1.8%, p=0.002), while exhibiting higher ATTH2O in the GM ROI (+3.9%, p=0.008).
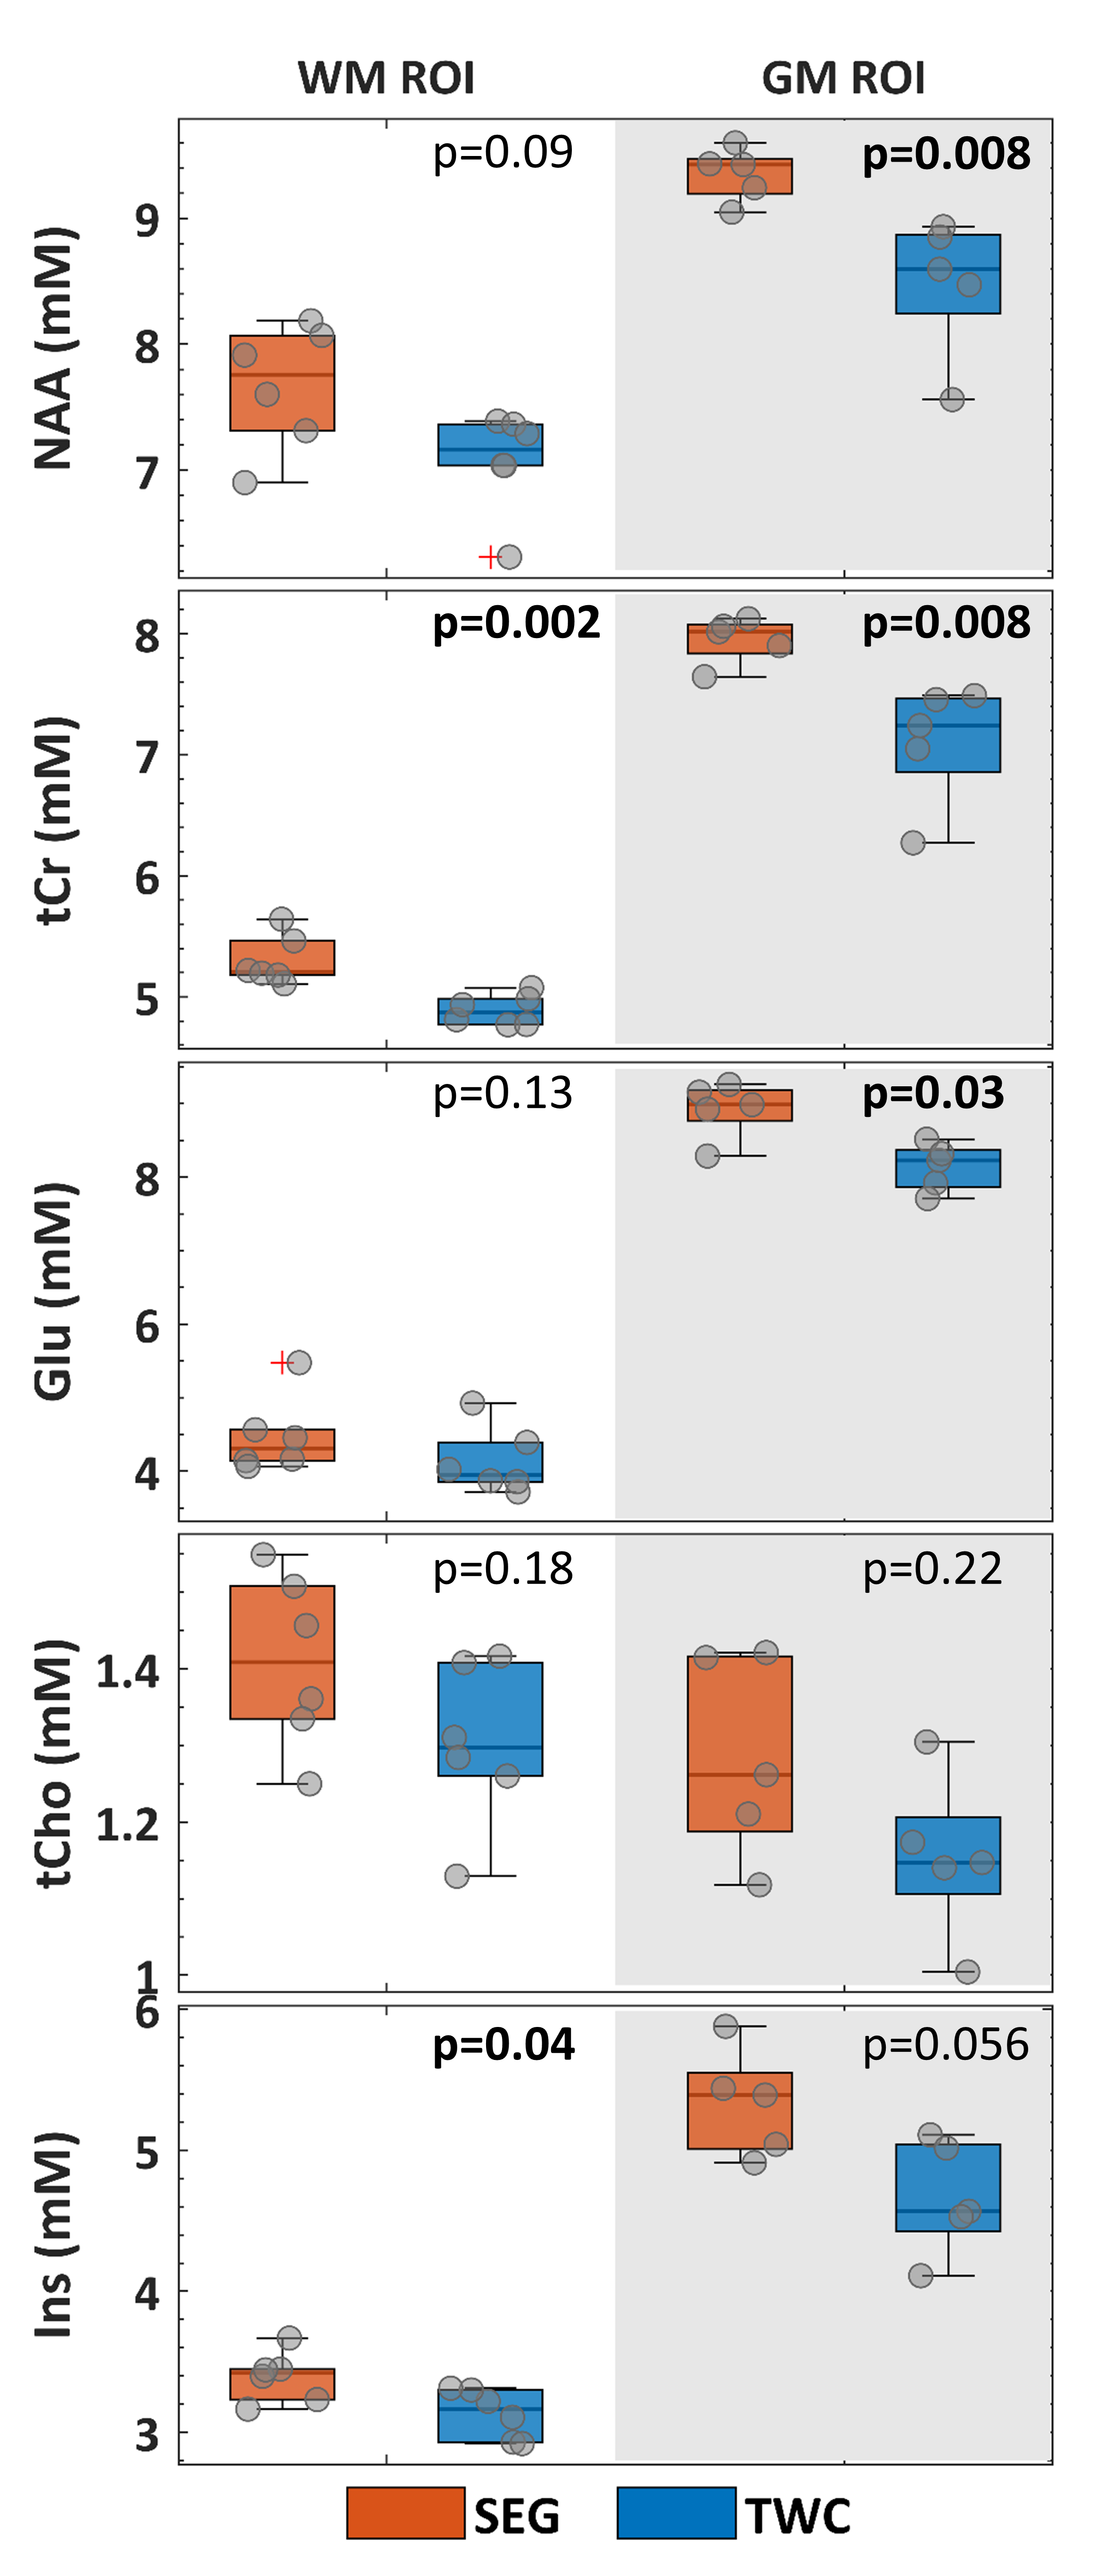
Figure 5: Absolute metabolite concentrations [met], calculated with both analysis approaches.
[met]TWC were significantly lower in the WM ROI (left column) in comparison to [met]SEG for tCr (-6.4%, p=0.002) and Ins (-7.5%, p=0.04), whereas in the GM ROI (right column) NAA (-8.8%, p=0.008), tCr (-9.7%, p=0.008) and Glu (-8.4%, p=0.03) were significantly lower, with an appreciable trend for Ins (-15.3%, p=0.056).