4097
Comparison of the Capability for Distinguishing Malignant from Benign Pulmonary Nodules among DWI with FASE Sequence at a 3T System, DWIs with EPI Sequence at 1.5T and 3T Systems and FDG-PET/CT1Division of Functional and Diagnostic Imaging Research, Department of Radiology, Kobe University Graduate School of Medicine, Kobe, Japan, 2Advanced Biomedical Imaging Research Center, Kobe University Graduate School of Medicine, Kobe, Japan, 3Canon Medical Systems Corporation, Otawara, Japan, 4Center for Radiology and Radiation Oncology, Kobe University Hospital, Kobe, Japan, 5Division of Radiology, Department of Radiology, Kobe University Graduate School of Medicine, Kobe, Japan
Synopsis
No one have been compared the capability between DWI obtained by EPI and FASE at 3T or 1.5T systems and PET/CT in this setting. We hypothesized that DWI obtained by FASE sequence at 3T system are more useful than that by EPI sequence at 1.5T and 3T systems and PET/CT for diagnosis of SPN. The purpose of this study was to directly and prospectively compare the quantitative capability for diagnosis of SPN among DWI with FASE and EPI sequences at 3T system, DWI with EPI sequence at 1.5T system and FDG-PET/CT.
Introduction
Pulmonary nodules are caused by a variety of conditions, ranging from benign granulomas to operable primary malignant lung nodules. Ideally, the goal of diagnosis and management is to promptly bring to surgery all patients with operable malignant nodules while avoiding unnecessary thoracotomy for patients with benign lesions. Therefore, it is important to differentiate malignant from benign solitary pulmonary nodules (SPNs) in the least invasive manner and to make as specific and accurate diagnoses as possible. In the last decade, diagnostic capability of CT, PET or PET/CT and diffusion-weighted MR imaging (DWI) have been suggested as useful in this setting (1, 2). DWI has been obtained by Echo Planar Imaging (EPI) sequence at 1.5T and 3T MR systems and can also be obtained by fast advanced spin-echo (FASE) for improving image distortion at 3T system (3). No one have been compared the capability between DWI obtained by EPI and FASE at 3T or 1.5T systems and PET/CT in this setting.
We hypothesized that DWI obtained by FASE sequence at 3T system are more useful than that by EPI sequence at 1.5T and 3T systems and PET/CT for diagnosis of SPN. The purpose of this study was to directly and prospectively compare the quantitative capability for diagnosis of SPN among DWI with FASE and EPI sequences at 3T system, DWI with EPI sequence at 1.5T system and FDG-PET/CT.
Materials and Methods
97 consecutive patients (62 men, 35 women; mean age 70 years) with 130 pulmonary nodules prospectively underwent DWIs with FASE and EPI sequences at a 3T MR system, that with EPI sequence at a 1.5T system FDG-PET/CT, pathological examinations from specimens obtained by transbronchial or CT-guided biopsies or surgical resection, treatment and/ or more than 2 years follow-up examinations. According to the pathological examination results, all nodules were divided into following two groups: malignant nodules (n=87) and benign pulmonary nodules (n=43). All 3T MR imaging were performed on a 3T MR system (Vantage Titan 3T, Canon Medical Systems) and 1.5T MR imaging were obtained on two 1.5T systems (Achieva 1.5T, Philips Healthcare). All PET/CT examinations were performed by using standard technique on a PET/CT scanner (Discovery 600M, GE Healthcare, Waukesha, Wisc). In each lesion, apparent diffusion coefficients (ADCs) from all DWIs (ADC3TFASE, ADC3TEPI and ADC1.5TEPI) and SUVmax were assessed by ROI measurements.
To compare all indexes between two groups, Student’s t-test was performed. Then, ROC analyses were performed to compare diagnostic performance among all indexes. Finally, sensitivity, specificity and accuracy were compared among all methods by McNemar’s.
Results
Representative case is shown in Figure 1. There were significant differences of all indexes between two SPN groups (p<0.0001). ROC analyses showed area under the curve (Az) of ADC3TFASE (Az=0.90) was significantly larger than that of others (ADC1.5TEPI: Az=0.85, p=0.02; ADC3TEPI: Az=0.83, p=0.01; SUVmax (Az=0.76, p=0.0003). Accuracy (AC) of ADC3TFASE (90.7 [117/129] %) was significantly higher than that of others (ADC1.5TEPI: 84.4 [109/129] %, p=0.008; ADC3TEPI: 82.9 [107/129] %, p=0.002; SUVmax 75.2 [97/129] %, p<0.0001). In addition, accuracy of each ADC with EPI was significantly higher than that of SUVmax (ADC1.5TEPI: p=0.008, ADC3TEPI: p=0.002). Specificity of ADC3TFASE (90.5 [38/42] %) was also significantly higher than that of ADC1.5TEPI (76.2 [32/42] %, p=0.03) and ADC3TEPI (71.4 [30/42] %, p=0.008). Moreover, sensitivity of ADC3TFASE (90.8 [79/87] %) was significantly higher than that of SUVmax (SE: 73.6 [64/87] %, p<0.0001).Conclusion
DWIs with FASE sequence has a better potential for quantitative diagnosis of SPNs than DWI with EPI sequence at 1.5T and 3T systems and FDG-PET/CT. FASE sequence would be better to be applied for DWI at 3T system to improve diagnostic performance of SPNs.Acknowledgements
No acknowledgement found.References
1. Uto T, Takehara Y, Nakamura Y, et al. Radiology. 2009; 252(1): 247-254.
2. Coolen J, Vansteenkiste J, De Keyzer F, et al. Eur Radiol. 2014; 24(2): 531-541.
3. Ohno Y, Koyama H, Yoshikawa T, et al. Eur J Radiol. 2015; 84(11): 2321-2331.
Figures
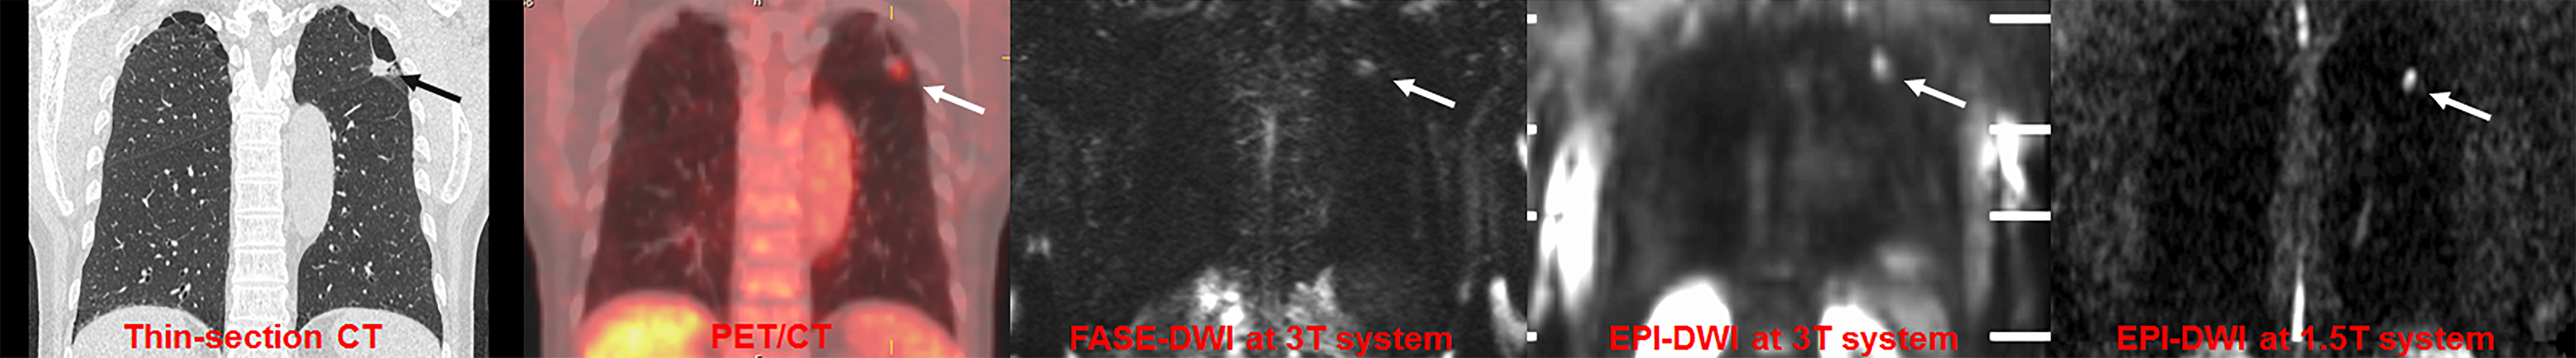
Figure 1. 67-year-old male with invasive adenocarcinoma (First line from L to R: Thin-section MPR image, PET/CT, DWI by FASE sequence at 3T system, DWI by EPI sequence at 3T system and DWI by EPI sequence at 1.5T system).
Thin-section CT demonstrates a nodule with bubble like appearance in the left upper lobe. SUVmax of this nodule was 2.5. ADCs with FASE-DWI at 3T system and EPI-DWI at 1.5T and 3T systems were as follows: 1.12×10⁻³mm2/sec, 1.06×10⁻³mm2/sec and 1.03×10⁻³mm2/sec. This case was true-positive on PET/CT and each DWI.
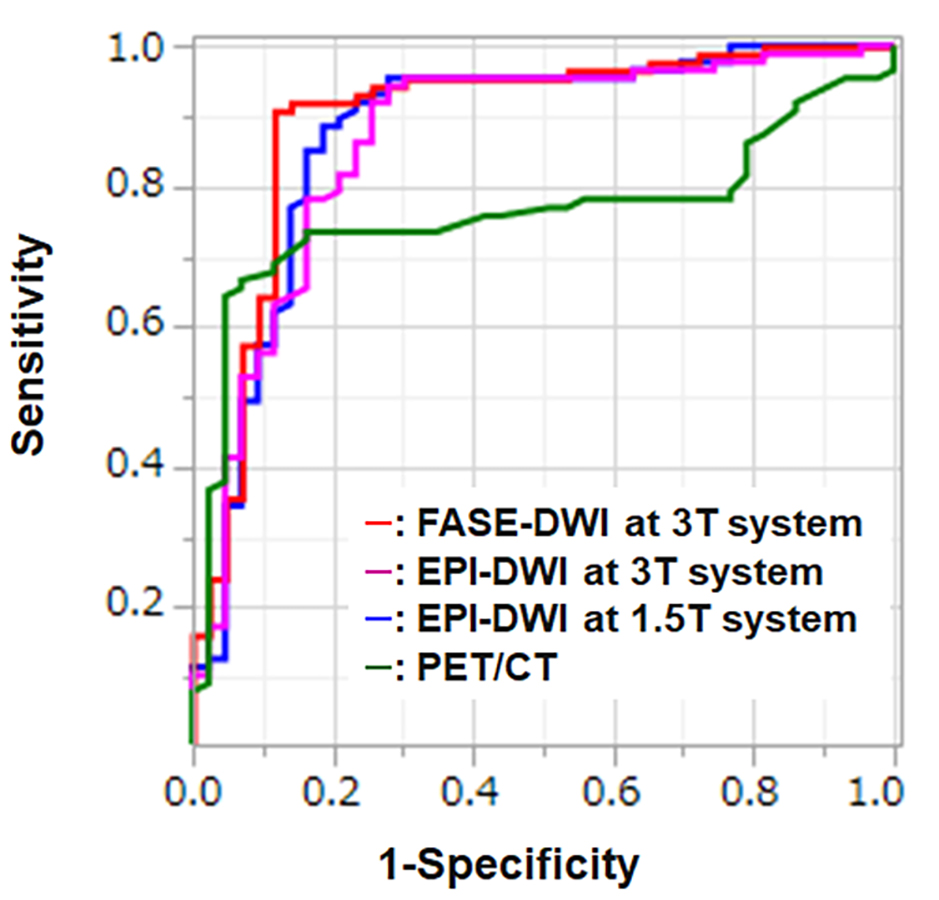
Figure 2. Results of ROC analysis among all indexes.
Area under the curve of FASE-DWI at 3T system (AUC=0.90) was significantly larger than that of EPI-DWI at 1.5T (AUC=0.88, p=0.04) and 3T (AUC=0.87, p=0.02) systems and PET/CT (AUC=0.76, p=0.01). AUC of EPI-DWI at 1.5T system was significantly larger than that of PET/CT (p=0.04).
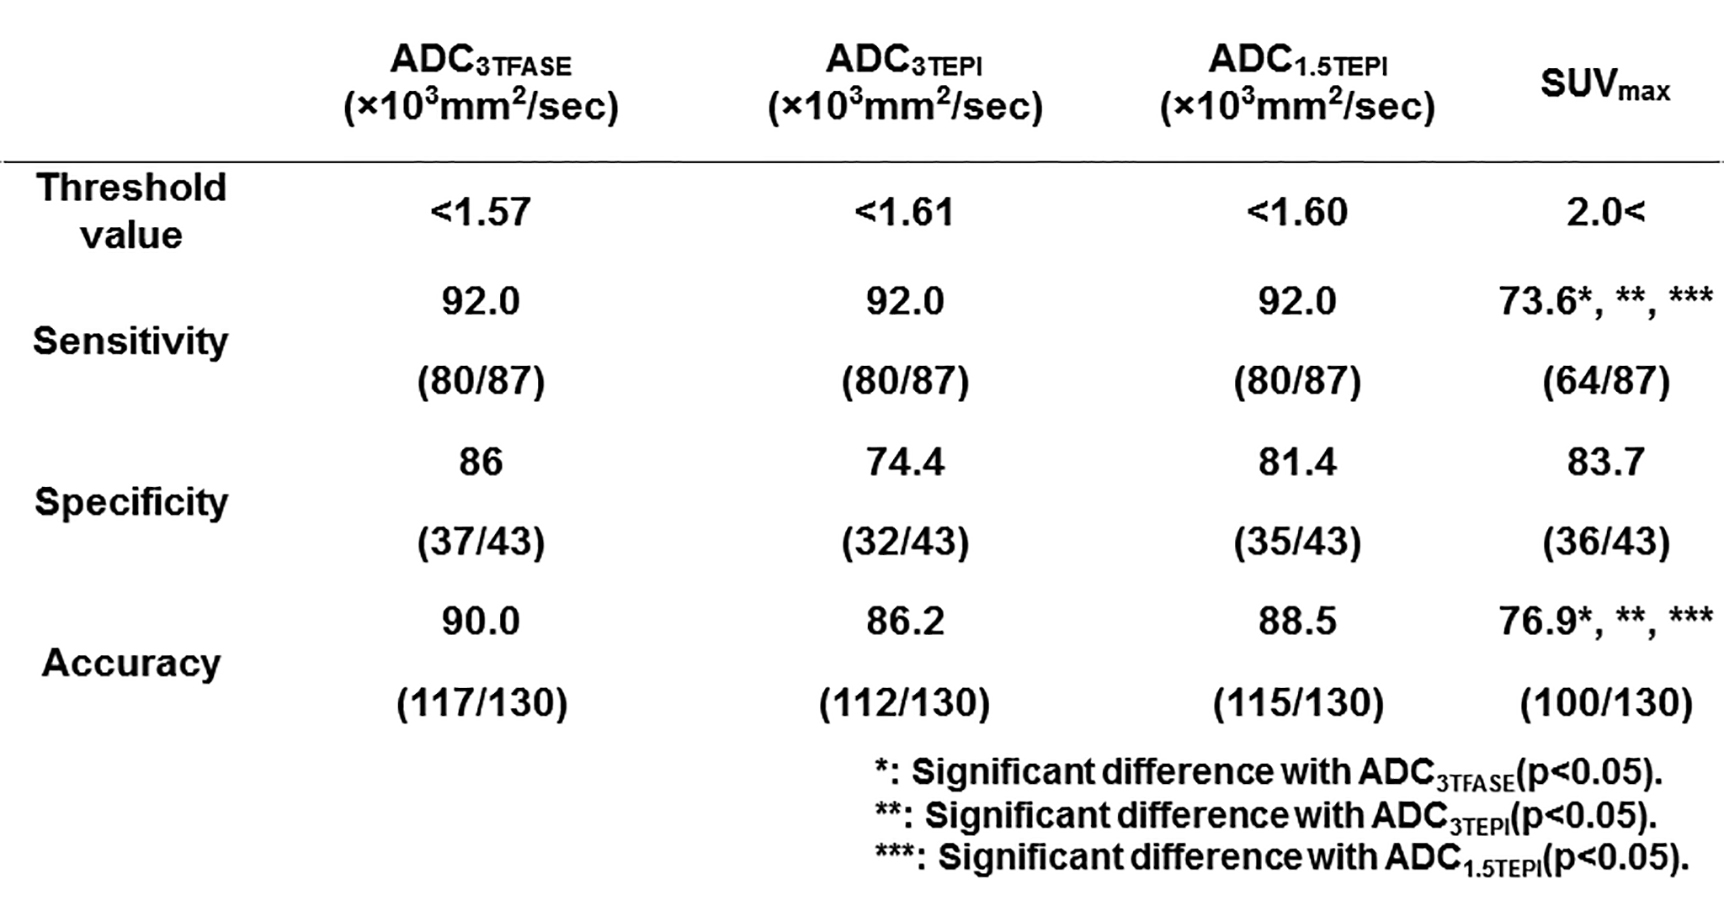
Figure 3. Comparison of diagnosic performance among all indexes.
When applied each feasible threshold value, accuracy of SUVmax was significantly lower than that of others (p<0.05).