3997
Pulsed Saturation Transfer in Glioblastoma at 1.5T1Physical Sciences, Sunnybrook Research Institute, Toronto, ON, Canada, 2Radiation Oncology, Sunnybrook Health Sciences Centre, Toronto, ON, Canada, 3Department of Radiation Oncology, University of Toronto, Toronto, ON, Canada, 4Medical Biophysics, University of Toronto, Toronto, ON, Canada, 5Department of Neurosurgery and Pediatric Neurosurgery, Medical University, Lublin, Poland
Synopsis
The purpose of this study was to quantify the effects of saturation transfer (CEST and MT) measurements in glioblastoma (GBM) patients at 1.5T. Data from GBM patients (n=10), treated with intensity modulated radiation therapy with a dose of 2 Gy per session with concurrent temozolomide, were analyzed before and after 10 treatment fractions. MT data were fitted to the Bloch-McConnell (BM) equations using a two-pool model with extended phase graphs (EPG) incorporated into the model. Results showed differences between normal and tumor regions and demonstrated promise for the application of CEST at 1.5T.
Introduction
Glioblastoma multiforme (GBM) is the most aggressive and the most common form of brain tumor, accompanied by dismal patient outcomes despite standard treatment, which involves surgical resection followed by radiation therapy and chemotherapy1. Recently, saturation transfer MRI techniques including quantitative magnetization transfer (MT)2-3 and amide proton transfer (APT) chemical exchange saturation transfer (CEST)4 have been used to image human GBM tumours5-7 and also used in monitoring the response to treatment8-12. Previous GBM CEST studies were conducted at field strengths of 3T or higher. However, the clinical relevance of saturation transfer techniques would benefit from the application of the methodology at lower field strength. The aim of this study was to quantify the CEST and MT parameters in GBM patients at 1.5T.Methods
GBM study:
The study was
approved by the institutional research ethics board and informed consent was
obtained from all patients. Data from 10 patients (treated with intensity
modulated radiation therapy with a dose of 2 Gy per session with concurrent
temozolomide) were analyzed before and after 10 treatment fractions.
MR protocol:
Data were acquired
on a 1.5T Philips Ingenia system. MT and CEST imaging used a pulsed saturation
scheme13-15 that consisted of short, block pulses designed to
overcome the RF amplifier limitations on this scanner (10ms pulses for MT and
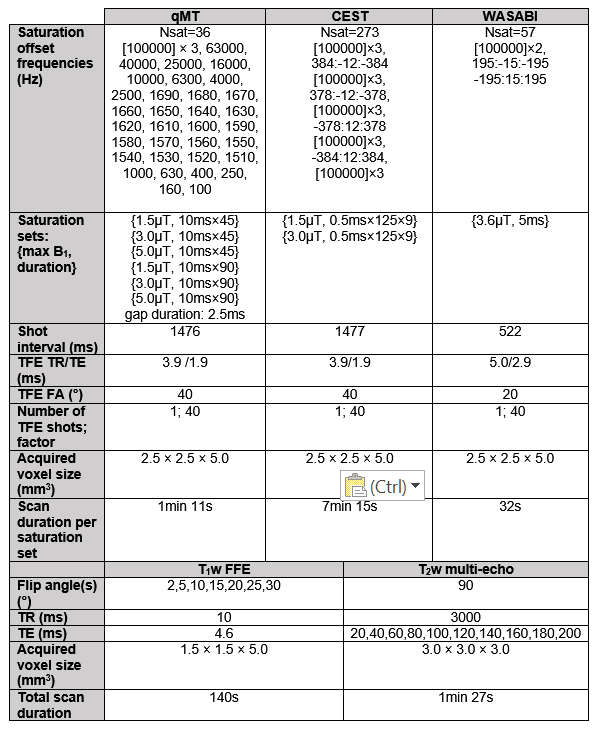
0.5ms pulses for CEST, both separated by short gaps in time). Figure 1 shows the
MR parameters used for the pulsed saturation and B0/B1/T1/T2
mapping sequences.
Image pre-processing:
The
Gd post-contrast T1 and T2 FLAIR volumes were first
registered to the pre-contrast T1 volume using the “flirt” function
from FSL (FSL, FMRIB, Oxford, UK; http://www.fmrib.ox.ac.uk/fsl). From each of
the 3D volumes (pre- and post-contrast T1, and T2 FLAIR),
2D slices were extracted that corresponded to the scanned CEST/MT slice. For
the CEST scans, motion correction was performed across the saturation
frequencies using the FSL “mcflirt” function. Contours were drawn of the tumor and
normal (i.e. white matter on the contralateral side or “cNAWM”, as in previous
work8) brain regions.
Parameter
quantification:
MT data were fitted
to the Bloch-McConnell (BM) equations using a two-pool model3 (i.e.,
liquid and semi-solid pools) with extended phase graphs (EPG)16-17 incorporated into the model18. The CEST
effect was quantified by computing the difference between the z-spectra and the
quantitative MT-extrapolated curve19. The CEST asymmetry was
quantified20 between 3 and 4ppm, after B0 correction and
after removing the MT contribution. Parameter values were compared between
normal and tumor regions. Results were quantified before and after 10 radiation
treatment fractions.
Results and Discussion
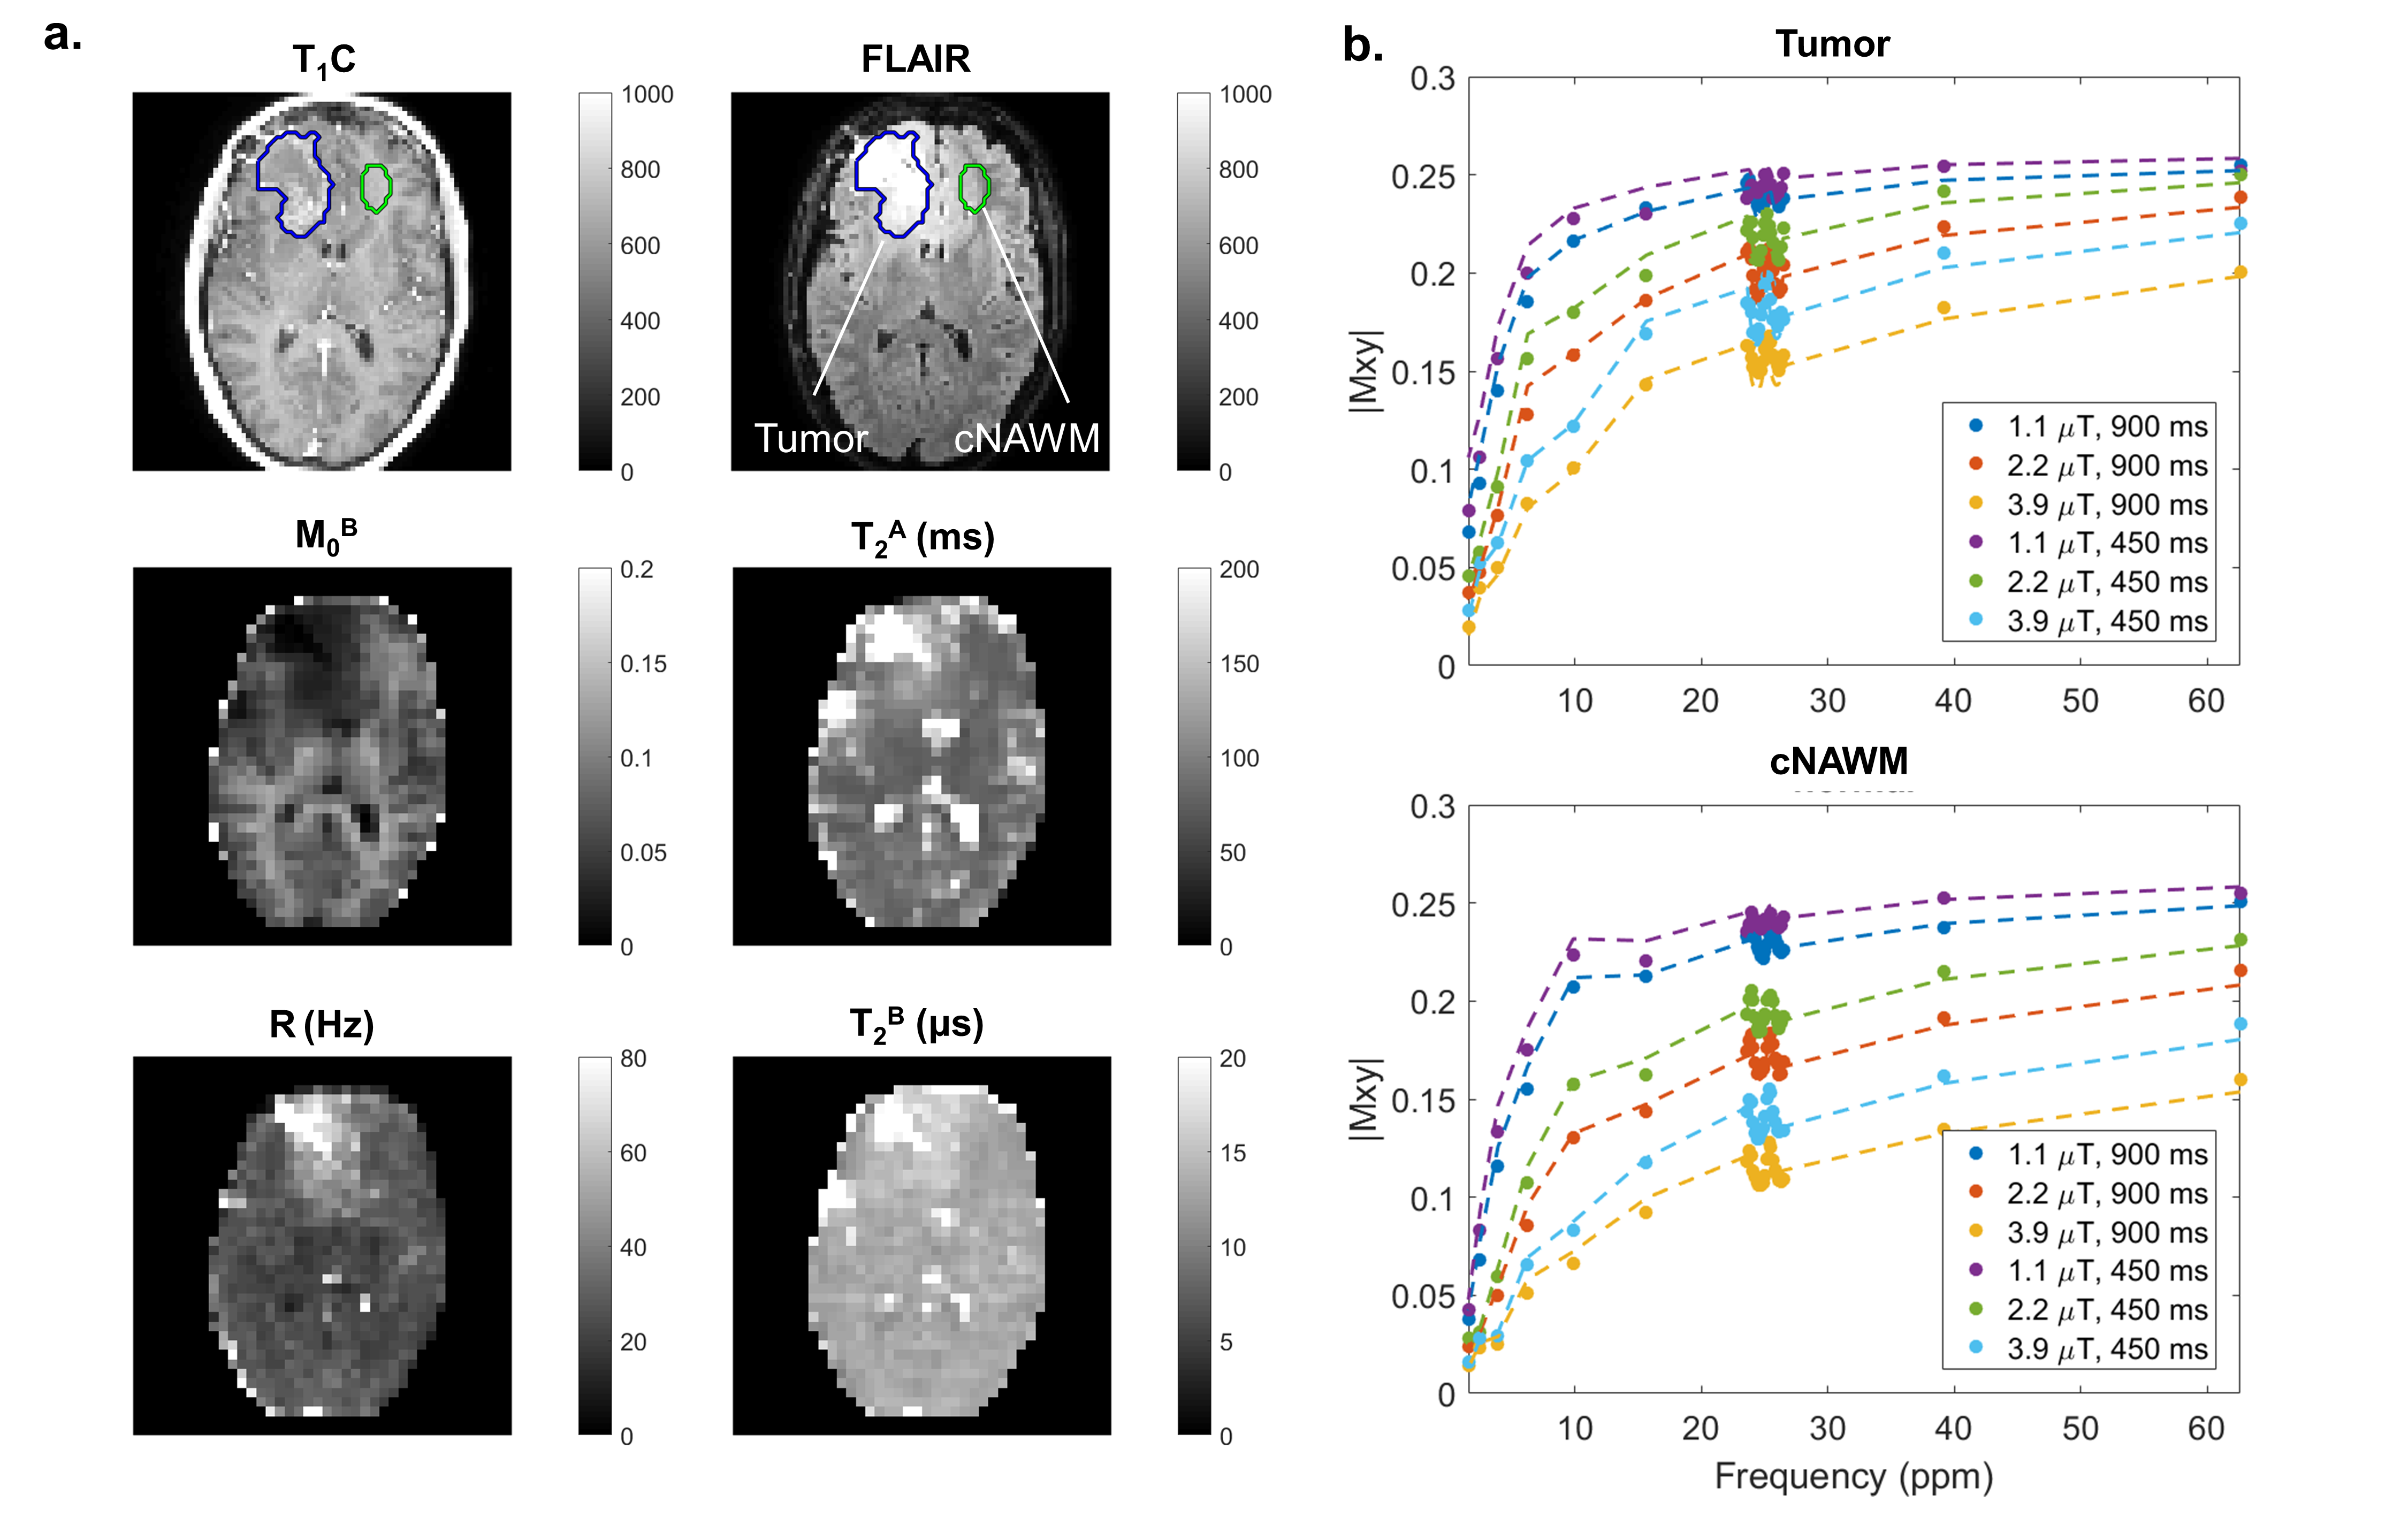
Figure 2 shows standard (post-contrast T1-weighted and T2 FLAIR) scans and fitted MT parameter maps for an example case, before radiation treatment. In the tumor region, there is a decrease in the relative semisolid fraction, M0B, and an increase in the exchange rate between the two pools, R, compared to the cNAWM regions. There is an absence of gray and white brain structure in the M0B map at the location of the lesion. The model is well-fitted to the data points in both regions.
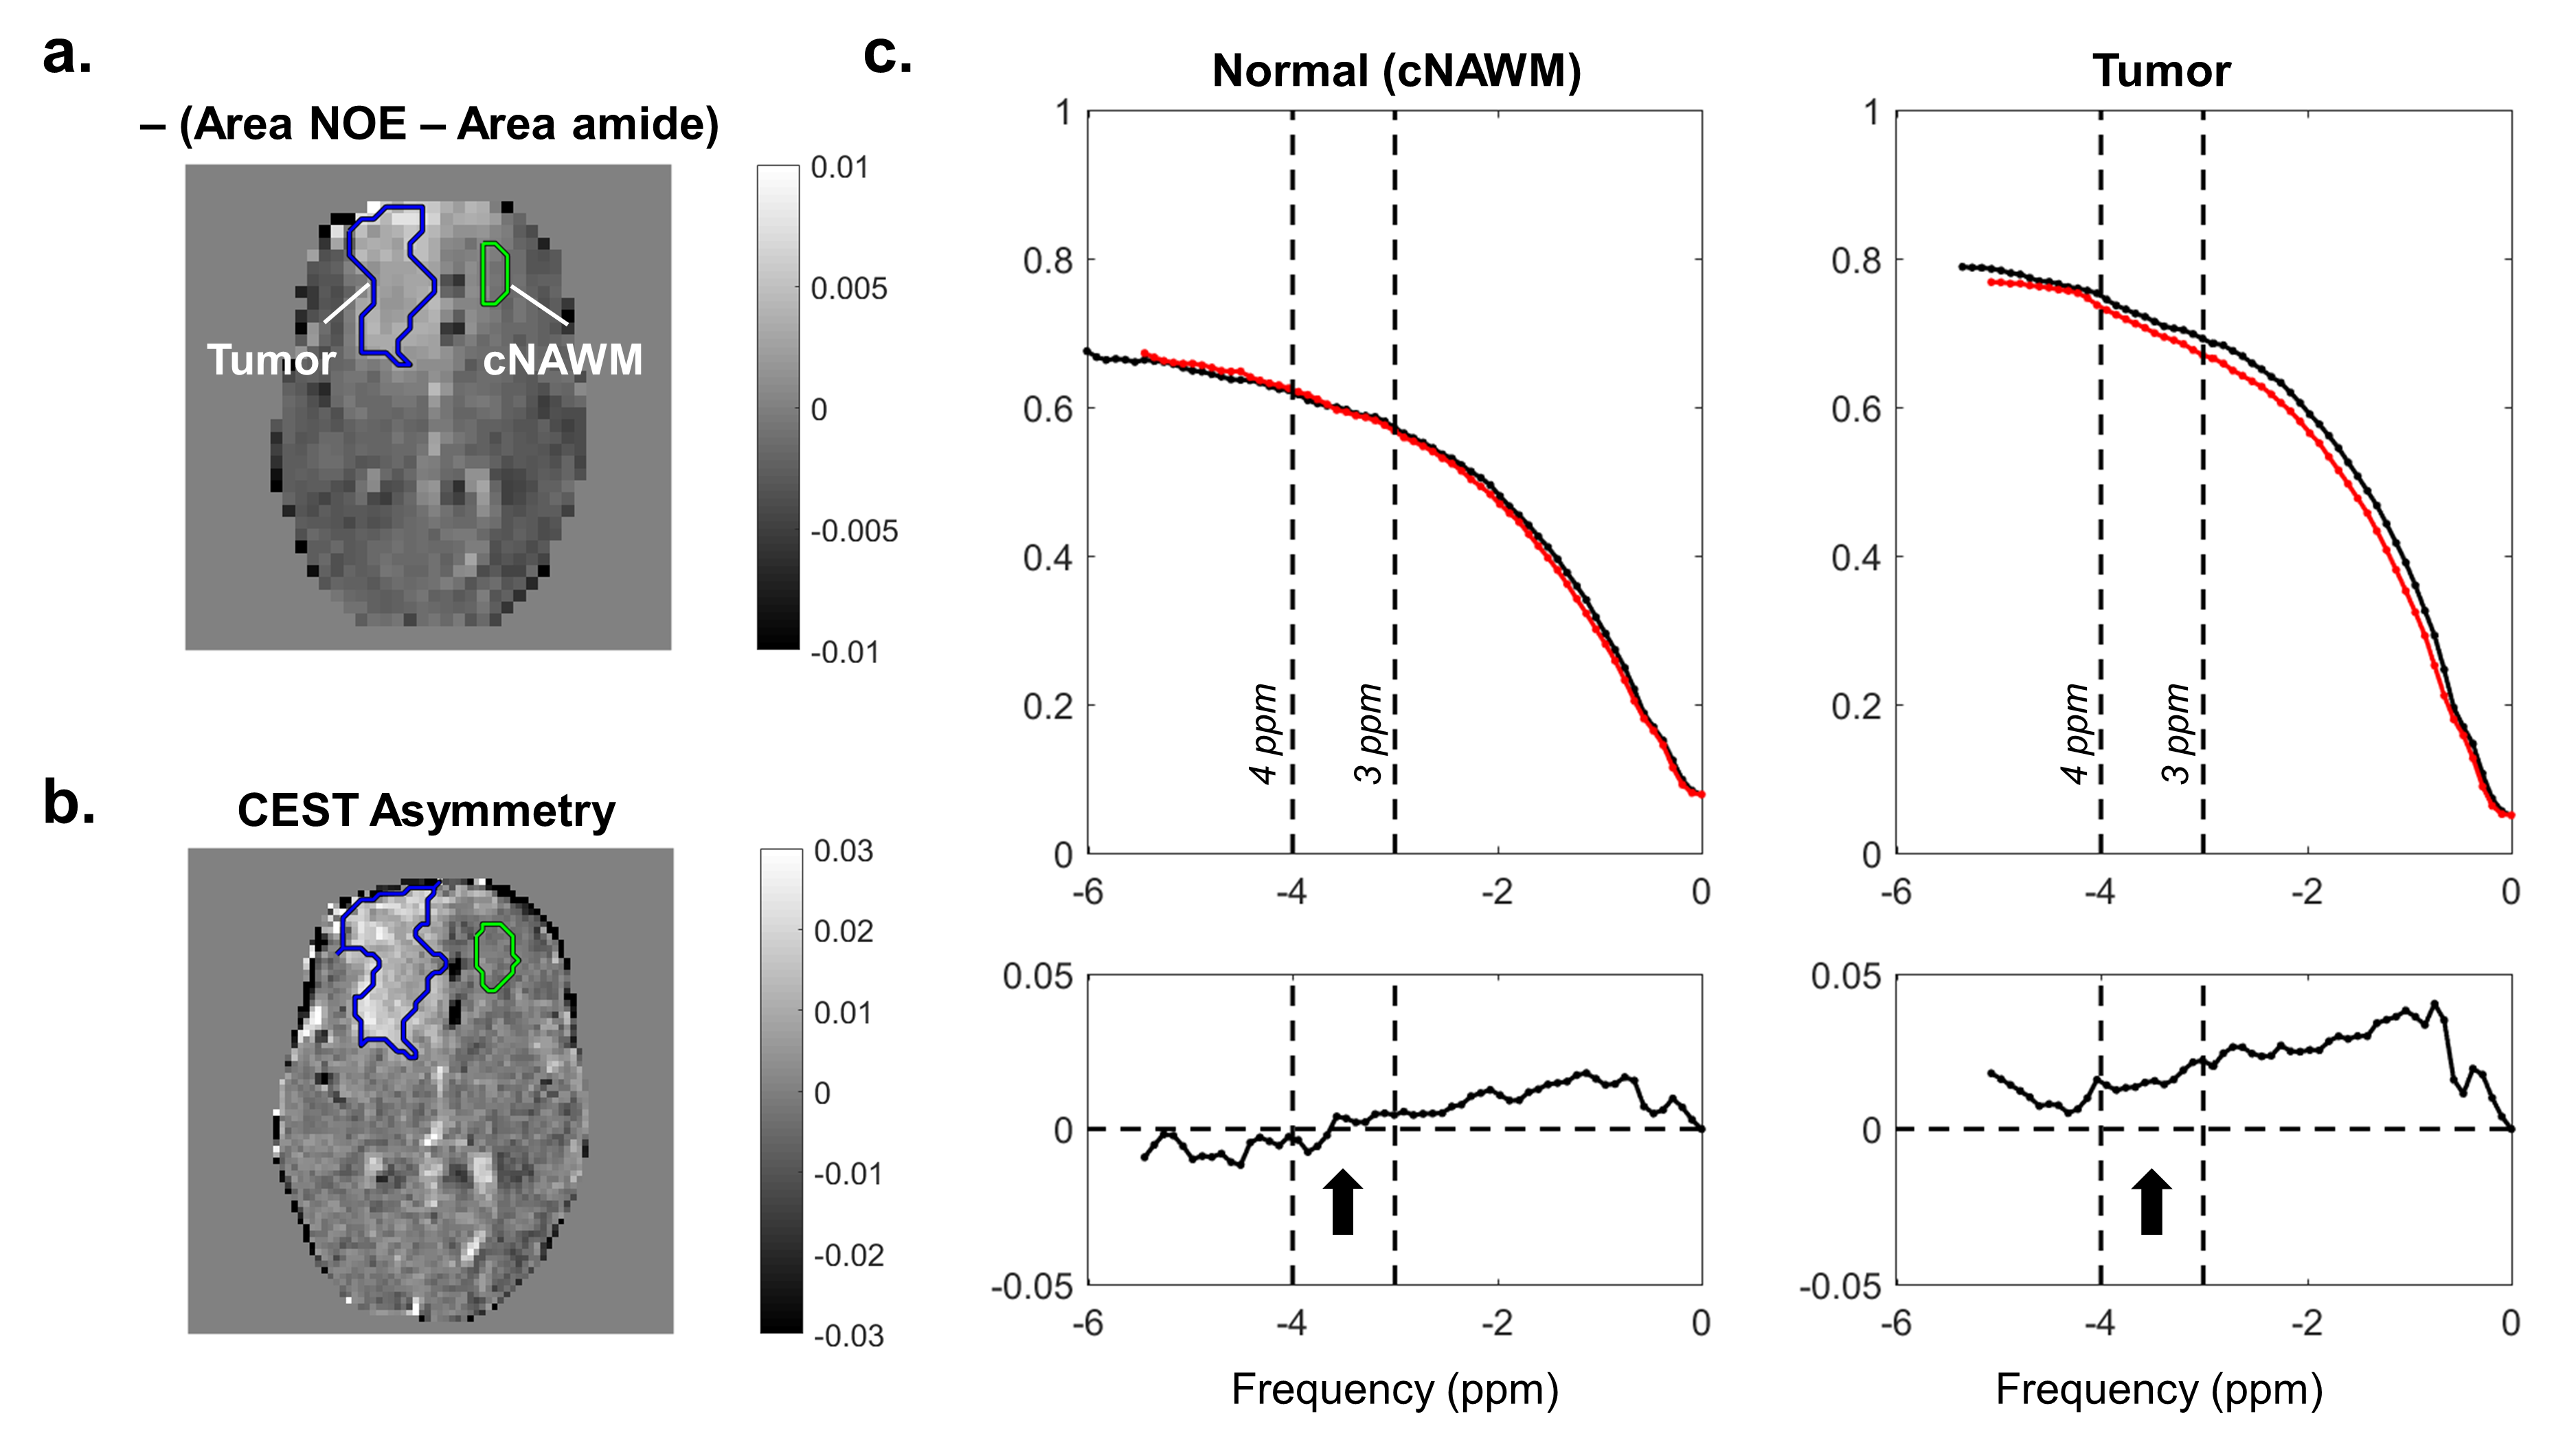
Figure 3a shows a difference map between the Nuclear Overhauser Effect (NOE) (quantified between -3 and -4 ppm) and amide (quantified between 3 and 4 ppm) areas. The CEST asymmetry map (Figure 3b) and corresponding plots for each region (Figure 3c) are shown to illustrate CEST asymmetry. Higher CEST asymmetry was seen at the tumor location compared to the normal region.
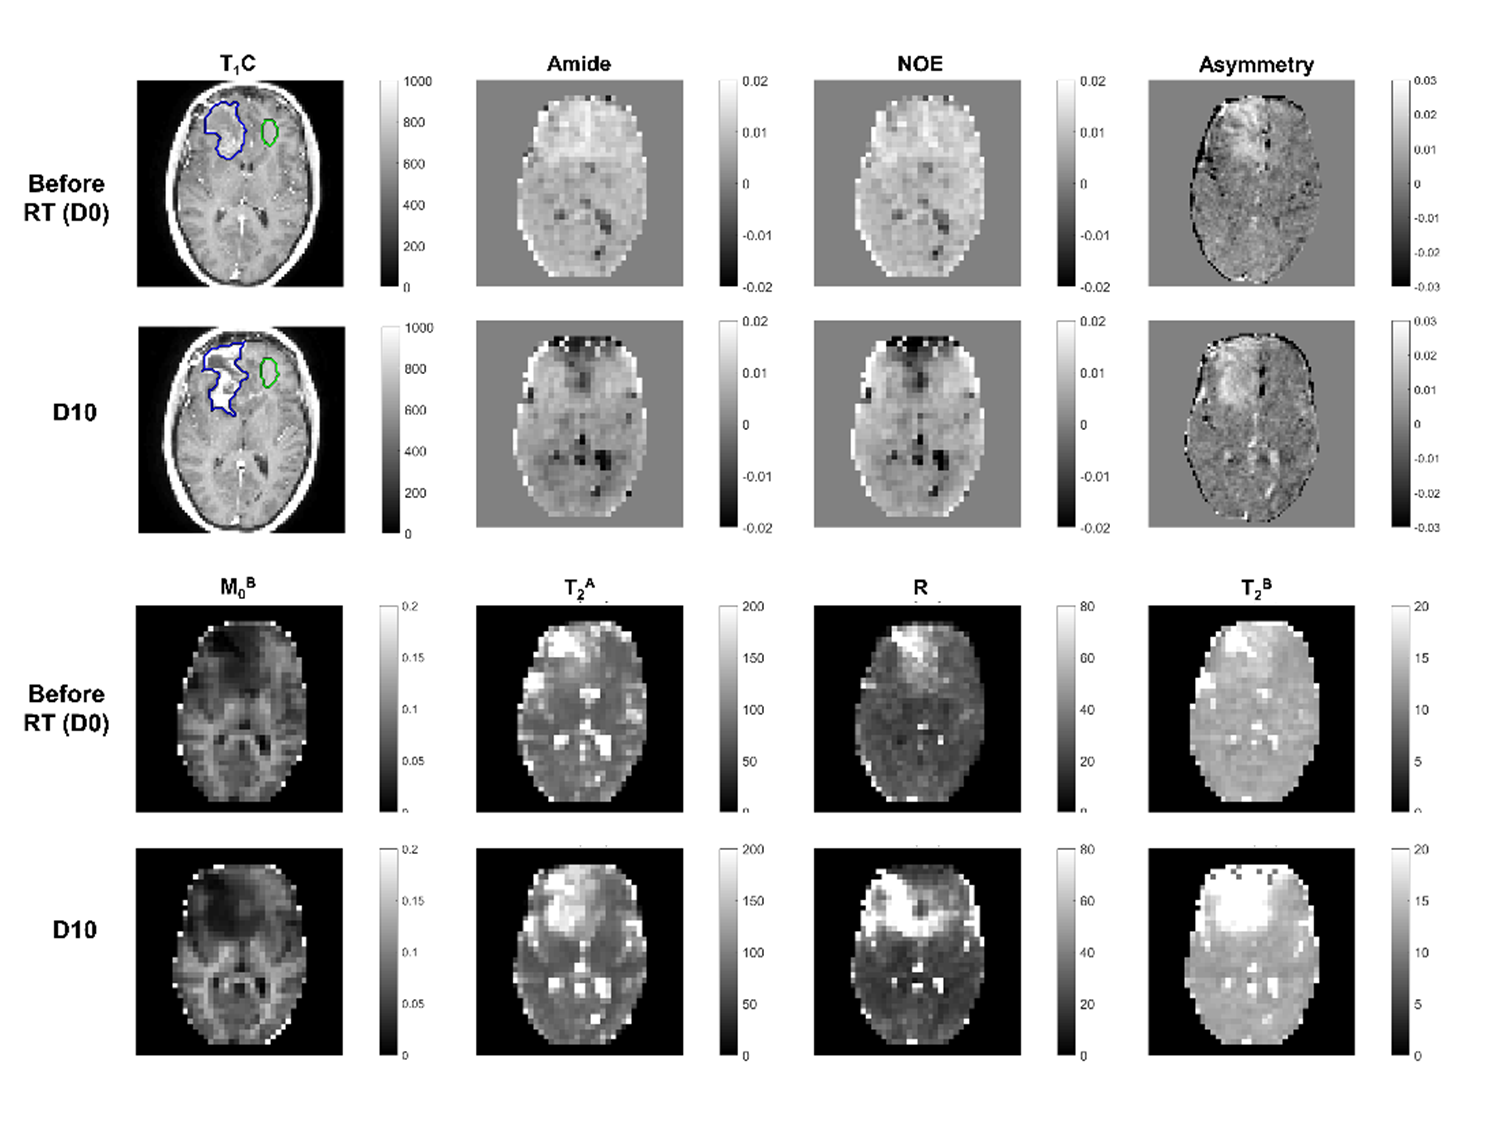
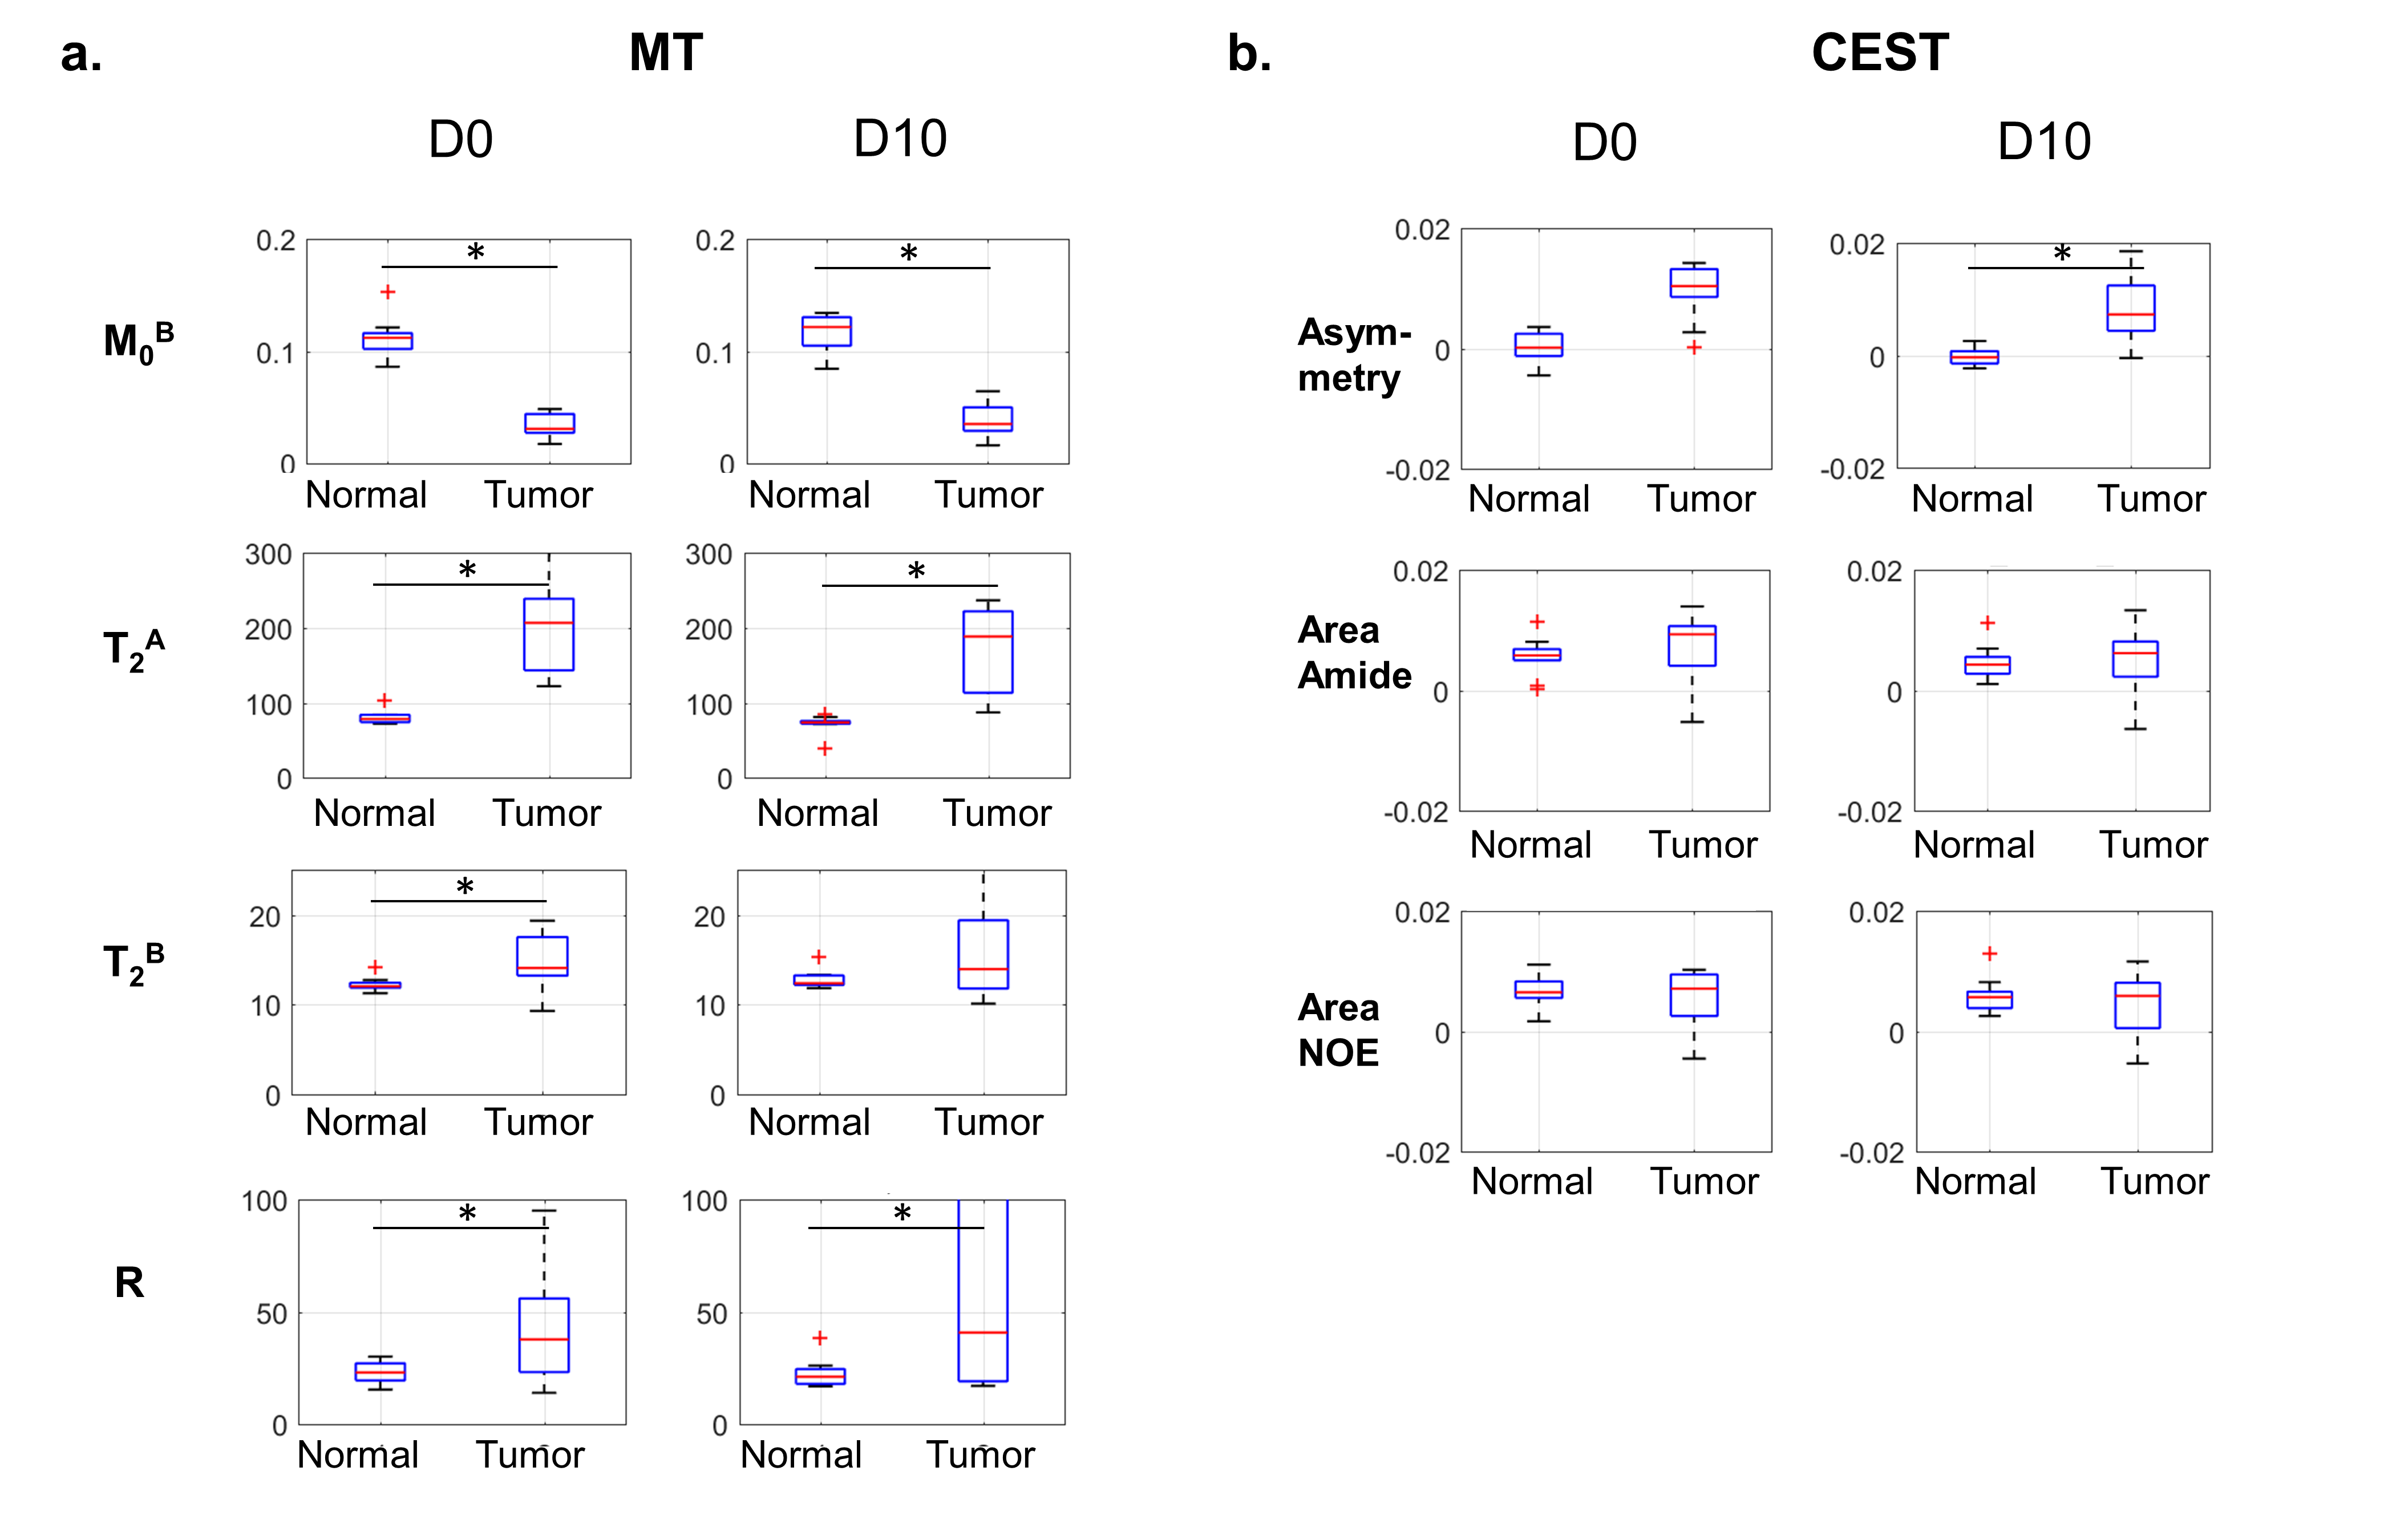
Figure 4 displays all MT/CEST maps for one patient, before radiation therapy and after 10 treatment fractions. The medians and interquartile ranges for all parameters are plotted in Figure 5, averaged over 10 GBM cases. For MT, the relative semi-solid fraction, M0B, was significantly lower in tumors than in normal regions (by the non-parametric Wilcoxon signed-rank test). Tumors also had significantly higher exchange rate, R, compared to normal regions. Higher CEST asymmetry was seen between tumor and normal regions. Overall, there were larger standard deviations in the tumor regions, likely reflecting tumor heterogeneity.
Conclusion
The present study shows that the APT CEST asymmetry can be detected and quantified in GBM patients at 1.5T. The tumor asymmetry values at 1.5T are more positive than those reported at 3T8, likely owing to differences in NOE effect between the two field strengths. Significant differences were found in the MT semi-solid fractions and exchange rates between tumor and normal regions. This shows promise for wider applicability of CEST imaging on scanners with lower field strengths.Acknowledgements
The authors acknowledge funding from NSERC, Terry Fox and CIHR.References
1. Stupp R, Mason WP, Van Den Bent MJ, Weller M, Fisher B, Taphoorn MJ, Belanger K, Brandes AA, Marosi C, Bogdahn U, Curschmann J. Radiotherapy plus concomitant and adjuvant temozolomide for glioblastoma. New England Journal of Medicine. 2005 Mar 10;352(10):987-96.
2. Wolff SD, Balaban RS. Magnetization transfer contrast (MTC) and tissue water proton relaxation in vivo. Magn Reson Med. 1989;10(1):135–144.
3. Henkelman RM, Huang X, Xiang QS, Stanisz GJ, Swanson SD, Bronskill MJ. Quantitative interpretation of magnetization transfer. Magnetic resonance in medicine. 1993 Jun;29(6):759-66.
4. Wolff SD, Balaban RS. NMR imaging of labile proton exchange. Journal of magnetic resonance. 1990;86:164-9.
5. Jones CK, Schlosser MJ, Van Zijl PC, Pomper MG, Golay X, Zhou J. Amide proton transfer imaging of human brain tumors at 3T. Magnetic Resonance in Medicine: An Official Journal of the International Society for Magnetic Resonance in Medicine. 2006 Sep;56(3):585-92.
6. Zhou J, Zhu H, Lim M, Blair L, Quinones‐Hinojosa A, Messina SA, Eberhart CG, Pomper MG, Laterra J, Barker PB, Van Zijl PC. Three‐dimensional amide proton transfer MR imaging of gliomas: initial experience and comparison with gadolinium enhancement. Journal of Magnetic Resonance Imaging. 2013 Nov;38(5):1119-28.
7. Scheidegger R, Wong ET, Alsop DC. Contributors to contrast between glioma and brain tissue in chemical exchange saturation transfer sensitive imaging at 3 Tesla. Neuroimage. 2014 Oct 1;99:256-68.
8. Mehrabian H, Myrehaug S, Soliman H, Sahgal A, Stanisz GJ. Evaluation of Glioblastoma Response to Therapy With Chemical Exchange Saturation Transfer. Int J Radiat Oncol Biol Phys. 2018 Jul 1;101(3):713-723. doi: 10.1016/j.ijrobp.2018.03.057.
9. Mehrabian, H., Desmond, K. L., Soliman, H., Sahgal, A. & Stanisz, G. J. Differentiation between Radiation Necrosis and Tumor Progression Using Chemical Exchange Saturation Transfer. Clin. Cancer Res. clincanres.2265.2016 (2017). doi:10.1158/1078-0432.CCR-16-2265
10. Regnery S, Adeberg S, Dreher C, Oberhollenzer J, Meissner JE, Goerke S, Windschuh J, Deike-Hofmann K, Bickelhaupt S, Zaiss M, Radbruch A. Chemical exchange saturation transfer MRI serves as predictor of early progression in glioblastoma patients. Oncotarget. 2018 Jun 19;9(47):28772.
11. Jiang S, Eberhart CG, Lim M, Heo HY, Zhang Y, Blair L, Wen Z, Holdhoff M, Lin D, Huang P, Qin H. Identifying Recurrent Malignant Glioma after Treatment Using Amide Proton Transfer-Weighted MR Imaging: A Validation Study with Image-Guided Stereotactic Biopsy. Clinical Cancer Research. 2018 Jan 1:clincanres-1233.
12. Ma B, Blakeley JO, Hong X, et al. Applying amide proton transfer-weighted MRI to distinguish pseudoprogression from true progression in malignant gliomas. J Magn Reson Imaging 2016; 44:456–462.
13. Graham SJ, Henkelman RM. Understanding pulsed magnetization transfer. J Magn Reson Imaging 1997;7:903–912
14. Sled JG, Pike GB. Quantitative imaging of magnetization transfer exchange and relaxation properties in vivo using MRI. Magnetic Resonance in Medicine: An Official Journal of the International Society for Magnetic Resonance in Medicine. 2001 Nov;46(5):923-31.
15. Portnoy S, Stanisz GJ. Modeling pulsed magnetization transfer. Magnetic Resonance in Medicine: An Official Journal of the International Society for Magnetic Resonance in Medicine. 2007 Jul;58(1):144-55.
16. Weigel, M. Extended phase graphs: Dephasing, RF pulses, and echoes - pure and simple. J. Magn. Reson. Imaging 41, 266–295 (2015).
17. Hennig J. Echoes - how to generate, recognize, use or avoid them in MR‐imaging sequences. Part I: Fundamental and not so fundamental properties of spin echoes. Concepts in Magnetic Resonance Part A. 1991 Jul 1;3(3):125-43.
18. Malik, S. J., Teixeira, R. P. A. G. & Hajnal, J. V. Extended phase graph formalism for systems with magnetization transfer and exchange. Magn. Reson. Med. (2017). doi:10.1002/mrm.27040
19. Heo HY, Zhang Y, Jiang S, Lee DH, Zhou J. Quantitative assessment of amide proton transfer (APT) and nuclear overhauser enhancement (NOE) imaging with extrapolated semisolid magnetization transfer reference (EMR) signals: II. Comparison of three EMR models and application to human brain glioma at 3 Tesla. Magnetic resonance in medicine. 2016 Apr 1;75(4):1630-9.
20. Desmond KL, Stanisz GJ. Understanding quantitative pulsed CEST in the presence of MT. Magnetic resonance in medicine. 2012 Apr 1;67(4):979-90.
Figures