3975
Multi-frequency magnetic resonance elastography with spiral readout, respiratory navigator and stroboscopic wave sampling for cardiac stiffness mapping with high spatial and temporal resolution.1Department of Radiology, Charité - Universitätsmedizin Berlin, Berlin, Germany, 2Institute of Medical Informatics, Charité - Universitätsmedizin Berlin, Berlin, Germany
Synopsis
Cardiac magnetic resonance elastography (MRE) promises a quantitative mapping of the mechanical function of the myocardium. However, the implementation of cardiac MRE is challenging due to fast motion, high heterogeneity and temporally varying intrinsic properties of the heart. To overcome these limitations, we introduce a novel cardiac MRE sequence with spiral readout, respiratory navigator and stroboscopic wave sampling. It allows acquiring 100 wave fields with 45ms temporal resolution, 1.6x1.6mm² in-plane resolution at three frequencies within 9 minutes. Preliminary data in 8 healthy volunteers show a substantial variation of myocardial shear-wave velocity from 1.5±0.2m/s during diastole to 2.1±0.2m/s during systole.
Introduction
Cardiac function is characterized by the periodic contraction of the ventricles following the systolic increase of myocardial stiffness.1 While stiffness of the heart wall is known to be an essential biomarker for cardiac health, current imaging modalities lack its direct quantification. Magnetic resonance elastography (MRE) holds promise to quantitatively map myocardial stiffness in clinical examinations. However, due to the complex synchronization of the heartbeat, breathing, image acquisition, and external vibrations, cardiac MRE applications remain a challenge, and only sparse in-vivo data have been reported.2-4 To address these challenges, we developed multi-frequency MR elastography with spiral readout, respiratory navigator and stroboscopic wave sampling to measure the stiffness of the left ventricle (LV) wall with high spatial and temporal resolution.5,6 A pilot study was performed in a group of young healthy volunteers and first reference values of shear wave speed are reported.Methods
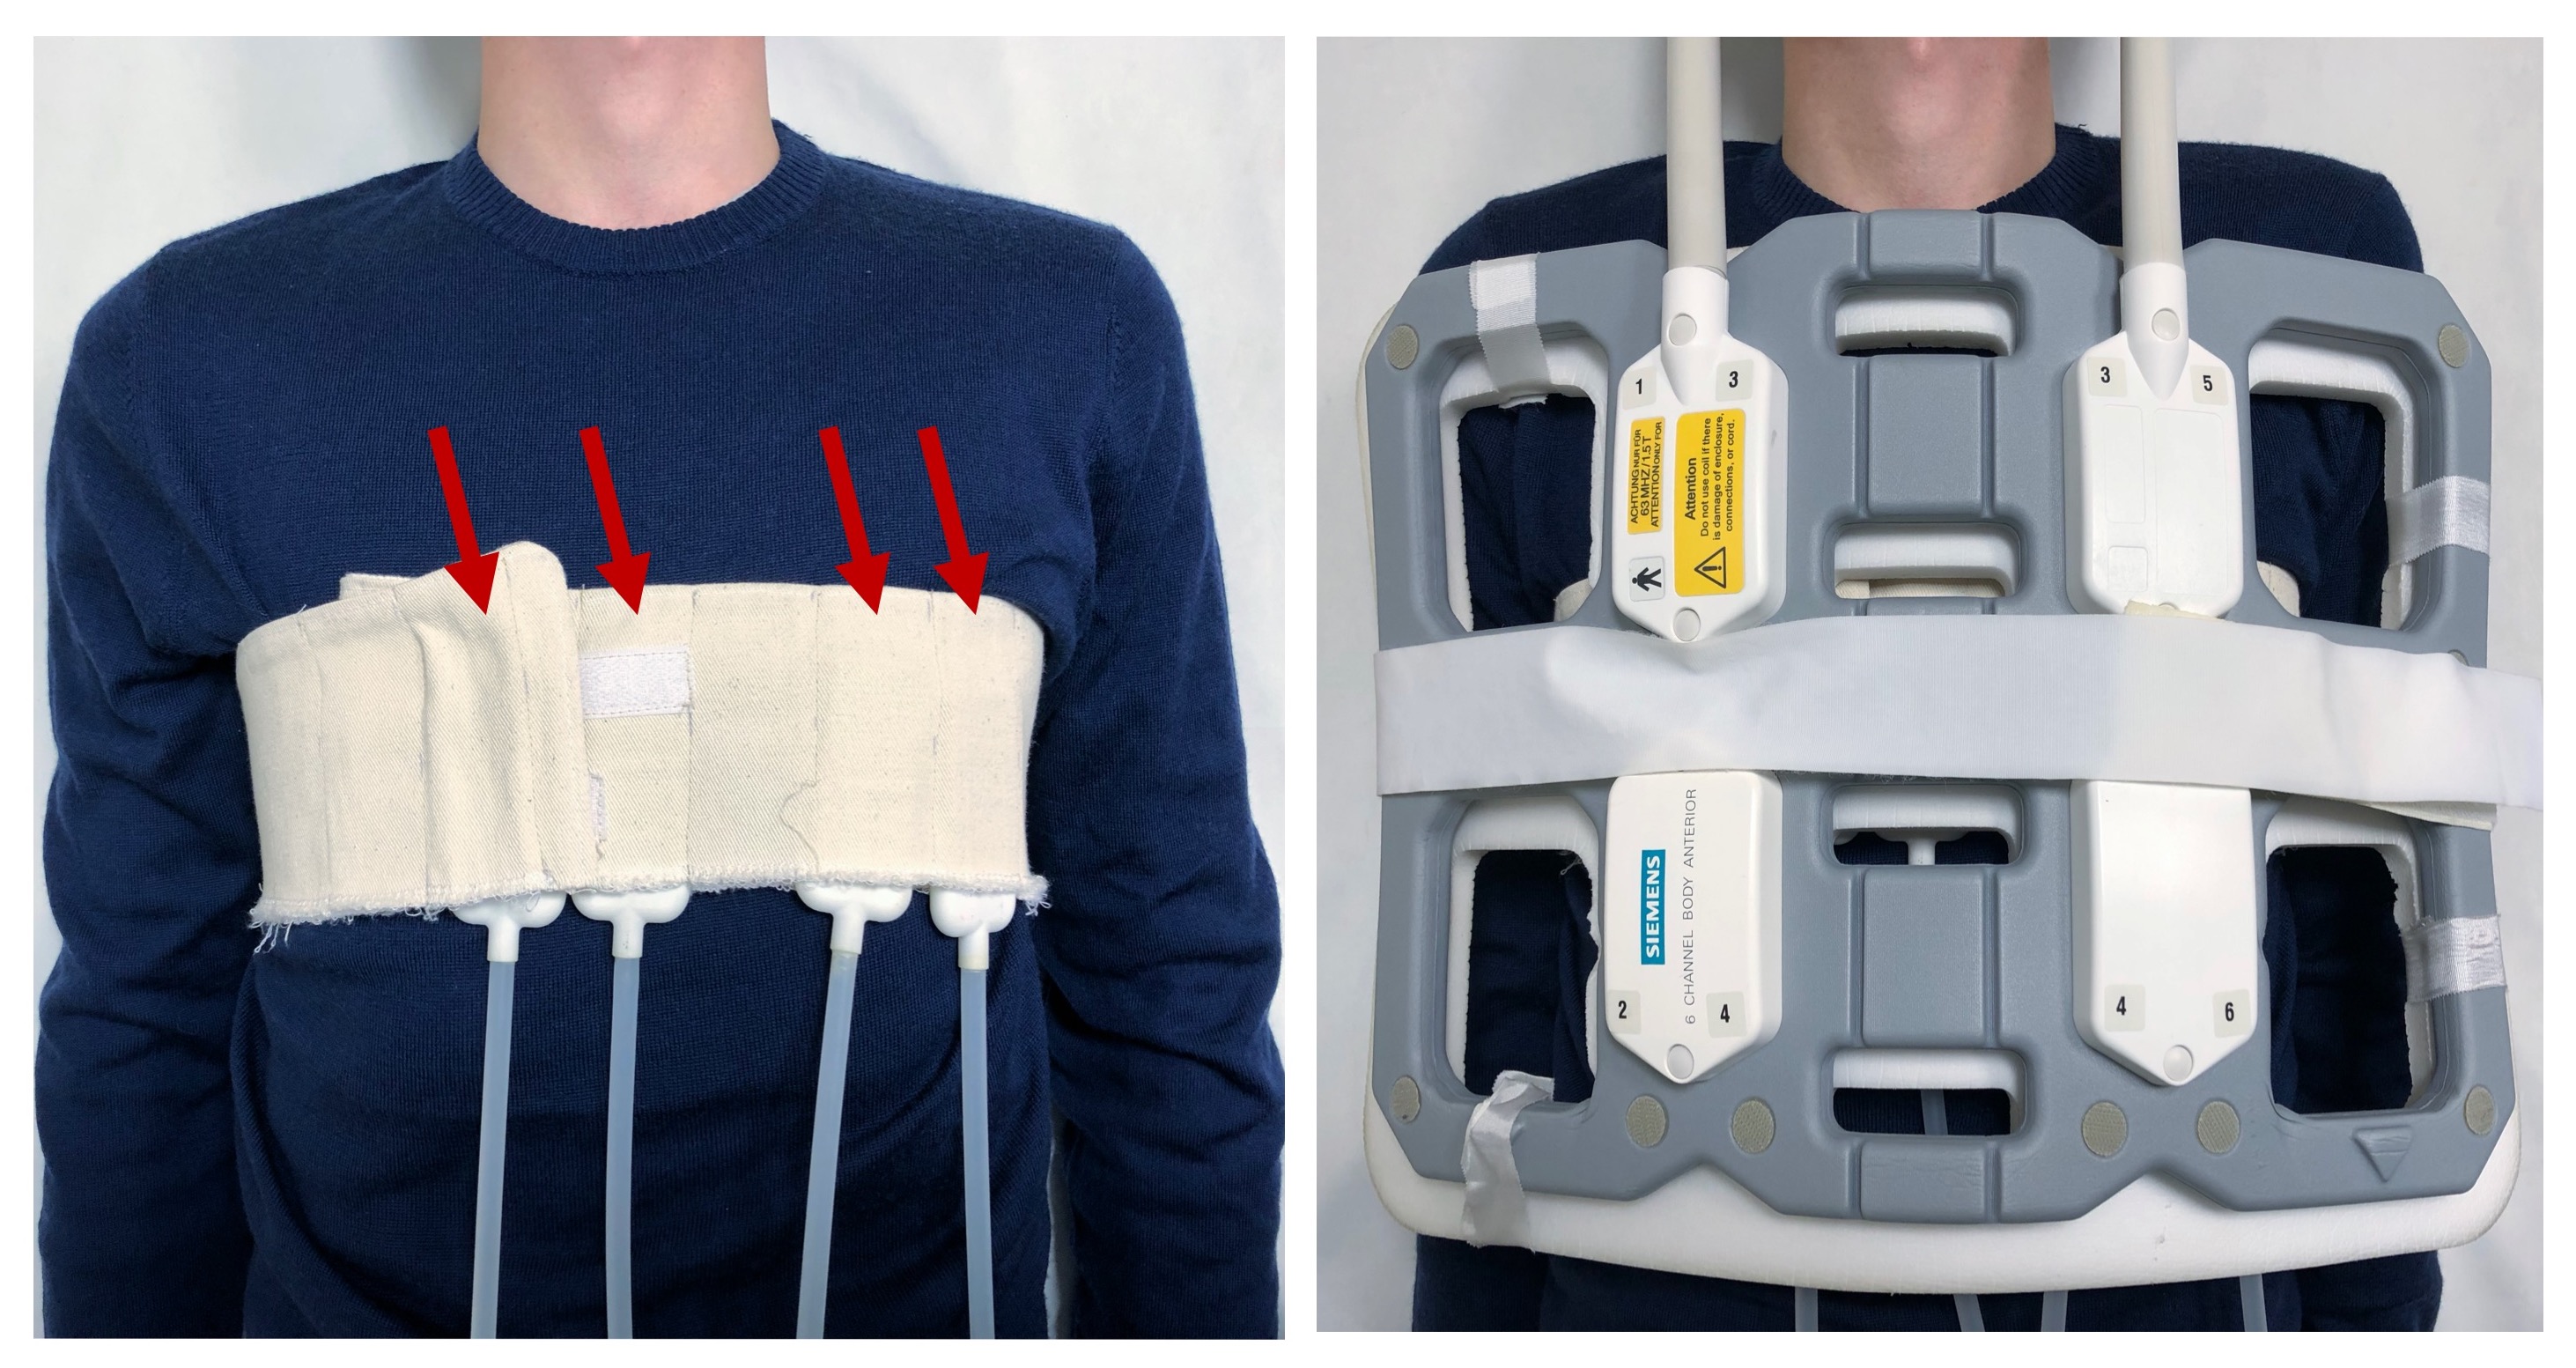
We investigated eight healthy male volunteers (mean age ± SD 28±4m years; age range 23 to 34 years) with a mean heart rate of 66±11 /min and systolic- and diastolic blood pressure of 124±10mmHg and 75±6mmHg respectively. All MRE experiments were performed on a 1.5-T clinical MRI scanner (Magnetom Sonata, Siemens, Erlangen Germany) using multi-channel phased-array surface coils and a fingertip pulse oximeter for cardiac triggering. Four pressurized air drivers placed onto the anterior surface of the volunteer’s chest were used for continuous harmonic vibrations at 50, 62.5, and 80Hz frequencies (see figure 1). A cardiac-gated, steady-state MRE image sequence with segmented spiral readout and stroboscopic wave sampling was used to acquire 101 sequential images, capturing 4.5 seconds of the cardiac function with a frame rate of 22Hz according to 45ms TR. The timing of the sequence is illustrated in figure 2. For each image, 5 spiral trajectories from different heart-beats were combined to fill a complete k-space. We intentionally mismatched the TR and the vibration periods of 20ms, 16ms, and 12.5ms to capture different dynamic phases of the wave in a stroboscopic fashion. Although the MRE sequence was performed in breath-hold, a pencil beam navigator was measured periodically to compensate for drift motion of the heart during the experiment. Spatial resolution was 1.6x1.6x5.0mm³. Total acquisition time for 101x3x3 images (101 phases, three wavefield components, three frequencies) was 9 minutes. The first image was used for background phase correction only and neglected during further analysis. Figure 3 show examples of the acquired raw-phase data of the complex MR signal S* from a volunteer. The approximated LV-volumes were derived from the magnitude images |S*| in the short-axis view and segmented by T2* thresholding. MRE postprocessing was based on tomoelastography, adapted to the stroboscopic wavefield sampling approach and provided 100 shear-wave speed (SWS) maps as the surrogate of stiffness in units m/s.7Results
Figure 4 shows representative SWS-maps at diastole and systole of a volunteer, with corresponding LV-stiffness-volume time-series (4B) and derived LV-stiffness-volume cycle diagram (4C). The high SWS-intensity in the anterior part of the right ventricle is related to apparently long wavelengths in fluids also known as cyst artefact.8 In all volunteers, we observed a rapid increase of the shear-wave velocity within the LV-wall by 40±14 % from 1.5±0.2 m/s during diastole to 2.1±0.2 m/s during systole (p-value = 0.008, Wilcoxon-test, Figure 5). No significant correlations between the stiffness, age, or blood-pressure were found.Discussion
To the best of our knowledge, our study reports for the first time in the literature in-vivo cardiac MRE with in-plane spatial resolution of 1.6mm2 and temporal resolution of 22 elastograms per second. Wave-amplitude based cardiac MRE had a similar temporal resolution as the presented method, however, did not allow for quantitative stiffness measurements by wave inversion.2 We measured periodic stiffening and softening of the LV wall during systole and diastole respectively, reflecting the mechanical work performed by the beating heart which corresponds to the enclosed area in the stiffness-volume cycle shown in figure 4C. These MRE-derived stiffness-volume diagrams are in agreement with invasively measured pressure-volume cycles from the literature showing that stiffness increase runs ahead of ventricular contraction and, vice versa, myocardial stiffness relaxation precedes ventricular dilatation.1Conclusion
Our study demonstrates that multi-frequency spiral cardiac MRE can assess the mechanical function of the myocardium during the cardiac cycle with high spatial and temporal resolution. Our methods might be extended towards 3D-data acquisition and anisotropic inversion. Cardiac MRE has the potential to be used as a non-invasive and quantitative imaging technique for the assessment of cardiac mechanics in clinical examinations.Acknowledgements
We gratefully acknowledge the support of the German Research Foundation (GRK2260, BIOQIC).References
1. Hirsch, Sebastian, Ingolf Sack, and Jurgen Braun. Magnetic resonance elastography: physical background and medical applications. John Wiley & Sons, 2017.
2 Elgeti, Thomas, et al. "Shear-wave amplitudes measured with cardiac MR elastography for diagnosis of diastolic dysfunction." Radiology 271.3 (2014): 681-687.
3. Kolipaka, Arunark, et al. "Magnetic resonance elastography as a method for the assessment of effective myocardial stiffness throughout the cardiac cycle." Magnetic resonance in medicine 64.3 (2010): 862-870.
4. Arani, Arvin, et al. "In vivo, high‐frequency three‐dimensional cardiac MR elastography: Feasibility in normal volunteers." Magnetic resonance in medicine 77.1 (2017): 351-360.
5. Warmuth, Carsten et al. “Real-time ECG-gated continuous vibration multi-shot spiral elastography acquisition: application to time-resolved cerebral stiffness measurements during arterial pulsation.” presented at the ISMRM, Paris, 2018
6. Schrank, Felix et al. “Pulse-wave gated steady-state multi-shot spiral elastography of the human brain for time-resolved cerebral stiffness measurements during arterial pulsation.” presented at the 8thWCB, Dublin, 2018
7. Tzschätzsch, Heiko, et al. "Tomoelastography by multifrequency wave number recovery from time-harmonic propagating shear waves." Medical image analysis 30 (2016): 1-10.
8. Guo J, Hirsch S, Papazoglou P, Streitberger KJ, Fehlner A, Braun J, Sack I. Magnetic Resonance Elastography of cysts and fluid filled cavities. In: Proc 22st Annual Meeting ISMRM; 2014; Milan. p 1696.
Figures