3860
Multi-Slice LINE-scanning (MS-LINE) method to characterize the laminar specificity and variability in both evoked and resting-state fMRI1Max Planck Institute for Biological Cybernetics, Tuebingen, Germany, 2Graduate Training Centre of Neuroscience, Tuebingen, Germany, 3Department of Biomedical Engineering, NIJT, Newark, NJ, United States, 4MGH/MIT/HMS Athinoula A. Martinos Center for Biomedical Imaging, Department of Radiology, Harvard Medical School, Massachusetts General Hospital, Charlestown, MA, United States
Synopsis
Ultra-high field magnetic field strengths open new possibility for studying the neuronal input/output circuitry of the cortex and functional connectivity across the cortical layers. However, the spatiotemporal characteristics of laminar-specific fMRI signal remains to be better characterized in both task-related and resting state condition. Here, we present Multi-Slice FLASH based LINE-scanning (MS-LINE) methods, showing the multi-slice laminar-specific fMRI variability at different cortical regions of anesthetized rats. The results identify the distinct neurovascular coupling laminar patterns corresponding to different state of brain activity.
Introduction
Laminar-specific fMRI has been applied to better depict the neuronal input/output circuitry of the cortex and functional connectivity across the cortical layers in human brains [1-3]. However, the spatiotemporal characteristics of laminar-specific fMRI signal remains to be better characterized in both task-related and resting state condition. Previously, FLASH-based line-scanning method has been developed to acquire laminar-specific fMRI signal with high temporal (50 ms) and laminar spatial (50 µm) resolution to better characterize the fMRI onset time based on the neural input layers [4]. In the present study, we further developed Multi-Slice FLASH based LINE-scanning (MS-LINE) method to specify the multi-slice laminar-specific fMRI variability at different cortical regions of anesthetized rats. To identify and quantify the laminar specific hemodynamic features from individual animals, we analyzed laminar correlation patterns in both task-related and resting-state fMRI. Variations in spatiotemporal dynamic fMRI signals acquired from different animals demonstrate a possible brain-state dependent vascular hemodynamic response patterns.Methods
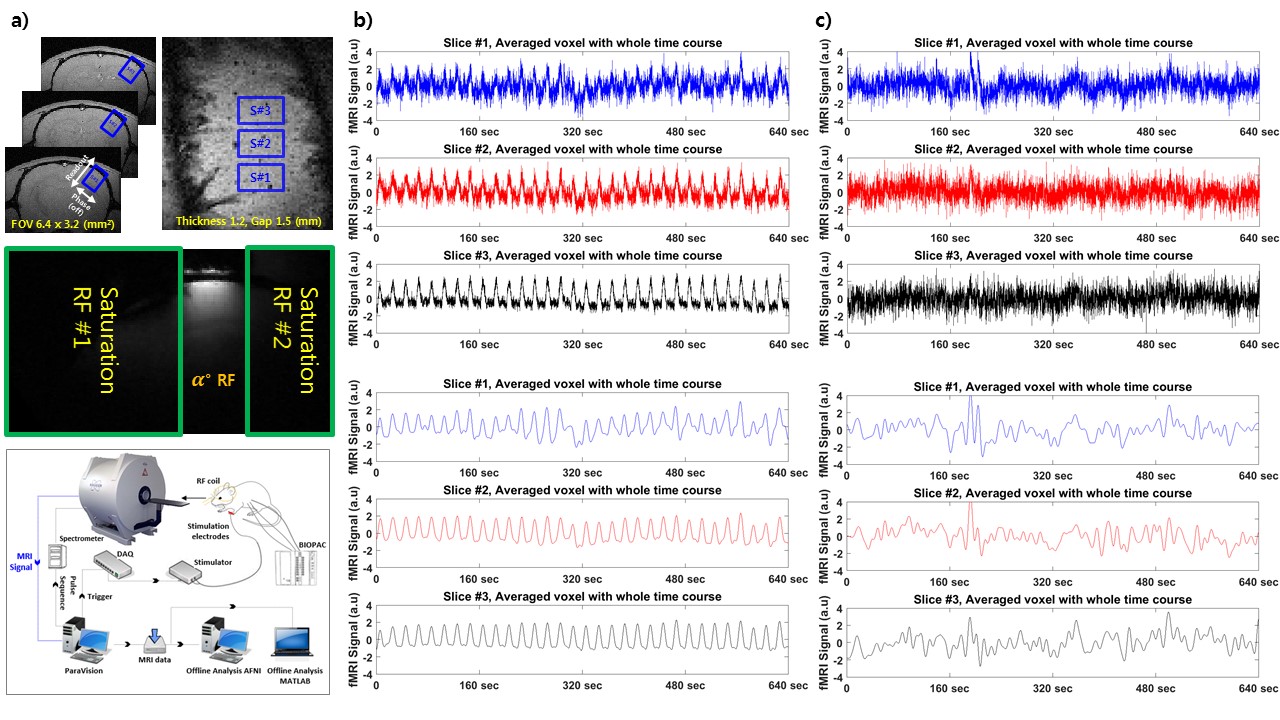
Multiple line-scanning fMRI datasets were acquired in three anesthetized rats at Bruker 14.1T scanner using in-house transceiver surface coil with 6mm diameter (16 trials each animal). Multi-Slice FLASH based line-scanning (MS-LINE) method are used by combining 2 saturation RF pulses to dampen the MR signal outside the regions of interest (ROI) (Fig. 1a middle). To acquire 3 slices in right cortex regions, slice positions oriented from anterior to posterior and 2D bSSFP pulse sequence was also used to identify the slice positions in an axial plane (Fig. 1a top). The follow parameters were used for the MS-LINE acquisition, TR/TE 100/9 ms, TA 10 min 40 sec, flip angle 50°, slice 3, slice thickness 1.2 mm, slice gap 1.5 mm, FOV 6.4 x 3.2 mm2 and matrix 128 x 32. Phase-encoding gradient was turned off to perform line-scanning acquisition.
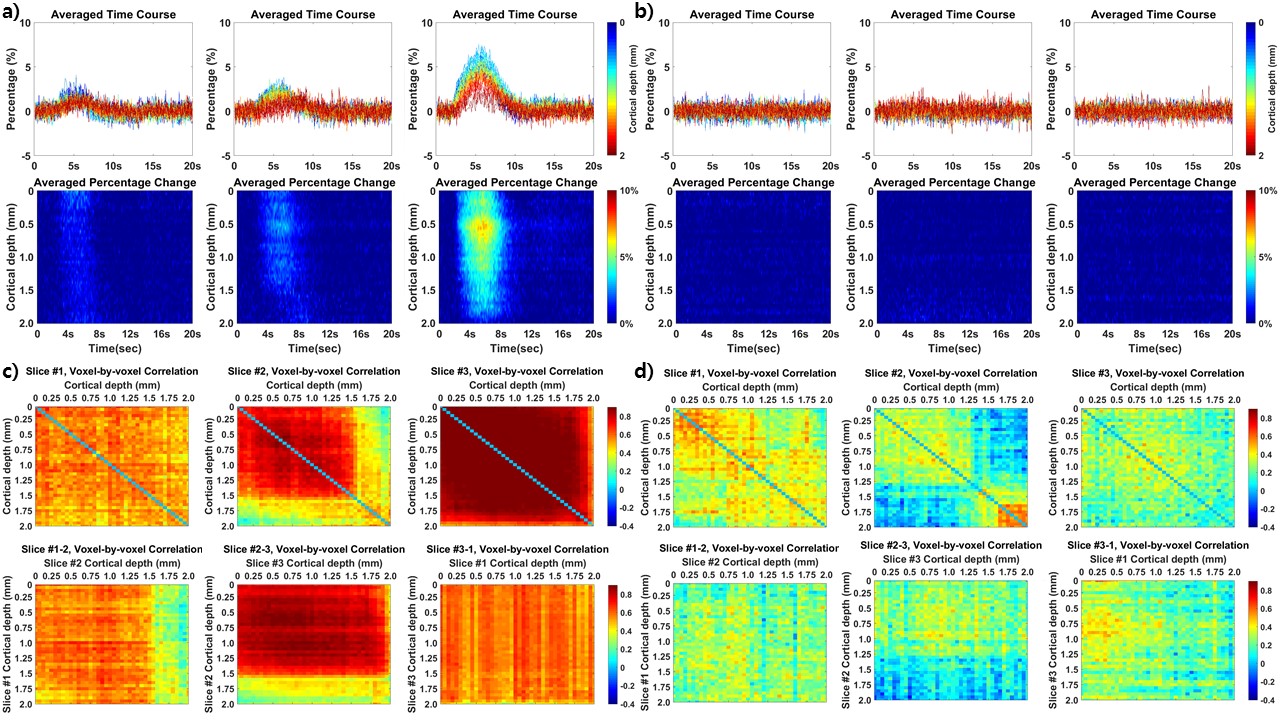
Functional activation was identified by performing a left forepaw stimulation task (3Hz, 4s, pulse width 300us, 2.5mA), followed by 1 second pre-stimulation, 4 second during electrical stimulation and 15 seconds post stimulation with a total 20 seconds for 10 min 40 sec (Fig. 1a bottom). All signal processing and analysis are implemented in Matlab software (R2018a; Mathworks, Natick, MA). Averaged time course and percentage change map were calculated for averaging every 20 second with the whole time course (640 seconds). The correlation coefficient was calculated in order to compare laminar-specific correlation patterns in temporal domain. Fisher-Z transform was used for averaging the correlation coefficients with multiple trials of each animal to avoid a problem of bias. Finite impulse response (FIR) bandpass filter was applied to identify fMRI signal fluctuation within 0.01 – 0.1 Hz in both task-related and resting state fMRI.
Results
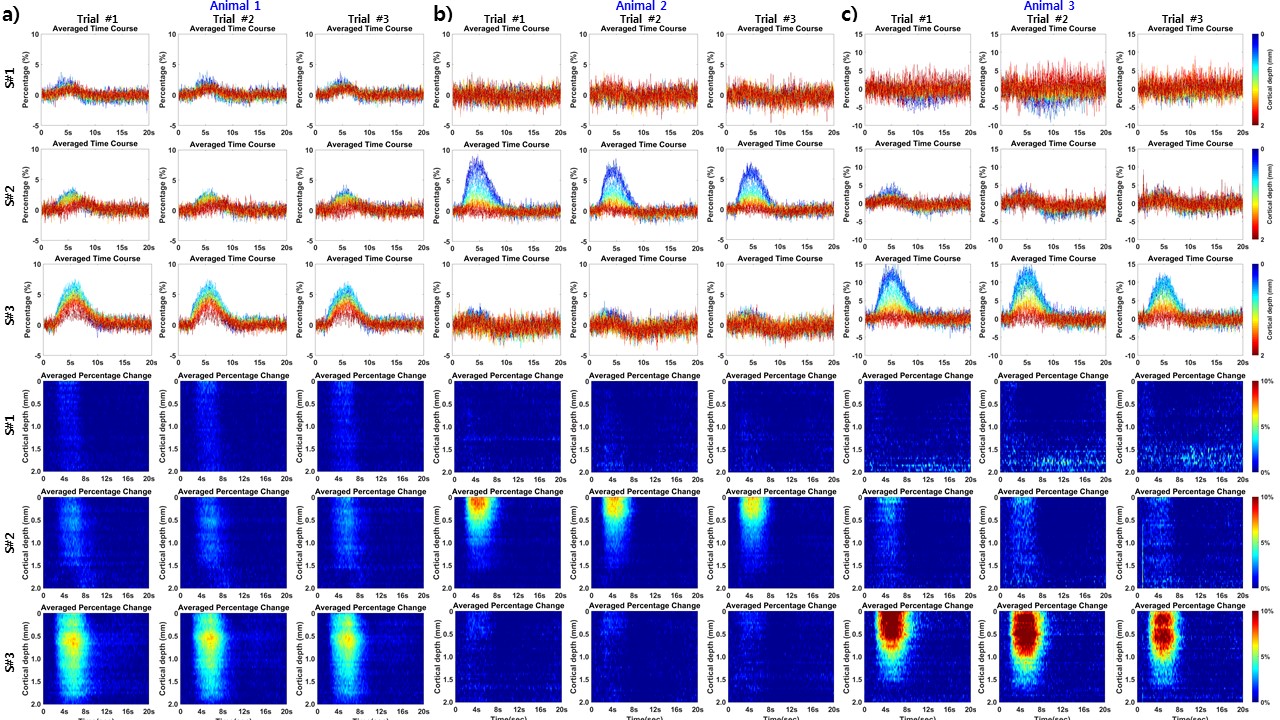
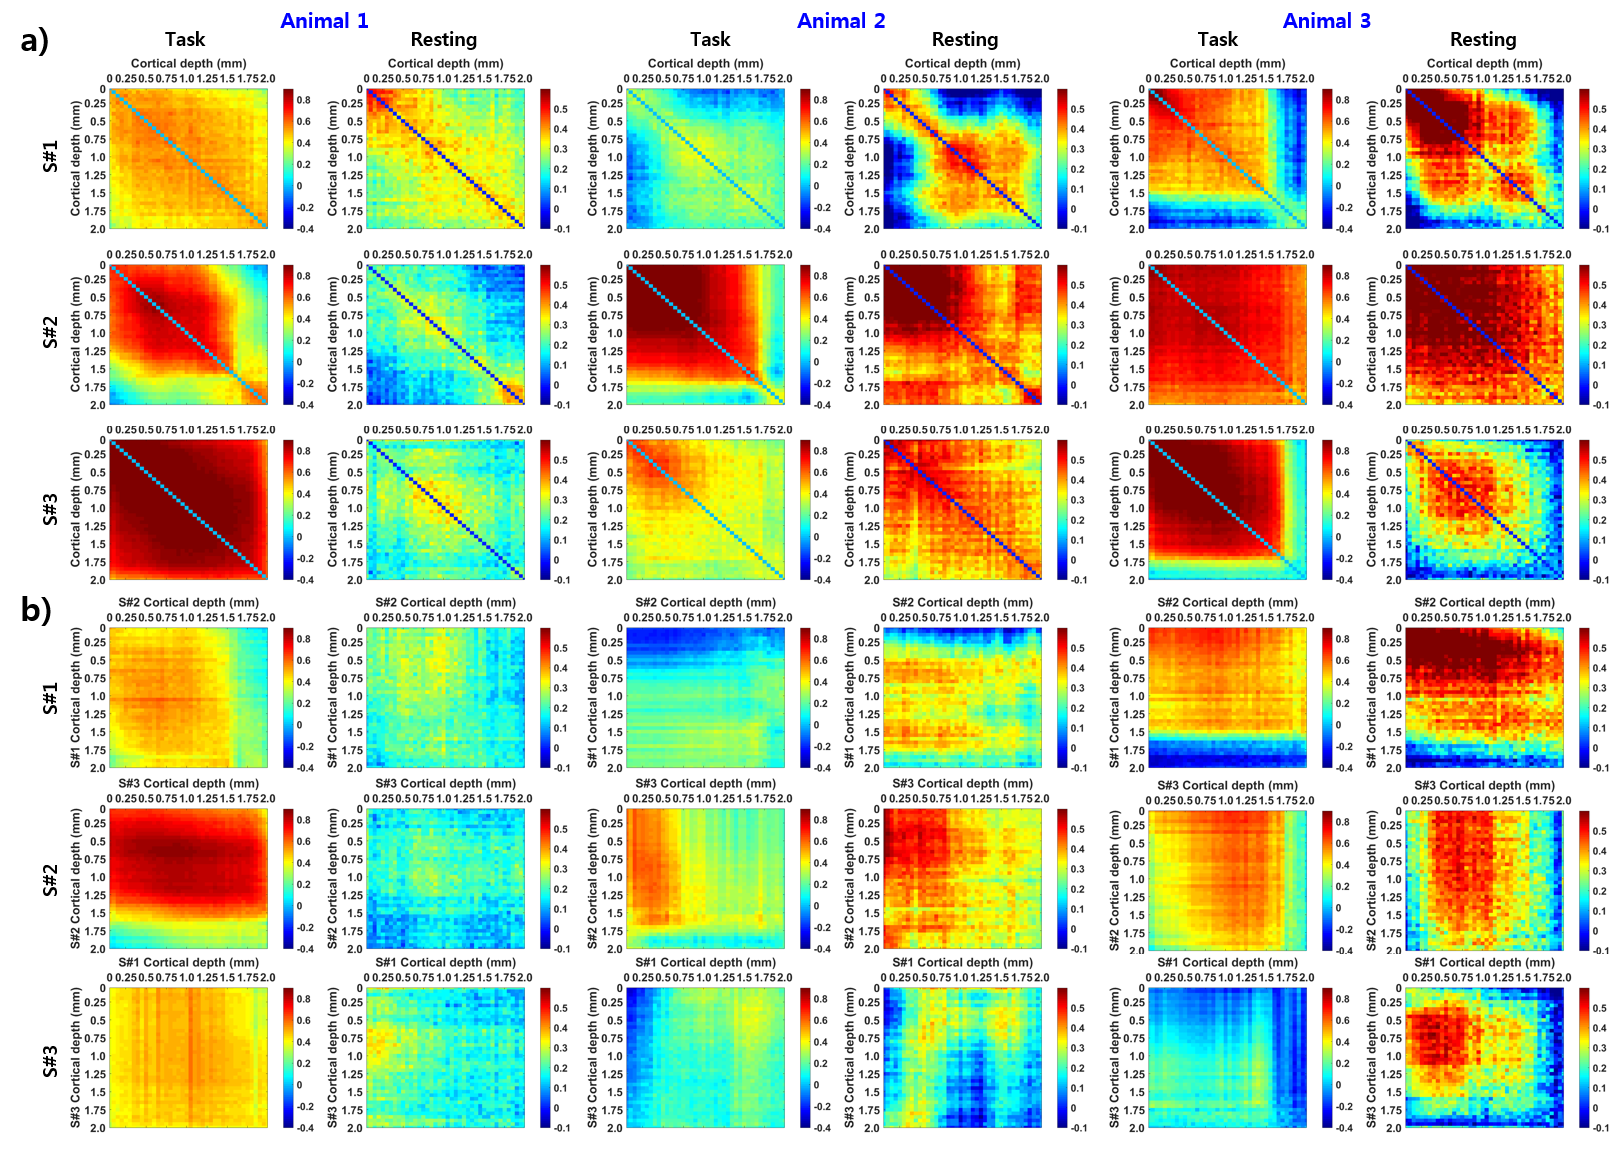
Three slices of the laminar profile of fMRI signal were detected with the MS-LINE method in anesthetized rats at both forepaw stimulation and resting-state conditions (Fig. 1). Fig. 1b shows the mean fMRI time course from each slice in 32 stimulation on/off block design paradigm, as well as the resting-state fMRI signal fluctuation (Fig. 1c, bottom panel with 0.1-0.01 bandpass filter). Fig. 2a shows the averaged fMRI signal (20s) from each stimulation epoch at different cortical layers and the fMRI percentage change map, showing clear BOLD signal mainly distributed at slice #3. The laminar-specific correlation matrices were represented for each slice showing the region-specific correlation pattern during task condition, as well as for the inter-slice laminar correlation patterns (Fig. 2c). For the same rat, the laminar-specific resting-state fMRI signal fluctuation across different slices were represented with correlation analysis (Fig. 2b, 2d). Interestingly, when we plot the MS-LINE fMRI data from different animals, highly variable laminar-specific fMRI patterns were observed (Fig. 3), showing different laminar-spreading profiles of the fMRI signal (e.g. animal #3 shows negative BOLD signal from the adjacent slice (slice #1) during stimulation). Fig. 4 shows the averaged correlation matrices of the three animals (8 trials each rat) at both task and resting-state condition. In particular, the laminar-specific correlation pattern during the resting-state is highly different across animals. This result demonstrates large variability of the laminar-specific fMRI responses and resting-state fluctuation patterns across animals, which may be dependent on the different brain states of the anesthetized animals.Discussions and Conclusions
We observed that the different correlation patterns from three animals exist in both task-related and resting-state fMRI. Future work will focus on understanding the neuronal basis of the laminar-specific functional connectivity. We will implement the concurrent laminar-specific intracellular calcium recordings with the line-scanning fMRI. In addition, this observation will be readily performed for examine the bilateral laminar-specific functional connectivity. The MS-LINE method provides a novel scheme to identify the distinct neurovascular coupling laminar patterns corresponding to different state of brain activity.Acknowledgements
No acknowledgement found.References
[1] Polimeni JR, Fischl B, Greve DN, Wald LL. Laminar analysis of 7T BOLD using an imposed spatial activation pattern in human V1. Neuroimage 2010; 52:1334-1346
[2] Turner R. Uses, misuses, Uses, misuses, new uses and fundamental limitations of magnetic resonance imaging in cognitive science. Philos Trans R Soc Lond B 2016; 371:20150349
[3] Huber L, Handwerker DA, Jangraw DC, Chen G, Hall A, Stüber C, Gonzalez-Castillo J, Ivanov D, Marrett S, Guidi M, Goense J, Poser BA, Bandettini PA. High-Resolution CBV-fMRI Allows Mapping of Laminar Activity and Connectivity of Cortical Input and Output in Human M1. Neuron 2017; 96: 1253-1263
[4] Yu X, Qian C, Chen D, Dodd SJ, Koretsky AP. Deciphering laminar-specific neural inputs with line-scanning fMRI. Nature methods 2014; 11:55-58
Figures