3848
3D CNN-based synthetic CT generation for head and neck radiotherapy using a clinically used turbo spin-echo T2-weighted sequence1Image Sciences Institute, University Medical Center Utrecht, Utrecht, Netherlands, 2Radiotherapy Department, University Medical Center Utrecht, Utrecht, Netherlands, 3MRIguidance, Utrecht, Netherlands
Synopsis
Deep learning-based synthetic CT (sCT) generation models are often based on T1-weighted gradient echo sequences. However, these sequences are generally not used for tumor/organs-at-risk delineation. In this study, we trained a U-Net type neural network using T2-weighted turbo spin-echo images from the clinical radiotherapy treatment planning protocol originally used for tumor/organs-at-risk contouring. The use of clinical images preserves scan times and facilitates soft tissue delineation on the source images of the sCTs, avoiding registrations. We showed that sCTs generated by the trained model provide accurate dosimetric results while limiting CT-induced streaking dental artefacts.
Introduction
Synthetic CT (sCT) generation is an advantageous tool in radiation treatment planning (RTP) workflows, eliminating the need for a separate CT exam and for multi-modal registration1. Atlas-based methods, proposed for sCT generation in the head and neck (H&N) region, are limited by presence of abnormal anatomies2,3. Recently developed deep learning techniques may be more robust to these anatomical changes by learning non-linear mappings between MR intensities and CT Hounsfield units (HU) using local neighborhood operators. Currently presented deep learning models for sCT generation in the H&N are often trained on T1-weighted gradient echo (GRE) images4,5. However, these images are generally not used for tumor/organs-at-risk (OAR) delineation and their use for sCT generation would require registration between the sCT and tumor/OAR. Therefore, in this study, we exploited the T2-weighted turbo spin-echo (TSE) images from the clinical RTP protocol originally optimized for tumor/OAR contouring to train a 3D-patch based convolutional neural network (CNN).Material and Methods
This study was conducted retrospectively on 41 patients with H&N cancer who underwent CT (Philips Brilliance Big Bore) and MR imaging (3T Philips Ingenia) for radiotherapy simulation. To generate the sCTs, a large field-of-view (FOV) transverse 2D T2-weighted TSE mDixon MRI, originally used for tumor/OAR contouring, was selected from the clinical protocol. 83 transverse slices with 3 mm thickness were acquired with TR/TE=9023/100ms, TSE factor=27, FOV=45x45 cm2 and reconstructed 0.94x0.94 mm2 resolution (acquired 1.3x1.18 mm2) in 5min24s and readout bandwidth of 876 Hz/px. Seven cases with severe image artefacts from dental implants (CT) or motion (MRI) were excluded from the study.
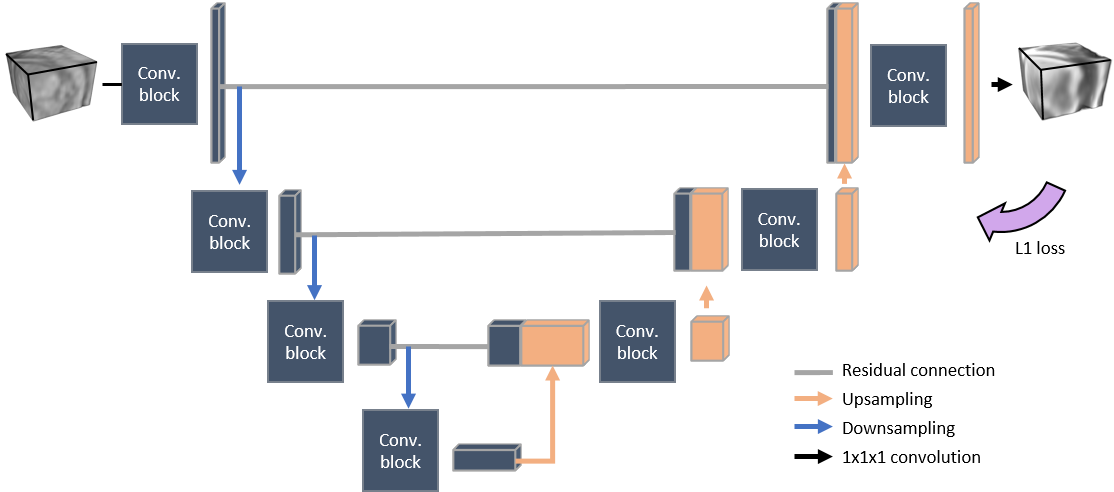
We implemented on Keras 2.1.3 with a Tensorflow 1.7 backend a paired 3D patch-based CNN derived from a U-Net and trained on the reconstructed in-phase MR images as presented in Figure 1. The training and testing were done on a GeForce GTX 1080 (NVIDIA, California, USA) graphical processing unit. To align images for training and evaluation, CT scans were non-rigidly registered (CTreg) to the in-phase MR images (Elastix6 4.7) and all images were resampled to 1x1x1 mm3 isotropic resolution. sCTs were created for all patients using three-fold cross validation including 22 patients in training and 12 in evaluation.
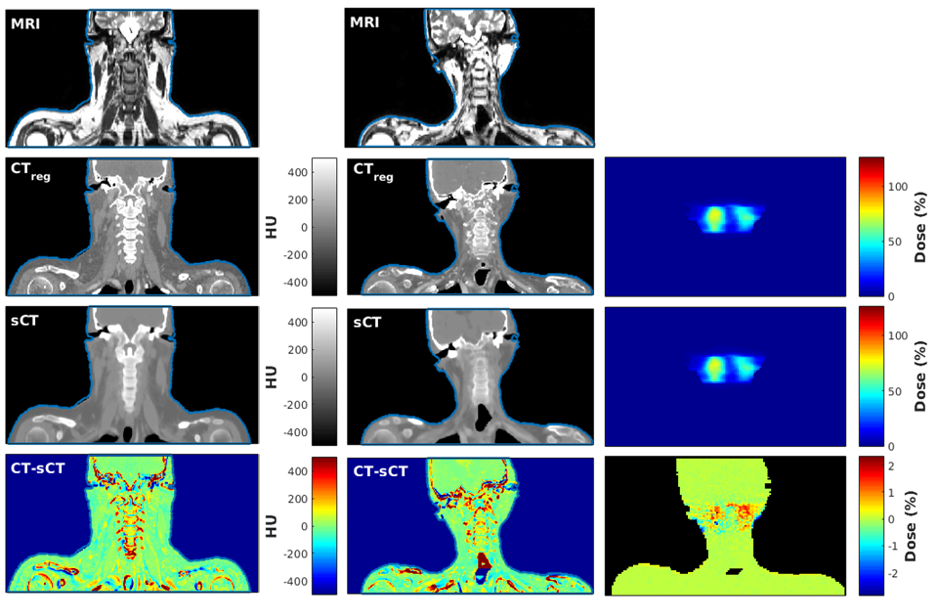
The evaluation comprises mean error (ME) and mean absolute error (MAE) computed within clinical body masks together with Dice score coefficients (DSC) computed in bone (HU > 200) and air (HU < -200) masks. Clinical CT-based treatment plans were recalculated on sCT using a treatment planning system (Monaco, Elekta AB).
Results
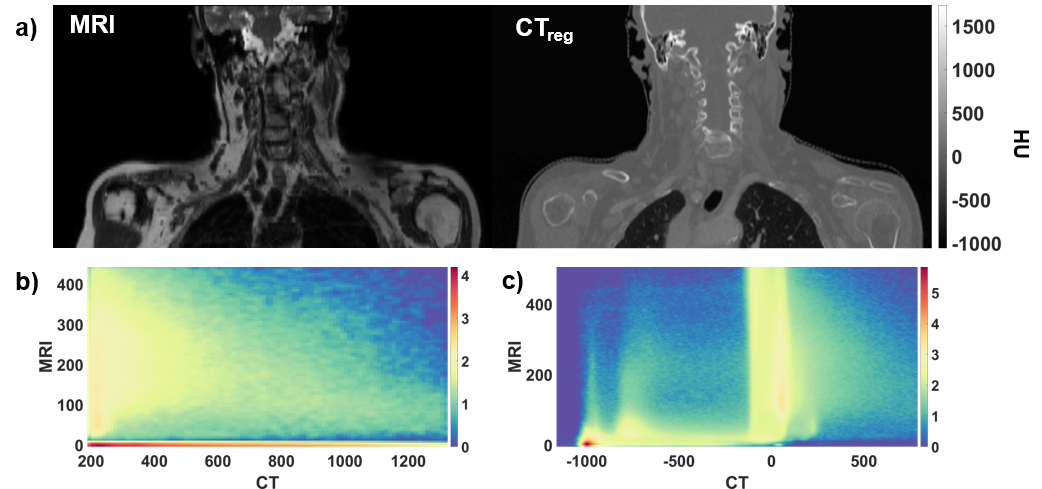
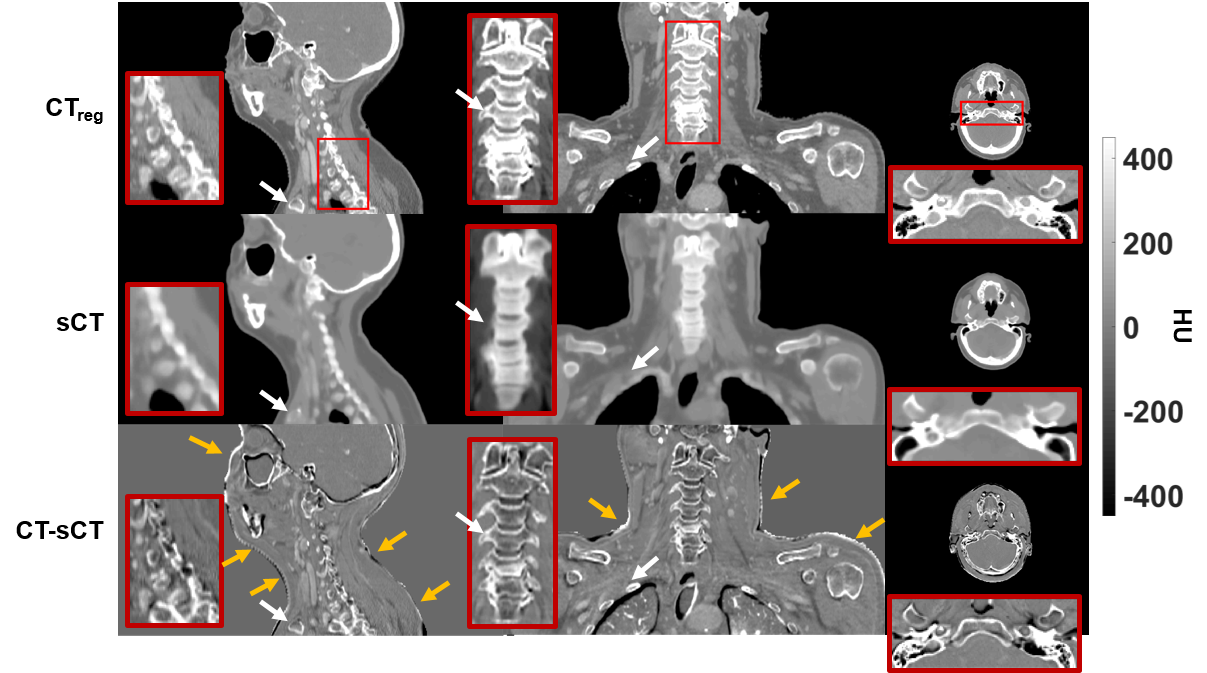
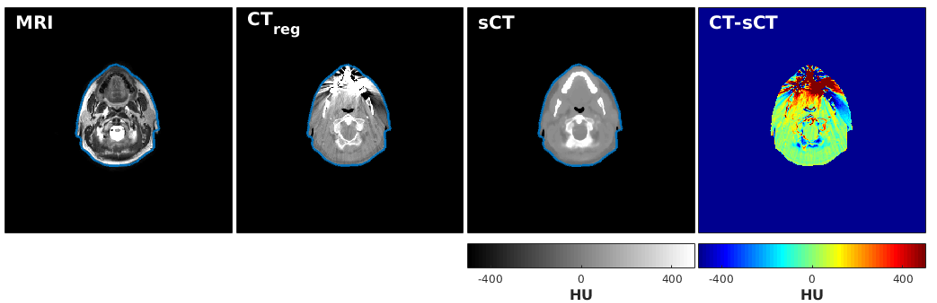
Figure 2 (a) shows an example TSE image used for the training together with the corresponding CT. Histograms of paired CT/MRI voxels demonstrate the non-linearity in bone mapping from MRI to CT (Figure 2-b) with the very low signal void specificity to cortical bone in TSE images (Figure 2-c). This reduced specificity compared to GRE images is due to the T2 signal decay at TE = 100ms in TSE images (high T2-weighting, low proton density weighting). sCTs displayed in Figure 3 show that the paired patch-based approach allowed proper sCT generation, even for the non-standard anatomy presented in Figure 4. MAE over the patient population was 75±9 HU and ME was 9±11 HU. DSC for the bone and air reached 0.70±0.07 and 0.79±0.08.
Error maps in Figure 3 show that main errors occurred in osseous regions mainly as a result of misclassification and probable registration errors. However, dosimetric analysis showed mean differences of -0.03±0.05% for dose within the body contours and -0.07±0.22% inside the high dose region (dose >90%) across the population. In addition, Figure 5 shows a patient with streaking dental artefacts, affecting CT scans but absent from the sCTs.
Discussion
We presented a CNN model based on clinically used TSE images that provides satisfactory sCTs for RTP. The highest errors were present in bone and were presumably due to the low specificity of signal voids in TSE images to cortical bone (Figure 2) and to registration errors. However, by using such a clinical sequence for sCT generation, the RTP protocol is kept identical. No registration is required between the tumor/OAR delineation and the sCT which, in addition, contains no dental artefacts as the TSE images are not prone to susceptibility artefacts.Conclusion
The clinical TSE sequence was shown to be suitable for synthetic sCT generation in the head and neck region thus preventing the acquisition of additional sequences for this task. Satisfactory sCTs for radiotherapy treatment planning were obtained with reduced CT-induced streaking artifacts and unaffected soft tissue delineation performed on the TSE images.Acknowledgements
The authors would like to acknowledge the support of NVIDIA Corporation with the donation of GPU for this research. This work is part of the research program Applied and Engineering Sciences (TTW) with project number 15479 which is (partly) financed by the Netherlands Organization for Scientific Research (NWO).References
1. Edmund JM, Nyholm T. A review of substitute CT generation for MRI-only radiation therapy. Radiation Oncology. 2017;12(1):28. doi:10.1186/s13014-016-0747-y
2. Farjam R, Tyagi N, Veeraraghavan H, Apte A, Zakian K, Hunt MA, Deasy JO. Multiatlas approach with local registration goodness weighting for MRI-based electron density mapping of head and neck anatomy. Medical physics. 2017;44(7):3706–3717. doi:10.1002/mp.12303
3. Guerreiro F, Burgos N, Dunlop A, Wong K, Petkar I, Nutting C, Harrington K, Bhide S, Newbold K, Dearnaley D, et al. Evaluation of a multi-atlas CT synthesis approach for MRI-only radiotherapy treatment planning. Physica medica (AIFB). 2017;35:7–17. doi:10.1016/j.ejmp.2017.02.017
4. Han X. MR-based synthetic CT generation using a deep convolutional neural network method: Medical Physics. 2017. doi:10.1002/mp.12155
5. Dinkla AM, Wolterink JM, Maspero M, Savenije MHF, Verhoeff JJC, Seravalli E, Išgum I, Seevinck PR, van den Berg CAT. MR-Only Brain Radiation Therapy: Dosimetric Evaluation of Synthetic CTs Generated by a Dilated Convolutional Neural Network. International Journal of Radiation Oncology*Biology*Physics. 2018;102(4):801–812. doi:10.1016/J.IJROBP.2018.05.058
6. Klein S, Staring M, Murphy K, Viergever MA, Pluim JPW. Elastix: A toolbox for intensity-based medical image registration. IEEE Transactions on Medical Imaging. 2010;29(1):196–205. doi:10.1109/TMI.2009.2035616
Figures