3845
Ferromagnetic markers for interventional MRI devices at 0.55T1NIH, Bethesda, MD, United States, 2Cook Medical, Bloomington, IN, United States
Synopsis
Interventional cardiac MRI has been hampered for decades by the lack of safe and visible devices. Guidewires (long, elongated metals) risk RF-induced heating under MR, and often incorporate ferromagnetic markers (e.g.stainless steel) that can be used for image guidance. We propose MR-guided interventions at 0.55T to avoid RF-induced heating. Here we show that at 0.55T, ferromagnetic markers maintain visibility and create identical artifacts to those observed at 1.5T. We show that using a high-performance low field MRI system may enable progress in interventional MRI due to improved device safety with retained image quality.
Introduction
The use of MRI for procedural guidance may offer advantages for tissue visualization and for radiation sparing compared to conventional X-Ray fluoroscopy-based techniques. The ability to perform invasive cardiovascular procedures under MRI guidance has been hampered for decades by the lack of safe and visible devices1. The addition of small susceptibility markers (e.g. Stainless steel or iron oxide) to devices can impart a unique imaging signature to devices2,3,4. This passive marker approach is used for both custom and commercial MRI devices. We are proposing to reduce the field strength to 0.55T, in order to reduce RF-induced heating and thus enable interventional MRI using long conductive metallic devices (e.g. guidewires, braided catheters). In this work, we sought to explore the performance of susceptibility markers for device visualization at 0.55T. We show that at 0.55T, ferromagnetic markers maintain their visibility and create an identical artifact compared to 1.5T, whereas paramagnetic materials lose conspicuity.Methods
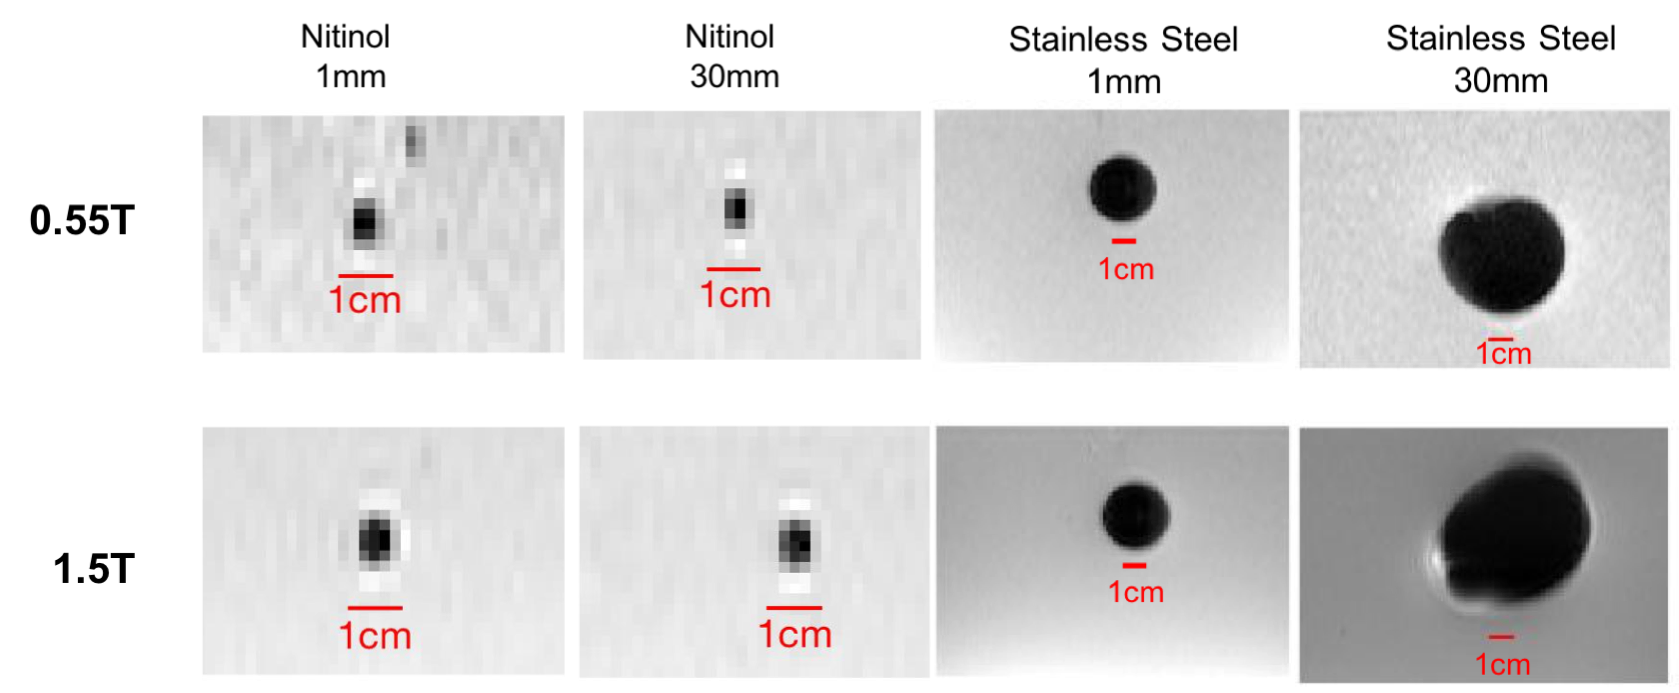
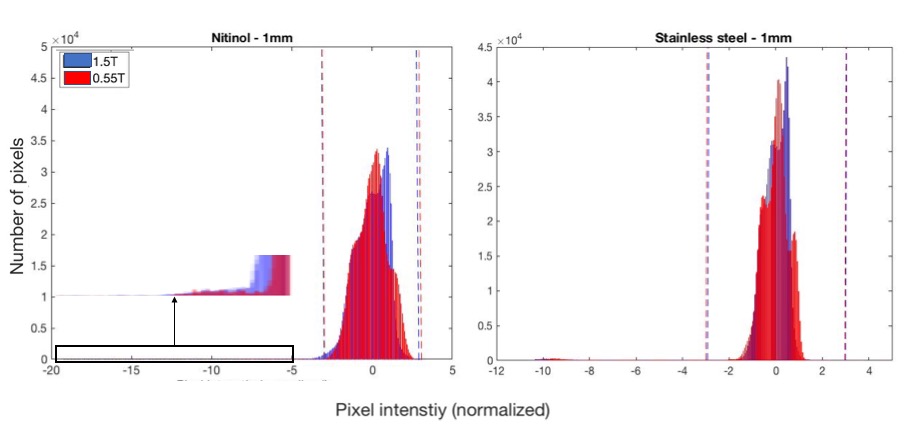
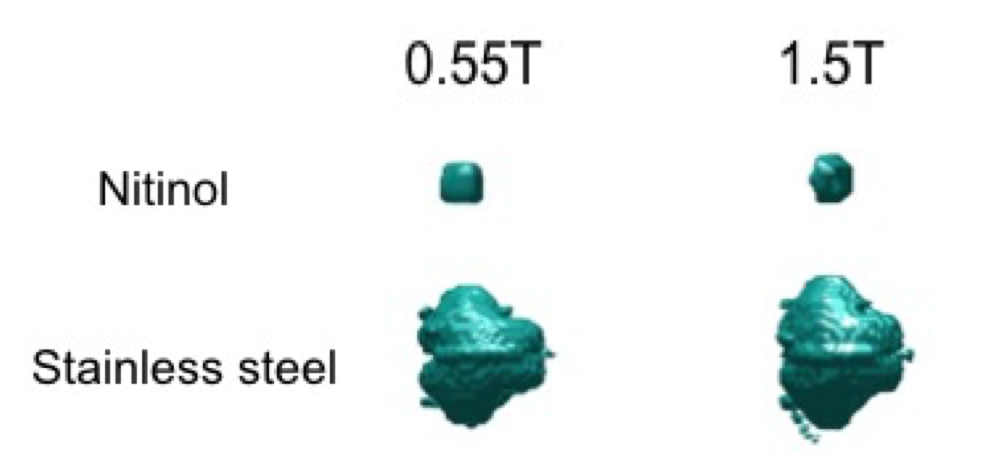
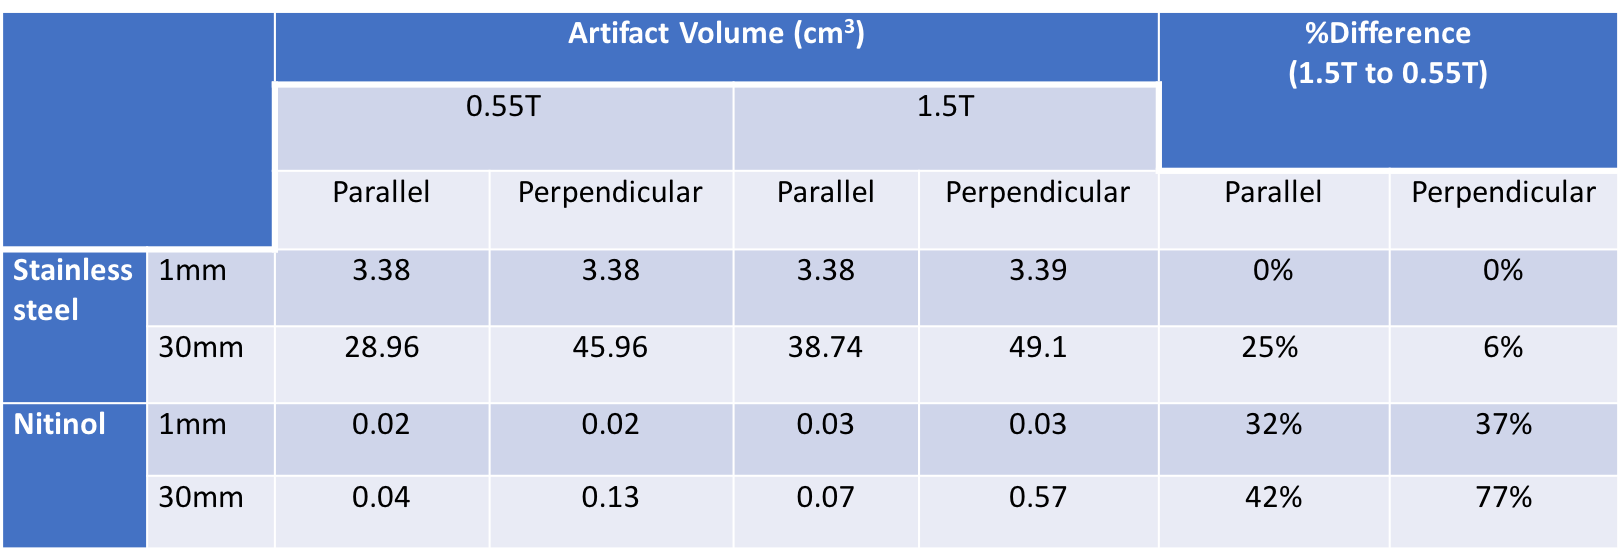
Imaging was performed at 0.55T using a modified commercial MRI system (MAGNETOM Aera, Siemens Healthcare, Erlangen, Germany) and at 1.5T (MAGNETOM Aera, Siemens Healthcare, Erlangen, Germany). Stainless steel (304) and nitinol tubes of the same dimensions were cut to 1mm and 30mm lengths and inserted in an agarose gel. Three dimensional images were acquired at 0.55T and 1.5T using identical parameters (GRE acquisition, TE/TR 3.64/102ms, flip angle = 30, FOV 120x150, isotropic imaging resolution = 0.7mm3). The images were SNR-matched by increasing the number of averages at 0.55T. All markers were imaged at parallel and perpendicular orientations to the main magnetic field to investigate orientation dependency of the artifact size. The artifact volume was calculated using MATLAB R2018a from a distribution of pixel intensities inside the phantom, which is approximately Gaussian for markers that produce a small artifact. Markers producing a larger artifact follow a bimodal pixel distribution (background + marker) and were separated using k-means clustering. The gradient echo artifact contains hyperintense signal caused by signal pileup in addition to the susceptibility induced signal void. Therefore, a threshold was applied to select pixels with signal ±3 standard deviations from the mean background signal. A connected region was used to isolate the marker from other signal perturbations.Results
Example slices from the 3D data set are provided in Figure 1 for 1mm stainless steel and nitinol markers at both field strengths. The resulting histogram distribution of the signal intensity for a 30mm stainless steel is provided in Figure 2, and Figure 3 provides final artifact volumes. For small (1mm) ferromagnetic stainless steel markers, such as those commonly added to interventional devices, we measured no change in artifact size between 0.55T and 1.5T (Table 1), whereas elongated (30mm) ferromagnetic samples do show a field strength dependence on artifact size. By comparison, there was an observable field strength dependence for paramagnetic materials (nitinol), even for small (1mm) markers.As expected, there was negligible orientation dependency on artifact size for 1mm markers, regardless of material. Conversely, elongated markers showed a dependency on orientation; ferromagnetic markers less so than paramagnetic counterparts (Table 1).Discussion
The finding that artifact size from stainless steel markers is independent of field strength is counterintuitive. Because susceptibility scales linearly with field strength, it is generally assumed that all metal artifact sizes do too5. The discrepancies between ferro- and paramagnetic materials arise from the differing saturation magnetization values of the two materials6,7. Stainless steel, a ferromagnetic material, is saturated at both field strengths, therefore the differences in artifact size is negligible and not linearly proportional to field strength. Nitinol devices, such as guidewires, may be less visible at lower field strengths. Importantly, for researchers and device manufactures developing MRI devices with ferromagnetic markers, the same markers can be used across 0.55T and 1.5T.Conclusion
We show that ferromagnetic materials, such as those used as passive markers, retain their conspicuity at 0.55T. A high-performance low field MRI system may enable progress in interventional MRI due to improved device safety with retained image quality.Acknowledgements
This work was supported by Division of Intramural Research, National Heart, Lung, and Blood Institute, National Institutes of Health (Z1A-HL006213, Z1A-HL006214, Z01-HL005062 and Z01-HL006039).References
1. Rogers T, Ratnayaka K, Lederman RJ. MRI catheterization in cardiopulmonary disease. Chest. 2014;145(1):30–6.
2. Basar B, Rogers T, Ratnayaka K, Campbell-Washburn AE, Mazal JR, Schenke WH, et al. Segmented nitinol guidewires with stiffness-matched connectors for cardiovascular magnetic resonance catheterization: preserved mechanical performance and freedom from heating. J Cardiovasc Magn Reson. 2015;17:105.
3. Pushparajah, K, Chubb H, Razavi R. MR-guided cardiac interventions. Top Magn Reson Imaging. 2018 Jun;27(3):115-128.
4. Sommer P, Grothoff M, Eitel C, Gaspar T, Piorkowski C, Gutberlet M, Hindricks G. Feasibility of real-time magnetic resonance imaging-guided electrophysiology studies in humans. Europace. 2013 Jan;15(1):101-8.
5. Dietrich O, Reiser M.F., Schoenberg, S.O. Artifacts in 3-t mri: physical background and reduction strategies. Eur J Radiol. 2008;65(1):29-35.
6. Jiles DC, Atherton D.L. Theory of ferromagnetic hysteresis. Journal of Magnetism and Magnetic Materials. 1986;61:48-60.
7.Kittel C. Physical Theory of Ferromagnetic Domains. Rev. Mod. Phys. 1949;21, 541
Figures