3564
Investigating the Benefits of Incorporating Higher Order Spherical Harmonics in Axon Diameter Measurements1Radiology, Massachusetts General Hospital, Charlestown, MA, United States, 2Harvard Medical School, Boston, MA, United States, 3Harvard-MIT Division of Health Sciences and Technology, Massachusetts Institute of Technology, Cambridge, MA, United States
Synopsis
Separating out the scalar and orientation-dependent components of the diffusion MRI signal offers the possibility of increasing sensitivity to microscopic tissue features unconfounded by the fiber orientation. Recent approaches to estimating apparent axon diameter in white matter have employed spherical averaging to avoid the confounding effects of fiber crossings and dispersion at the expense of losing sensitivity to effective compartment size. Here, we investigate the feasibility and benefits of incorporating higher-order spherical harmonic (SH) components into a rotationally invariant axon diameter estimation framework and demonstrate improved precision of axon diameter estimation in the in vivo human brain.
Introduction
Approaches for estimating microstructural tissue properties by diffusion MRI have evolved over the past decade, with increasing recognition that the scalar parameters describing biophysical features of tissue, e.g., volume fraction, diffusivity, and effective compartment size, and the orientation-dependent parameters describing the fiber orientation distribution function, carry separate and complementary information 1-6. Recent approaches to estimating apparent axon diameter in white matter using high b-value data have employed spherical averaging to avoid the confounding effects of fiber crossings and orientation dispersion 7,16. While spherical averaging enables estimation of biophysical parameters independent of crossing fibers, averaging the diffusion MRI signal over all directions reduces sensitivity to apparent axon diameter by reducing the contribution of the signal perpendicular to the principal fiber direction. The goal of this study is to investigate the feasibility and benefits of incorporating higher-order spherical harmonic (SH) components into the axon diameter estimation framework.Theory
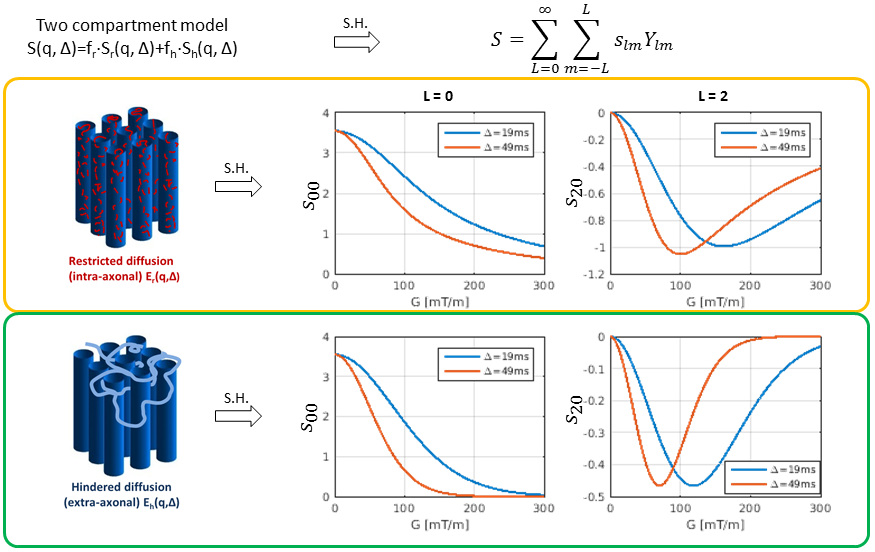
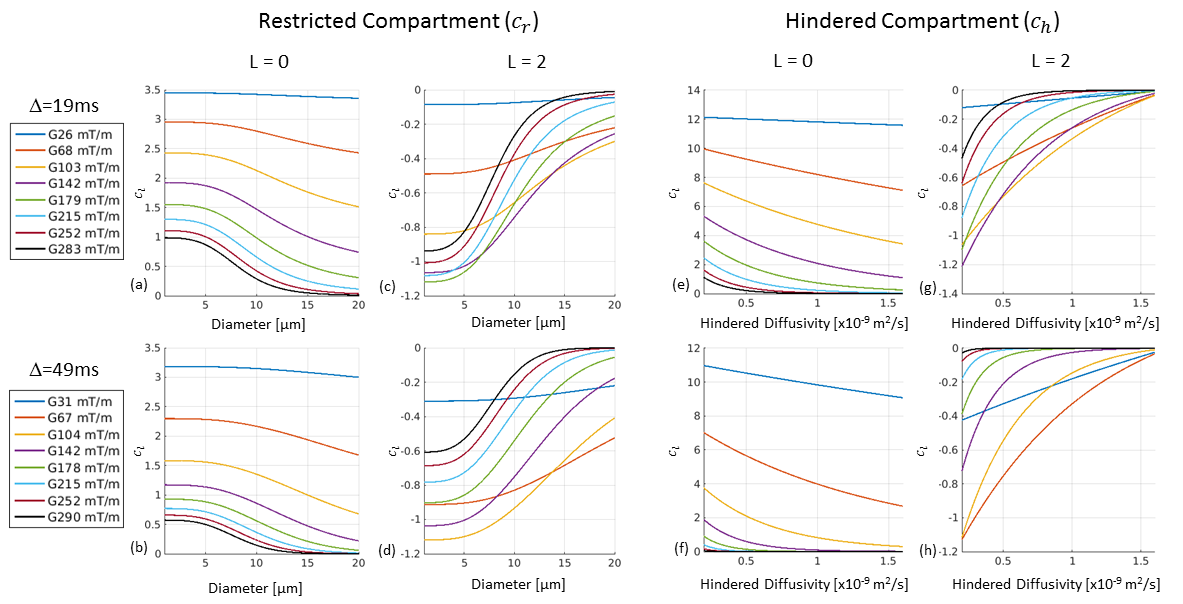
White matter is modeled as composed of two compartments: restricted diffusion in cylindrical axons modeled using the Gaussian phase distribution approximation8, and extra-axonal hindered diffusion modeled as Gaussian diffusion with parallel diffusivity of 1.7x10⁻³mm2/s. The signal was projected to the SH space (Figure 1), so that $$$s_{lm}=c_{l}\cdot p_{lm}$$$, where $$$s_{lm}$$$, $$$c_{l}$$$, and $$$p_{lm}$$$ are the SH coefficients for the diffusion signal, response kernel (Figure 2) and orientation distribution function (ODF). Then both sides of the equation were divided by a normalization factor $$$\sum_{j=1}^Ts_{lm}=\sum_{j=1}^Tc_{l}\cdot p_{lm}$$$ over all $$$T$$$ experiments, so that the $$$p_{lm}$$$ on the right side is canceled out, yielding the relationship between the normalized signal and the normalized response kernel, i.e., $$$ns_{l}$$$ = $$$nc_{l}\equiv \frac{c_{l}}{\sum_{j=1}^Tc_{l}}$$$, an ODF independent form response kernel. Specifically, $$$c_{l}=f_{r}\cdot c_{r}(a)+f_{h}\cdot c_{h}(D_{h})$$$, where $$$f_{r}+f_{h}=1$$$, $$$c_{r}$$$ is the SH representation of the van Galderen model8,9, and $$$c_{h}$$$ is the SH representation of the tensor model10.Method
A healthy subject was scanned on the 3T Connectome scanner with 300mT/m maximum gradient strength using a custom-made 64-channel head coil11. Real-valued diffusion data was acquired to avoid buildup of the noise floor12. Sagittal 2-mm isotropic resolution diffusion-weighted spin-echo EPI images were acquired with whole brain coverage. The following parameters were used: TR/TE=4000/77ms, δ=8ms, Δ=19/49ms, 8 diffusion gradient strengths linearly spaced from 30-290mT/m per Δ, 32-64 diffusion directions, parallel imaging (R=2) and simultaneous multislice (MB=2). Diffusion data were corrected for susceptibility and eddy current distortions using the TOPUP13 and EDDY14,15 tool in FSL.
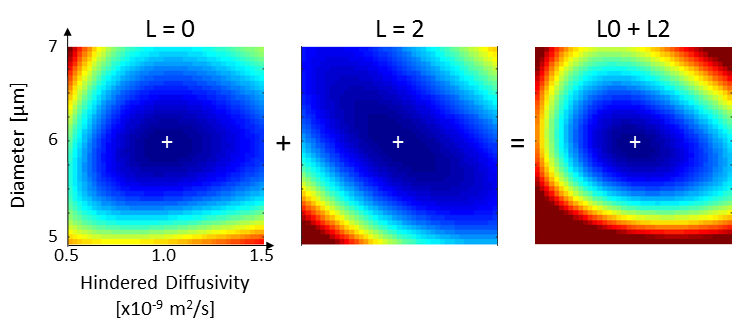
The normalized kernel $$$c_{l}$$$ was evaluated in the 3D parameter space X=(a, Dh, fr), and the best fit to the model was found by searching on the grid by minimizing the “energy” function1 (Figure 3), i.e., $$$\widetilde{x}=\arg_{x \in X} min\sum_j^T\sum_{l=-L}^L (ns_{l}-nc_{l} (x))^{2}$$$
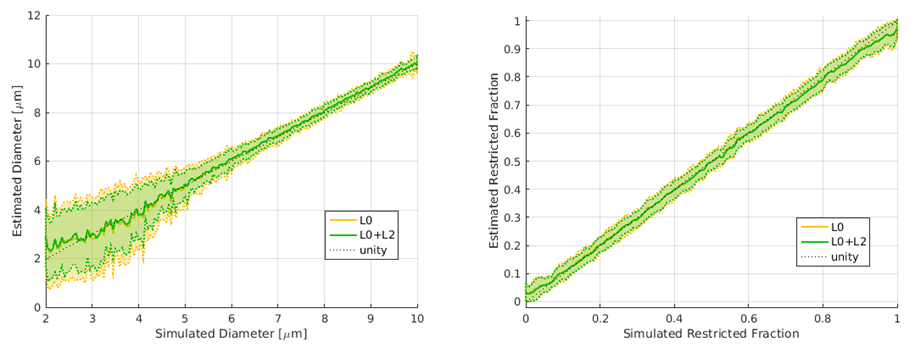
Simulation data was generated by adding 100 samples of noise at SNR=20. Voxel-wise fitting for axon diameter a, restricted fraction fr, and hindered diffusivity Dh was performed.
Results
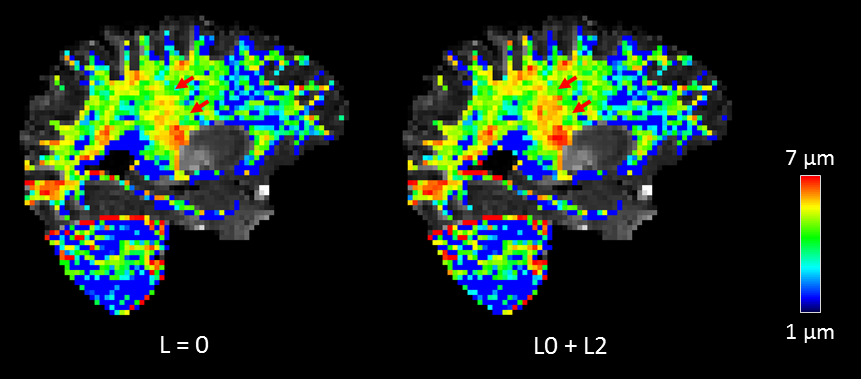
Simulation data shows that by combining L=0 and L=2 signal components, the standard deviation in axon diameter estimates decrease compared to using L=0 components alone (Figure 4). In the in vivo data, the feature of larger apparent axon diameter is more pronounced in the corticospinal tract in the L0+L2 representation by incorporating higher-order SH components (Figure 5).Discussion
We propose a method for measurement of compartment size and volume fraction by supplementing spherical averaging with higher-order SH components. While spherical averaging is robust to fiber crossings and image noise, only 0th order signal components were used with higher frequency signal components being wasted. Similar approaches have been pursued previously to make use of the additional information available in multi-shell data 1,3. Our results indicate that it is feasible to incorporate the higher-order SH in measuring compartment size by transforming the signal equation into an ODF invariant form. This approach can be applied to whole brain analyses, with the potential to improve the precision of axon diameter estimates.Acknowledgements
This work was funded by an NIH Blueprint for Neuroscience Research Grant: U01MH093765, as well as NIH funding from NCRR P41EB015896, NIBIB R01EB006847, NIBIB R00EB015445, NINDS K23NS096056, NINDS K23NS078044, NIH/NCRR/NIBIB P41EB015896 and Instrumentation Grants S10-RR023401, S10-RR023043, and S10-RR019307. Funding support was also received from the National Multiple Sclerosis Society, the American Heart Association Postdoctoral Fellowship Award (17POST33670452), a Radiological Sciences of North America Research Resident Grant, the Conrad N. Hilton Foundation and the MGH Executive Committee on Research Fund for Medical Discovery Fellowship Award.References
1. Novikov, D.S., Veraart, J., Jelescu, I.O. & Fieremans, E. Rotationally-invariant mapping of scalar and orientational metrics of neuronal microstructure with diffusion MRI. NeuroImage 174, 518-538 (2018).
2. Veraart, J., Fieremans, E. & Novikov, D. Quantifying neuronal microstructure integrity with TE dependent Diffusion Imaging (TEdDI) in Proc. ISMRM, Vol. 0836 (Honolulu, HI, USA, 2017).
3. Reisert, M., Kellner, E., Dhital, B., Hennig, J. & Kiselev, V.G. Disentangling micro from mesostructure by diffusion MRI: A Bayesian approach. NeuroImage 147, 964-975 (2017).
4. Kaden, E., Kelm, N.D., Carson, R.P., Does, M.D. & Alexander, D.C. Multi-compartment microscopic diffusion imaging. Neuroimage 139, 346-359 (2016).
5. Kaden, E., Kruggel, F. & Alexander, D.C. Quantitative mapping of the per-axon diffusion coefficients in brain white matter. Magn Reson Med 75, 1752-1763 (2016).
6. Jespersen, S.N., et al. Neurite density from magnetic resonance diffusion measurements at ultrahigh field: Comparison with light microscopy and electron microscopy. NeuroImage 49, 205-216 (2010).
7. Fan, Q., et al. Axon Diameter Mapping Independent of Crossing Structures using Spherical Mean Technique. in Proc. ISMRM 5244 (Paris, France, 2018).
8. van Gelderen, P., Moonen, C.T. & Duyn, J.H. Susceptibility insensitive single shot MRI combining BURST and multiple spin echoes. Magn Reson Med 33, 439-442 (1995).
9. Panagiotaki, E., et al. Compartment models of the diffusion MR signal in brain white matter: a taxonomy and comparison. Neuroimage 59, 2241-2254 (2012).
10. Anderson, A.W. Measurement of fiber orientation distributions using high angular resolution diffusion imaging. Magn Reson Med 54, 1194-1206 (2005).
11. Setsompop, K., et al. Pushing the limits of in vivo diffusion MRI for the Human Connectome Project. NeuroImage 80, 220-233 (2013).
12. Eichner, C., et al. Real diffusion-weighted MRI enabling true signal averaging and increased diffusion contrast. Neuroimage 122, 373-384 (2015).
13. Andersson, J.L., Skare, S. & Ashburner, J. How to correct susceptibility distortions in spin-echo echo-planar images: application to diffusion tensor imaging. Neuroimage 20, 870-888 (2003).
14. Andersson, J.L. & Sotiropoulos, S.N. An integrated approach to correction for off-resonance effects and subject movement in diffusion MR imaging. NeuroImage 125, 1063-1078 (2016).
15. Andersson, J.L.R., Graham, M.S., Zsoldos, E. & Sotiropoulos, S.N. Incorporating outlier detection and replacement into a non-parametric framework for movement and distortion correction of diffusion MR images. NeuroImage 141, 556-572 (2016).
16. Veraart J, Fieremans E, Novikov DS. On the scaling behavior of water diffusion in human brain white matter. NeuroImage. 2018 Oct 4;185:379-87.
Figures