3534
Comparison and Assessment of IVIM-MRI Methods Using a Capillary Flow Phantom1Department of Radiology, LMU University of Munich, Munich, Germany, 2Comprehensive Pneumology Center, German Center for Lung Research, Munich, Germany
Synopsis
In this study different intravoxel incoherent motion (IVIM) MRI methods were assessed and compared using phantom measurement. The phantom was constructed to mimic a capillary bed and allowed for the controlled application of fluid flow at varying rates. Advanced IVIM MRI methods beyond the biexponential pseudo-diffusion model were shown to be capable of accurately characterizing fluid flow inside a capillary network yielding intuitive parameters in a reproducible manner.
Introduction
Intravoxel incoherent motion imaging (IVIM)1 allows to assess capillary perfusion non-invasively using diffusion-weighted MRI. IVIM-MRI data is commonly analyzed using the biexponential pseudo-diffusion model2 yielding the tissue diffusivity $$$D$$$, the fraction $$$f$$$ of signal attributed to blood in perfused capillaries and the pseudo-diffusion coefficient $$$D^\ast$$$. Recently, a "phase-distribution" approach based on the simulation of particle pathways while considering a distribution of particle speeds was presented3. In place of $$$D^\ast$$$, this method yields the (average) particle flow speed $$$v$$$, the time $$$t$$$ until a particle changes its movement direction and also the length of a capillary segment via $$$l=vt$$$. However, the in-vivo validation of IVIM-MRI methods is inherently difficult. Measures such as the blood flow velocity and the capillary length are challenging to determine in vivo and they cannot easily be regulated. Therefore, the purpose of this study is the systematic analysis of IVIM MRI methods using a perfusable capillary phantom.Methods
As previously described4,5, a perfusable capillary phantom designed to mimic fluid flow inside a interconnected network of randomly oriented channels was constructed using sacrificial sugar fibers embedded in synthetic resin. The capillary network was characterized using optical microscopy. The phantom allowed for the application of controlled fluid flow at variable rates while performing IVIM-MRI experiments on a 3 T whole-body MRI system (Skyra, Siemens Healthcare, Erlangen, Germany). For each flow rate (ranging from 0.2 ml/min to 2.4 ml/min), data was acquired using four different single shot EPI DW-MRI sequences (two with monopolar diffusion gradient schemes and two with flow-compensated schemes of varying diffusion preparation duration) with up to 16 b-values between 0 and 800s/mm². Signal intensities were averaged over a region of interest covering the capillary network and subsequently analyzed using the phase-distribution model as well as the biexponential pseudo-diffusion model (only the data from one sequence with monopolar gradients was used for the biexponential model). For the biexponential model, $$$v$$$ was calculated via6 $$$v=6D^\ast/l$$$. The phase-distribution model accounted for a continuous particle speed distribution (derived from a Pareto distribution) based on findings7 about fluid flow in fracture networks. A second measurement series was performed on a different day to assess the reproducibility.Results
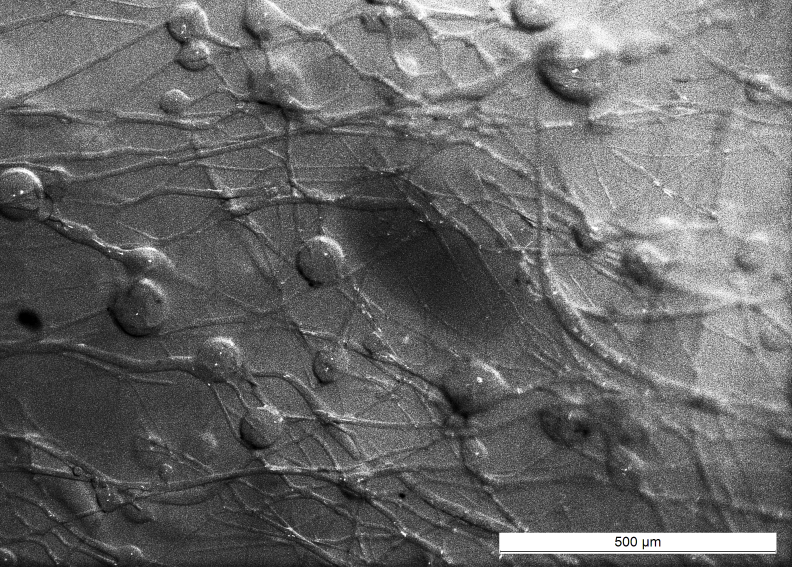
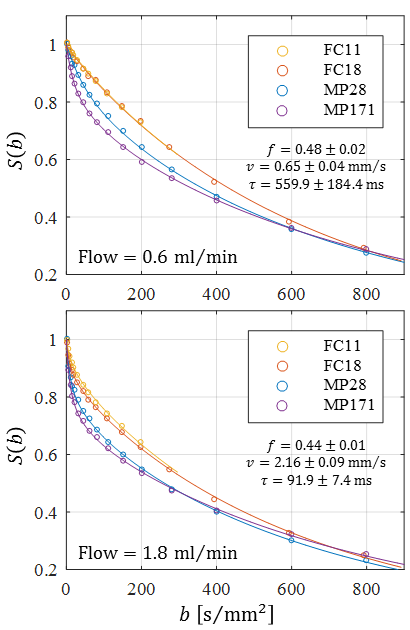
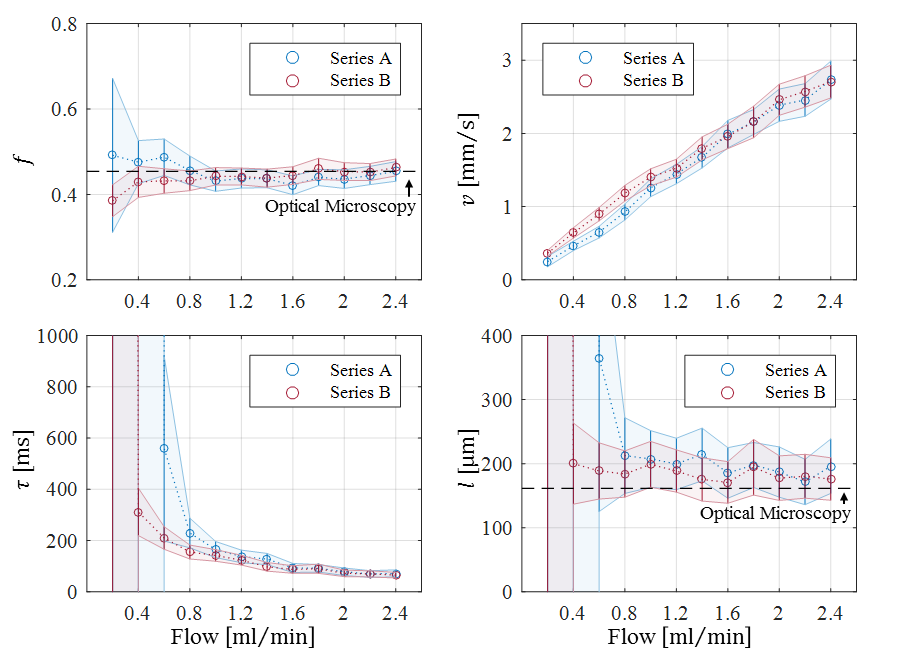
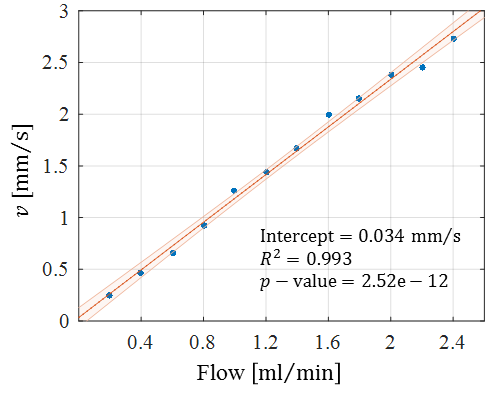
Optical microscopy revealed a dense and highly interconnected network of randomly oriented capillaries strewn with spherical dilations (Figure 1). Optical microscopy yielded the average capillary length of 162±78µm, the average capillary diameter of 11.4±4.4µm and the ratio of the volume inside the capillaries to the total (capillaries plus dilations) network volume of 0.454±0.002. The acquired data was best described by a two-compartment model consisting of a static and a flowing compartment. Exemplary fits of the phase-distribution model are illustrated in Figure 2. Figure 3 displays the estimated parameters using the phase-distribution model for both measurement series. A regression analysis of the particle speed $$$v$$$ versus the applied flow is displayed in Figure 4. Figure 5 compares the signal fraction $$$f$$$ and $$$v$$$ estimated using the phase-distribution model versus the biexponential model.Discussion
The phase-distribution model allowed for an excellent fit to the acquired data at all flow rates and yielded reasonable parameter estimates with little variation in between measurement series. The estimated signal fraction $$$f$$$ attributed to the flowing compartment stayed approximately constant over the applied flow rates and agreed well with the ratio of the volume inside the capillaries to the total (capillaries plus dilations) network volume estimated via optical microscopy. Thus, the static compartment is hypothesized to be ascribed to non-flowing liquid inside the spherical dilations. Judging from the highly significant linear proportionality, practically all variation in $$$v$$$ is predictable from the applied flow rate. At very slow flow rates, the characteristic duration $$$t$$$ until a directional change occurs could not be determined with satisfactory accuracy. At flow rates greater than 0.8ml/min, $$$t$$$ showed an inverse proportionality to the applied flow rate. Consequently, the estimated capillary segment length of about 195μm stayed approximately constant in this domain and agreed well with the value determined via optical microscopy. Using the biexponential model, the signal fraction $$$f$$$ was heavily underestimated and displayed a strong dependence on the applied flow rate. Yet, the estimated particle speed closely followed the particle speed determined using the phase-distribution model.Clonclusion
The constructed phantom facilitated the detailed investigation of IVIM-MRI methods. The results demonstrate that the advanced phase-distribution method is capable of accurately characterizing fluid flow inside a capillary network. Parameters estimated using the conventional biexponential model, specifically the perfusion fraction $$$f$$$, were shown to be subject to a potential bias if the model assumptions are not met by the underlying flow pattern.Acknowledgements
No acknowledgement found.References
1. Le Bihan D, Breton E, Lallemand D, Grenier P, Cabanis E, Laval-Jeantet M. MR imaging of intravoxel incoherent motions: application to diffusion and perfusion in neurologic disorders. Radiology. 1986;161(2):401-407. doi:10.1148/radiology.161.2.3763909
2. Le Bihan D, Breton E, Lallemand D, Aubin ML, Vignaud J, Laval-Jeantet M. Separation of diffusion and perfusion in intravoxel incoherent motion MR imaging. Radiology. 1988;168(2):497-505. doi:10.1148/radiology.168.2.3393671
3. Wetscherek, A., Stieltjes, B. & Laun, F. B. Flow-compensated intravoxel incoherent motion diffusion imaging. Magn. Reson. Med. 74, 410–419 (2015).
4. Bellan LM, Singh SP, Henderson PW, Porri TJ, Craighead HG, Spector JA. Fabrication of an artificial 3-dimensional vascular network using sacrificial sugar structures. Soft Matter. 2009;5(7):1354. doi:10.1039/b819905a
5. Gaass T, Schneider MJ, Dietrich O, Ingrisch M, Dinkel J. Technical Note: Quantitative dynamic contrast-enhanced MRI of a 3-dimensional artificial capillary network. Med Phys. 2017;44(4):1462-1469. doi:10.1002/mp.12162
6. Bihan DL, Turner R. The capillary network: a link between ivim and classical perfusion. Magn Reson Med. 1992;27(1):171-178. doi:10.1002/mrm.1910270116
7. Frampton A, Cvetkovic V. Upscaling particle transport in discrete fracture networks: 1. Nonreactive tracers. Water Resour Res. 2007;43(10):W10428. doi:10.1029/2006WR005334
Figures