3527
A comparative study of single shot EPI, reduced field of view EPI, PROPELLER FSE based diffusion weighted imaging in the evaluation of normal thyroid gland1The First Affiliated Hospital of Xi'an Jiaotong University, Xi'an, China, 2GE Healthcare China, Beijing, China
Synopsis
Thyroid gland diffusion images often suffer from high level of image distortion due to poor magnetic filed homogeneity. We evaluated the image quality and compared apparent diffusion coefficient (ADC) of healthy thyroid gland using EPI DWI, rFOV DWI and PROPELLER DWI images respectively. Our results indicated that the image quality of rFOV is better than that of EPI and PROPELLER DWI, while the image quality has no significant difference between EPI and PROPELLER DWI. Moreover, there was no significant difference in ADC value between EPI and rFOV DWI images, while the ADC value of PROPELLER EPI was significantly higher.
Introduction
Imaging of thyroid gland faces a several practical challenges, a predominant difficulty is the field inhomogeneity that may render imaging quality. Single shot EPI based DWI is the most commonly used diffusion imaging, however features intrinsically high level of image distortion. Reduced field of view (rFOV) and Periodically Rotated Overlapping ParallEL Lines with Enhanced Reconstruction (PROPELLER) FSE based DWI were developed to improve the DWI image quality. In the work, the image quality and ADC value between rFOV,PROPELLER and EPI DWI images are investigated, aiming at exploring a superior DWI imaging sequence for the thyroid gland.
Method
Ten healthy volunteers were recruited for GE Discovery 750W magnetic resonance imaging using 8 channels special coil for thyroid gland. Ethical approval and consent forms were obtained prior to the study. All subjects underwent MR exams consisted of the following sequences: (1) 2D PROPELLER T2-weighted sequence (TR/TE, 3000ms/69ms; matrix, 320×320; section-thickness,5mm; FOV, 200 x 200mm,); (2) EPI DWI sequence: (TR/TE, 3000ms/ minimum; acquisition matrix, 160×160; section-thickness,5mm; FOV, 200 x 200mm, NEX 8); (3) rFOV DWI: (TR/TE, 3000ms/ minimum ; matrix, 160×160; section-thickness,5mm; FOV, 200 x 60mm, NEX 12) PROPELLER DWI: (TR/TE, 3000ms/ 74ms ; matrix, 128×128; section-thickness,5mm; FOV, 200 x 200mm, NEX, 2). In all diffusion weighted imaging, b values of 0 and 500 were used. DWI image quality is evaluated and graded according to delineated image features by an experienced radiologist. All image analyses for ADC mapping were performed on the ADW4.6 workstation (GE Health-care). For ADC calculation, ROI (22-26 mm2) were drawn on MR images (b=500 s/mm2) in the area of thyroid tissue, areas with visible image distortion/signal loss such as air, bone and blood vessels were carefully avoided1.The left and right sides of the thyroid gland were measured three times and the average ADC value was calculated to minimize the bias. Two experienced neuroradiologists independently scored subjective image quality with double-blind method. By observing the artifacts, distortion, signal loss and detail display of the image, the overall image quality was evaluated by 5-point method. 0 points: no diagnostic value; 1 points: poor image quality. 2 points: acceptable image quality; 3 points: the image quality is good; 4 points: excellent image quality. The consistency of subjective scores between the two viewers was tested by weighted K test, and the image quality scores of the three groups were tested by Kruskal-Wallis ranked test. The difference of ADC value was analyzed by one-way ANOVA.Results
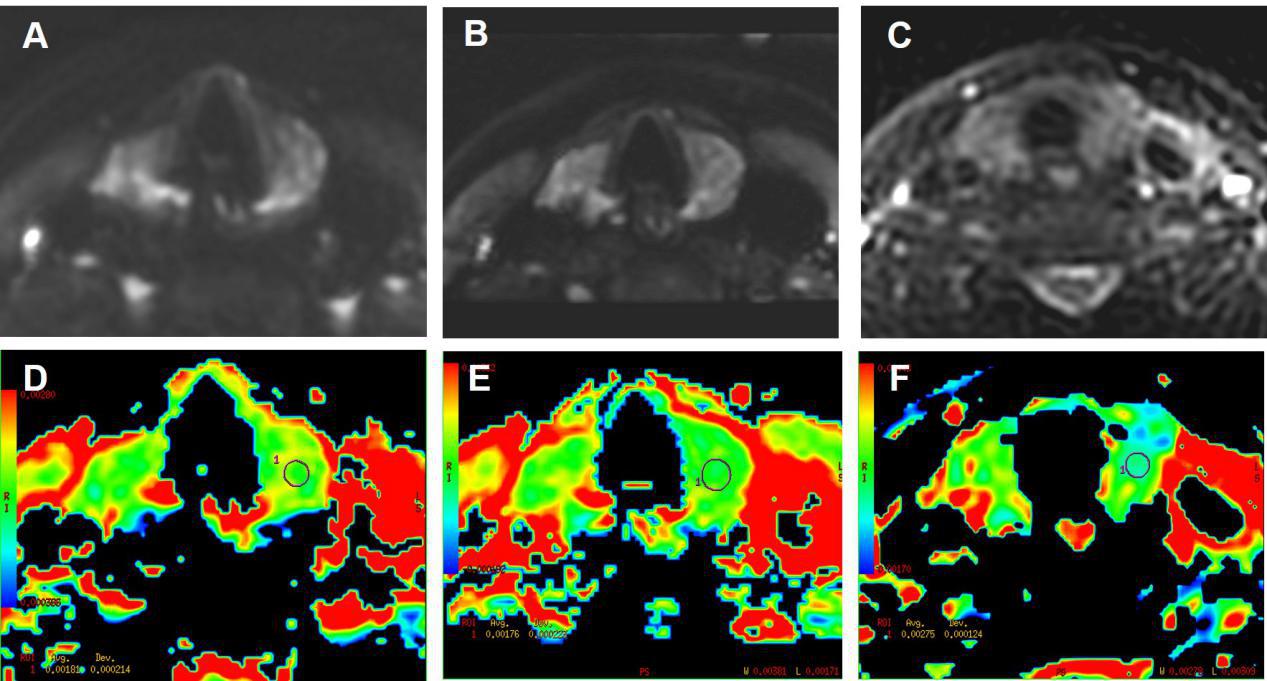
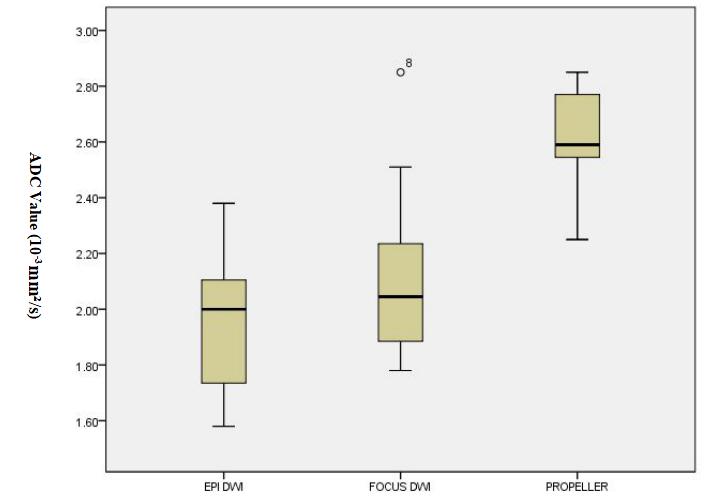
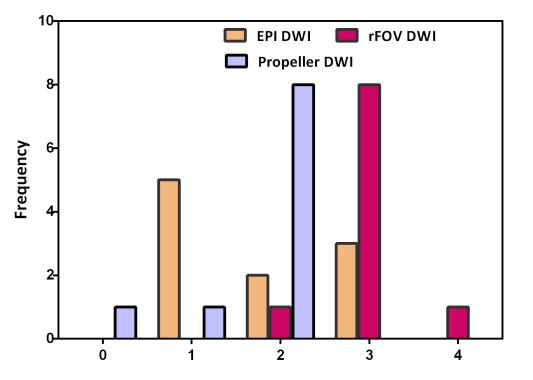
Representative images of two subjects with different strategies are shown in Figure 1 respectively. There was no significant difference in ADC values between EPI DWI and rFOV DWI (p > 0.05) (Figure 2). Image scores of rFOV DWI was higher than that of EPI DWI and PROPELLER DWI (p < 0.05) (Figure 3). There was significant difference in ADC values between PROPELLER DWI , single shot EPI and rFOV DWI (p < 0.05). ADC of EPI DWI images (1.95±0.234×10⁻³ mm²/s), ADC of rFOV DWI images (2.08±0.234×10⁻³mm²/s) ADC of PROPELLER DWI images(2.62±0.155×10⁻³ mm²/s).Discussion
In this study, it was observed that rFOV DWI featured higher image quality than EPI and PROPELLER DWI in thyroid gland. There is no significant difference observed in ADC value between rFOV DWI and EPI DWI, while there was statistical difference between rFOV DWI and PROPELLER DWI. Despite different acquisition strategies, similar scan time was maintained for the three sequences in this study. Thyroid is a superficial organ, which is more suitable for small field of vision acquisition. Therefore, rFOV DWI achieves a more optimal balance between image quality and scanning time for thyroid.Conclusion
This study shows that the quality of rFOV DWI in thyroid imaging is superior than that of EPI DWI and PROPELLER DWI.According to our preliminary study, we concluded the FFOV DWI sequence can serve as a potentially superior auxiliary diagnostic tool for the thyroid gland diseases.Acknowledgements
I have no financial interests to disclose.References
1.Lu Y, Hatzoglou V, Banerjee S, et al. Repeatability Investigation of Reduced Field-of-View Diffusion-Weighted Magnetic Resonance Imaging on Thyroid Glands. J Comput Assist Tomogr, 2015, 39(3):334-339
2.Le B D, Poupon C, Amadon A, et al. Artifacts and pitfalls in diffusion MRI.Journal of Magnetic Resonance Imaging, 2010, 24(3):478-488.
3.Saritas E, Cunningham C J, Han E, et al. DWI of the spinal cord with reduced FOV single-shot EPI. Magnetic Resonance in Medicine, 2010, 60(2):468-473.
4.aritas EU,Cunningham CH,Lee JH,et a1.DWl of the spinal cord with reduced FOV single-shot EPI.Magn Reson Med,2008,60(2):468-473.5.
5. Backens M.Basic principles and technique of diffusion-weighted imaging and diffusion tensor imaging. Radiologe,2015,55(9):762—770.
Figures