3380
Toward identifying individual branches of the trigeminal nerve with dMRI-based tractography at 7 Tesla: methodological considerations1Center for Magnetic Resonance Research, University of Minnesota, Minneapolis, MN, United States, 2Department of Neurosurgery, University of Minnesota, Minneapolis, MN, United States, 3Department of Diagnostic & Biological Sciences, University of Minnesota, Minneapolis, MN, United States, 4Department of Neurology, University of Minnesota, Minneapolis, MN, United States, 5Department of Radiology, University of Minnesota, Minneapolis, MN, United States
Synopsis
Trigeminal Neuralgia is a debilitating neuropathic condition affecting the trigeminal nerve. Tractography allows for the possibility of identifying the three branches of the nerve to assist in refining the etiopathology of trigeminal neuralgia. In this study we identify methodological factors that contribute to reliability in identifying the branches of the nerve through an analysis of public HCP data and methodological experiments at 7 Tesla. We conclude that the choice of phase encoding direction can dramatically impact the fidelity of cranial nerve tractography results, and that spatial resolution plays an important role in CN-V branch identification.
Introduction
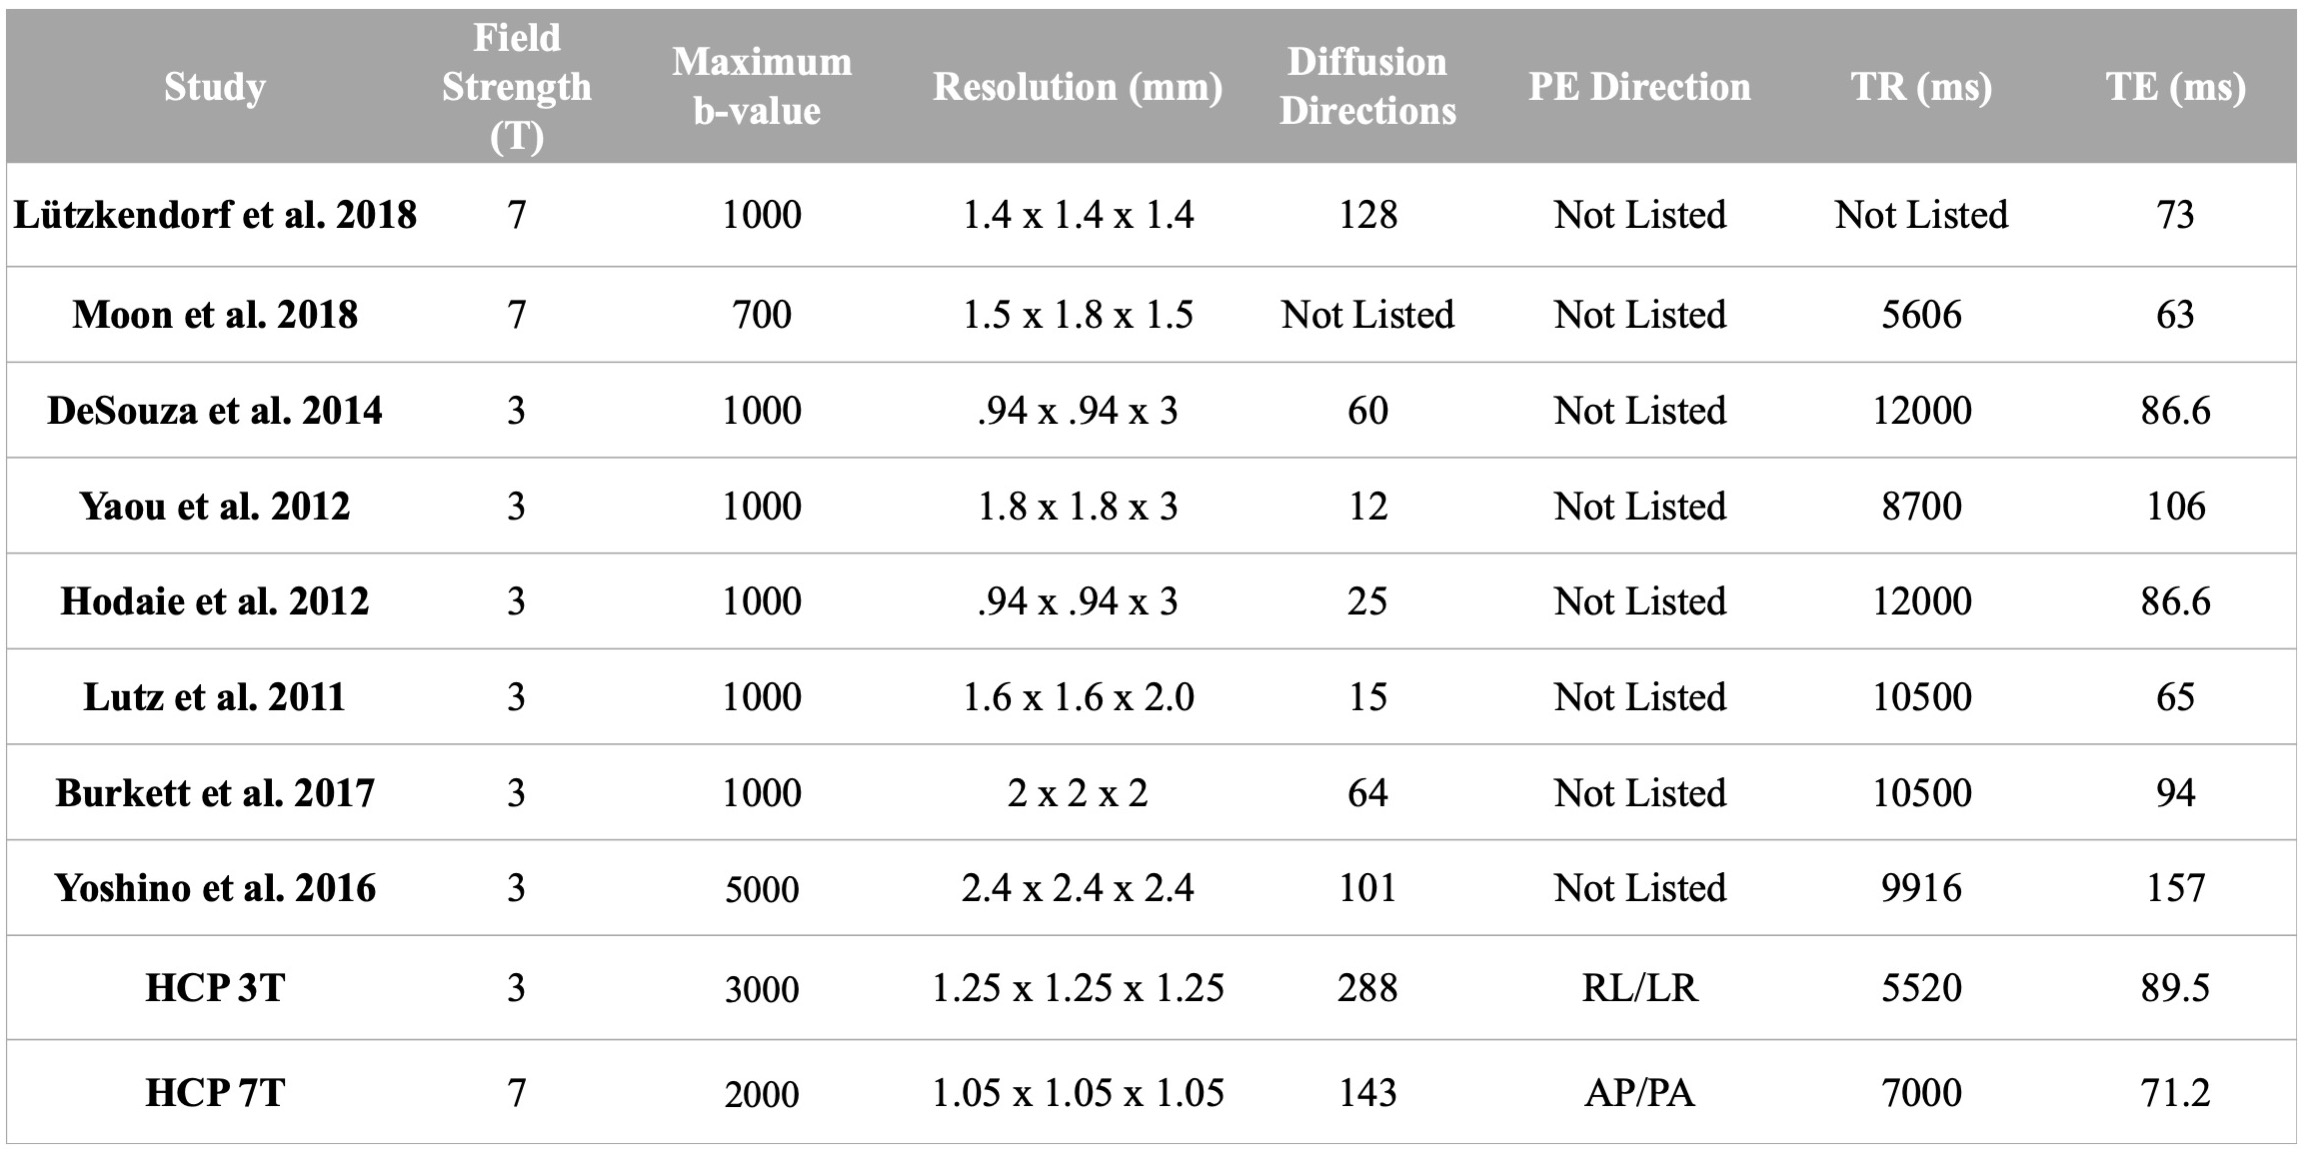
Still poorly understood, the etiopathogenesis of Trigeminal Neuralgia (TN), an extremely painful neuropathic condition, may involve neurovascular conflict secondary to adjacent vessel pulsatile motion, induced nerve damage, demyelination, and/or microstructural changes.1 Contradictory reports suggest that it is not clear whether affected facial regions are co-localized with individual nerve branch alterations and/or vascular contact, and a literature survey (table 1) shows large acquisition variations between studies targeting the trigeminal nerve (CN-V) with DTI-based tractography at 3T or 7T. Only one of these studies (Yoshino et al. 2016) claimed to be able to identify CN-V branches consistently.2
Imaging small skull base neurovascular structures requires high spatial resolution, which could benefit from the higher SNR offered at 7T. However, diffusion MRI (dMRI) at 7T suffers from shortened T2 and ΔB0 induced distortions. Recent advances in acquisition protocol and distortion corrections at 3T and 7T with the Human Connectome Project (HCP) have demonstrated specific advantages of 7T dMRI, including increased spatial resolution.3 Our previous work demonstrated the feasibility of tractography and extraction of DTI metrics for the branches of CN-V,4 but difficulties achieving this result consistently make it challenging to apply to a patient population.
In this study, we aim to identify acquisition factors that increase the reliability of CN-V branch tractography in TN patients. To understand the factors that contribute to robustness in identification of these branches, we evaluated the 3T and 7T whole brain HCP dMRI (public database) in the depiction of CN-V and we also performed additional acquisitions at 7T to test methodological hypotheses.
Methods
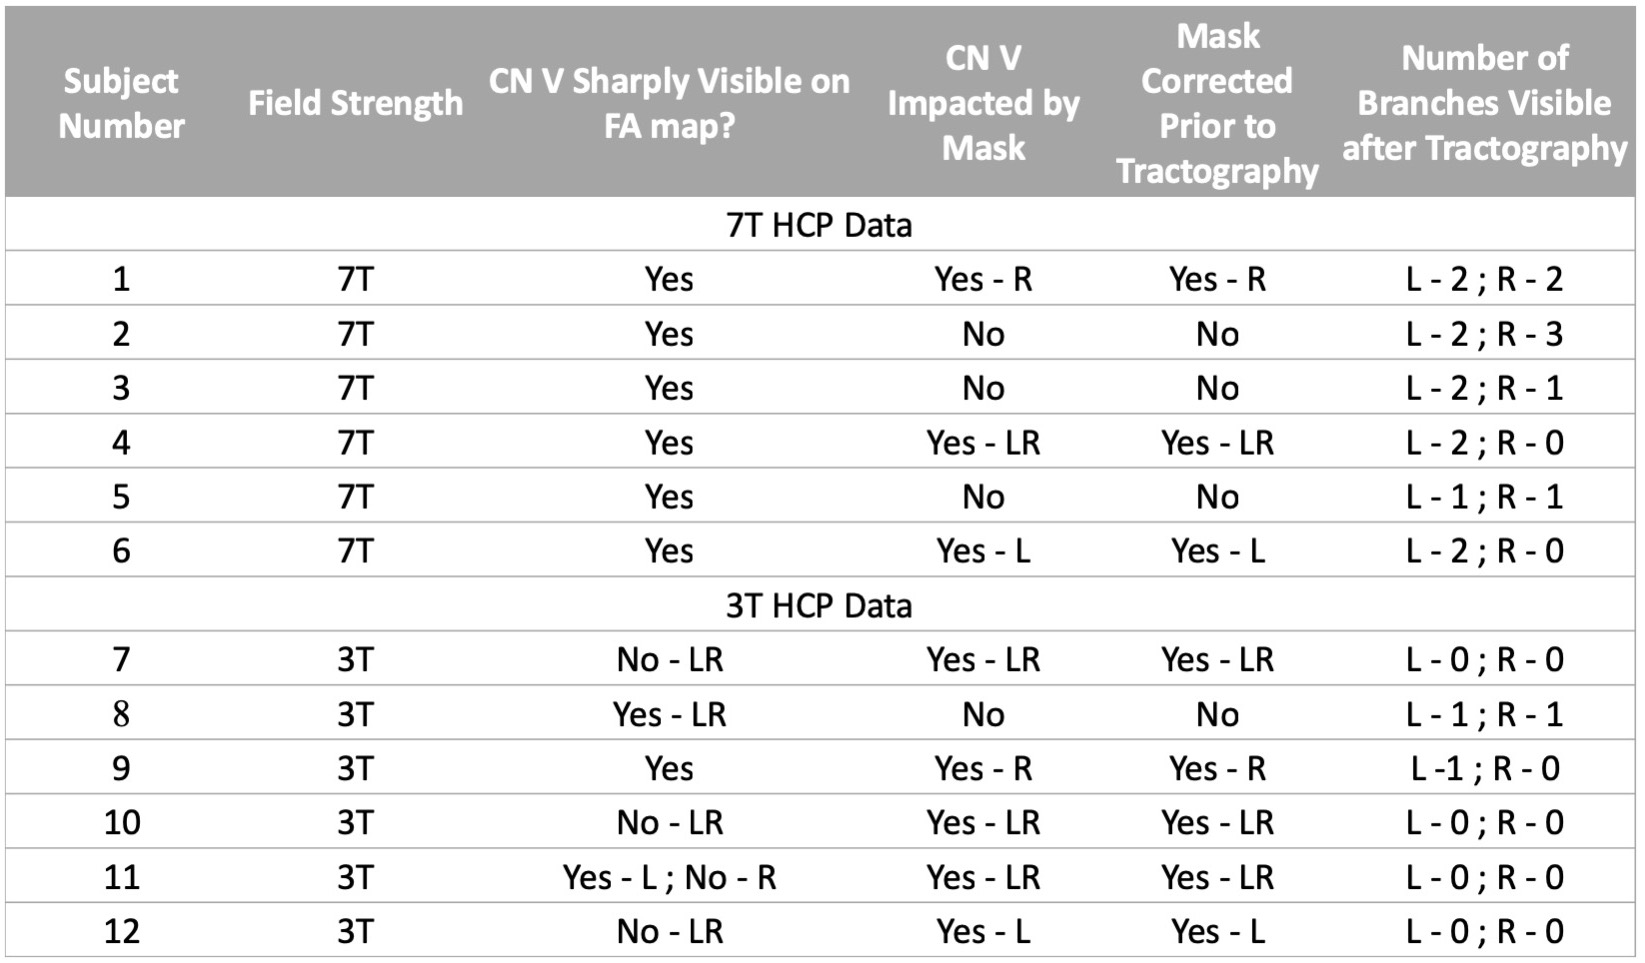
dMRI analysis: Public HCP dMRI datasets at 3T (6 subjects, un-preprocessed) and 7T (6 subjects, preprocessed) were downloaded. The standard HCP preprocessing pipeline was applied to the unpreprocessed 3T data.5 Diffusion tensors and fiber orientations were analyzed in FSL.6 Probabilistic tractography seeds were placed near the mid-cisternal point of CN-V and the number of CN-V branches tracked was noted.
7T acquisitions: HCP-style dMRI was acquired on a 7T Siemens scanner with a 32-channel coil (Nova Medical, Boston MA) with TR/TE=7000/71.2 ms, 1.05-mm isotropic resolution, Multiband=2, GRAPPA=3, Partial-Fourier 6/8, FA=90º. In two subjects, a first dataset was obtained with PE along LR/RL, followed by a second dataset with PE along AP/PA. In two other subjects, with PE = AP/PA spatial resolution was increased to 0.9-mm isotropic with TR/TE=5000/72.9 ms, Multiband=2, GRAPPA=3, Partial-Fourier 6/8, FA=90º. The same preprocessing and data analysis methods used with the downloaded data were applied.
Results
HCP datasets: Despite the inherent challenges faced at 7T, CN V branches were more often identified at 7T than at 3T (table 2). In FA maps, CN-V was more readily identified at 7T than 3T, where CN-V was consistently found blurred and truncated. Despite EPI distortion corrections, CN-V, which predominantly runs anteroposterior, was subjected to dramatic EPI distortions at 3T (PE=LR/RL). At 7T and PE = AP/PA, the geometry of the nerve was preserved. Such effect has been documented in cortical tracts,7 and likely exaggerated here in CN-V.
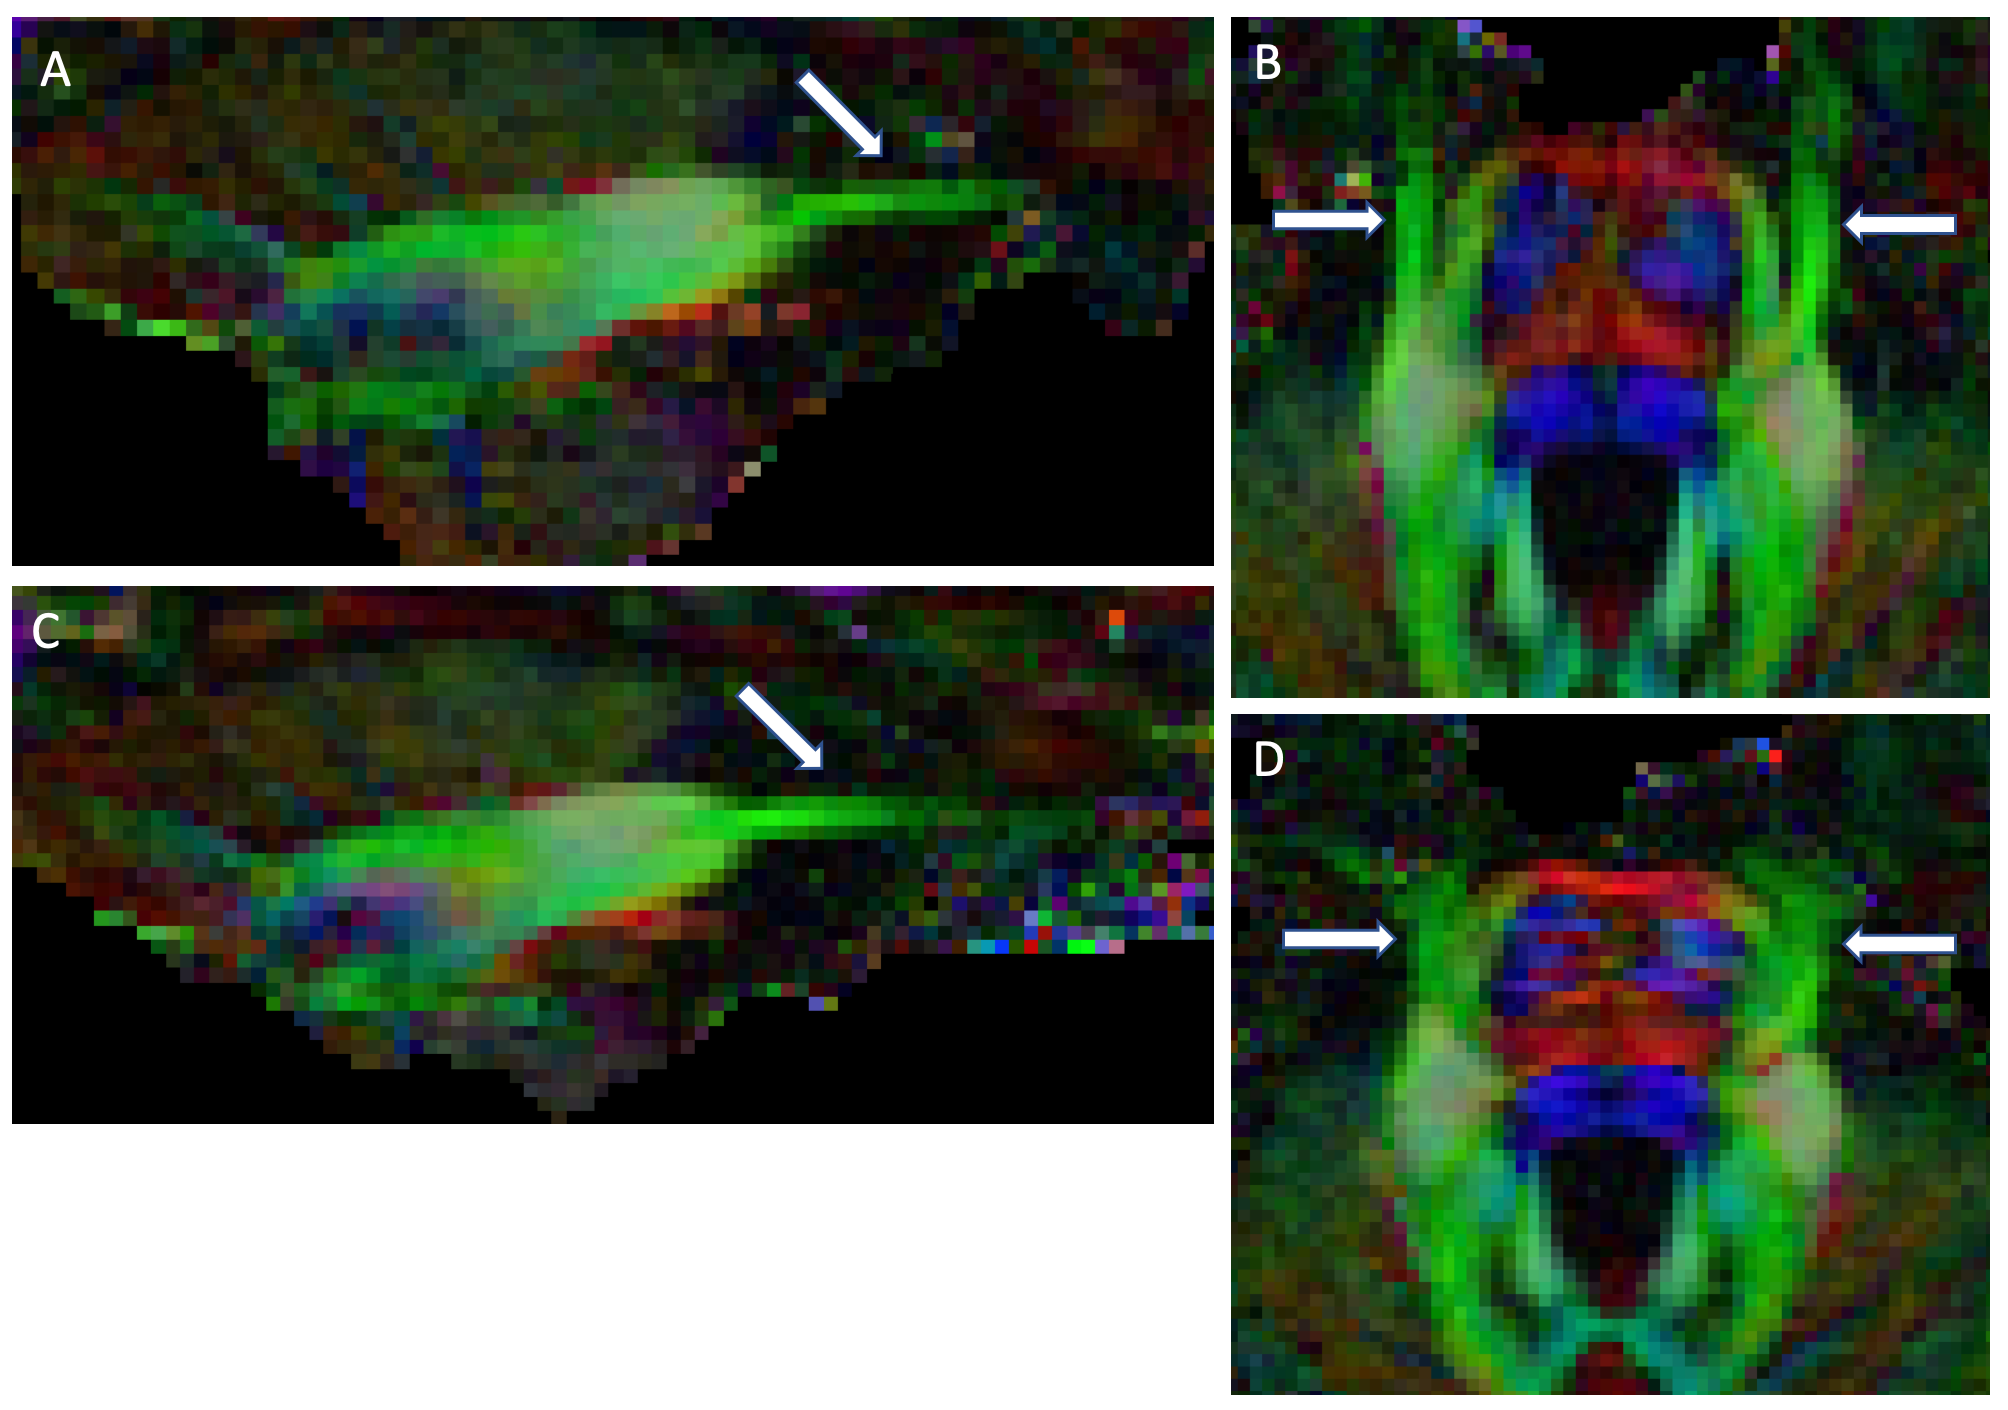
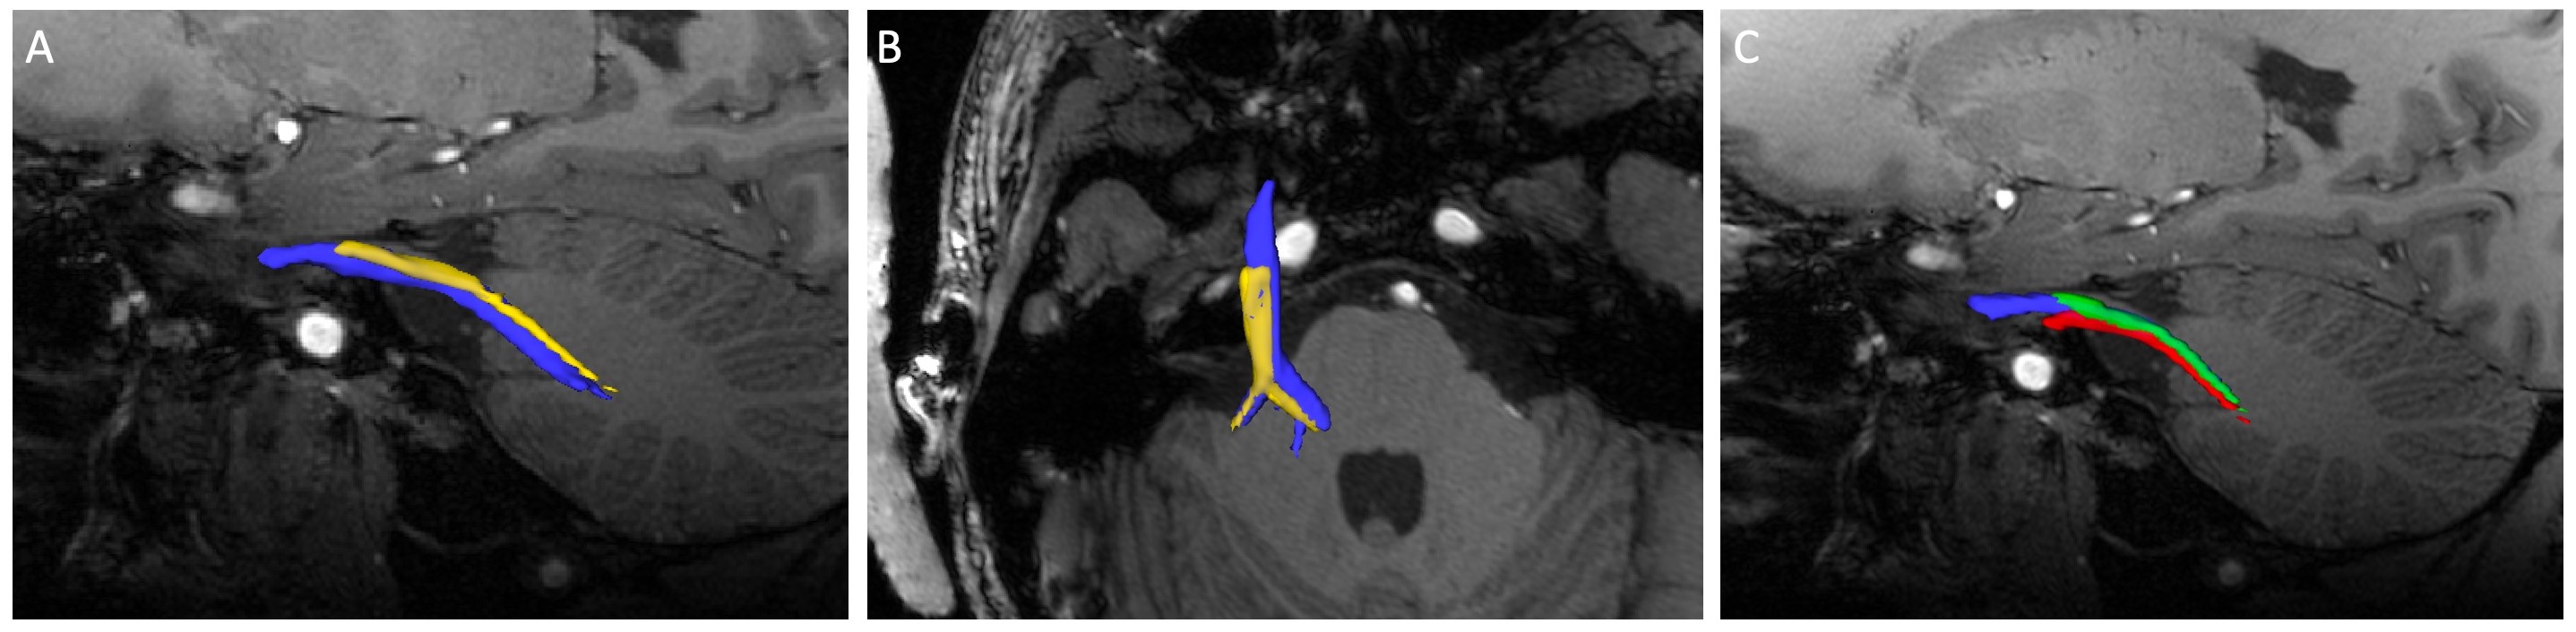
7T acquisitions: 7T datasets at 1.05-mm resolution acquired with PE=AP/PA and PE=LR/RL in the same subject demonstrate the dramatic impact of PE on CN-V detection (figure 1, 2). CN-V is clearly visible with PE=AP/PA, and is blurred and truncated with PE=LR/RL. In higher resolution data (0.9-mm isotropic), CN-V could still be identified with some branches but the branches did not extend as far as in lower resolution because of excessive noise assessed visually.
Discussion and Conclusion
Despite the challenges of dMRI near the skull base at 7T, it is remarkable that tractography of CN-V with successful distinctions of individual divisions has mostly been observed at 7T. Considering the diameter of CN-V (about 2-3 mm), it seems likely that higher spatial resolutions possible at 7T are necessary to resolve these divisions. Another critical methodological factor is the choice of PE direction. Our results at 7T clearly indicate that the impact on cranial nerve tractography with PE=LR/RL is too severe to be corrected for by dual PE polarity acquisition/reconstruction strategies in SE-EPI dMRI. We assume this factor contributes to the low success in identifying branches in downloaded HCP 3T datasets - despite state-of-the-art data quality. Our initial attempt to push spatial resolution was complicated by excessive noise; however, further work will determine whether noise reduction strategies may help to recover tractography information in the branches. The promising results obtained at 7T provide a strong basis to implement additional resources that will increase reliability of dMRI-based fibertracking of CN-V in TN patients at ultra high field, including reduced excitation FOV and B0 shimming strategies in the skull base.Acknowledgements
This work is supported by NIH grants P41 EB015894, P30 NS076408. Data were provided [in part] by the Human Connectome Project, WU-Minn Consortium (Principal Investigators: David Van Essen and Kamil Ugurbil; 1U54MH091657) funded by the 16 NIH Institutes and Centers that support the NIH Blueprint for Neuroscience Research; and by the McDonnell Center for Systems Neuroscience at Washington University.References
1. Bathla, G., and A.N. Hegde. The Trigeminal Nerve: An Illustrated Review of Its Imaging Anatomy and Pathology. Clinical Radiology 2013;68(2):203–13.
2. Yoshino, M., et al. Visualization of Cranial Nerves Using High-Definition Fiber Tractography, Neurosurgery 2016;79(1):146–165,
3. Vu A.T., Auerbach E., et al. High resolution whole brain diffusion imaging at 7T for the Human Connectome Project. NeuroImage 2015;122:318-331.
4. Lenglet C., et al. Tractography of the trigeminal nerve using 7T MRI. ISMRM 2014.
5. Glasser, M. F., et al. The Minimal Preprocessing Pipelines for the Human Connectome Project. NeuroImage 2013;80:105–24.
6. Behrens, T.E.J., et al. Probabilistic Diffusion Tractography with Multiple Fibre Orientations: What Can We Gain? NeuroImage 2007;34(1):144–55.
7. Irfanoglu, M., et al. Effects of Image Distortions Originating from Susceptibility Variations and Concomitant Fields on Diffusion MRI Tractography Results. NeuroImage 2012;61(1):275–88.
Figures