3129
The gray matter volume and shape abnormal in angelman syndromes1Institute of Science and Technology for Brain-Inspired Intelligence, Fudan University, shanghai, China, 2Neurology Department, Children's Hospital of Fudan University, shanghai, China, 3Duke Institute for Brain Science, Duke University, Durham, NC, United States
Synopsis
The angelman syndromes is a neurogenetic disease and clinically characterized by the developmental delay, movement or balance disorder, seizures, and frequent smiling. Our study compare the alteration of gray matter volume and shape between angelman syndromes and healthy controls
Introduction
The angelman syndromes is a neurogenetic disease and clinically characterized by the developmental delay, movement or balance disorder, seizures, and frequent smiling. AS was caused by the abnormal expression of ubiquitin protein ligase E3A (UBE3A) which located at 15q11-q13 and contain 4 genotypes: novo maternal deletions at 15q11-q13 (75%), uniparental disomy (UPD, 2%) of chromosome, imprinting mutation (3%) and point mutations (20%)[1]. A small number neuroimaging studies had suggested the global white matter and grey matter loss or impairment in AS brain. We compared the difference of gray matter volume between HC and age matched AS patients, and on the basis of VBM results we further analyze the develop of relative brain region morphological with age. Our results suggest that both loss and increase of gray matter were occurred in AS brain, and also indicate the different develop pattern of cortex shape between AS and healthy, these may provide more valuable new biomarker for AS research.Methods
Preprocessing
150 structural MRI images from AS patients with 114 novo maternal deletion (mean age 5.21±2.17) and 30 images from healthy controls (mean age 7.00±2.78 ) were scanned at Fudan pediatric hospital. 30 healthy controls and 64 novo maternal deletions (mean age 6.46±1.47) were selected for VBM analysis. Image were mainly processed using SPM12 with the DARTEL algorithm[2]. Images from healthy control were then used to create study specific tissues probability maps (TPM) by using Template-O-Matic toolbox with SPM12. Then all the T1-weighted images were preprocessed using the default setting of VBM with the Computational Anatomy Toolbox 12 (CAT12)[3]. The images were segmented into GM, WM, and cerebrospinal fluid (CSF) sections by using customized tissues probability maps, and then normalized to the MNI space. The data quality and sample homogeneity were checked for exclude the poor segment of tissues contrast images, finally 6 AS and 2 healthy control were excluded for further analysis. Total intracranial volume (TIV) was calculated and consider as covariate with gender and age of each subject. And finally the gray matter images were smoothed with an 8mm FWHM Gaussian kernel. The thickness and volume of brain regions were processed with Freesurfer (recon-all processing pipeline), 114 T1 weighted images from novo maternal deletion AS patients were used to measure the feature of each label with Desikan-Killiany-Tourville atlas.
Statistical Analysis
A two sample t test was used on identified the group differences of gray matter volume between AS patients and healthy controls. A corrected threshold of p<0.05 controls for the family wise error (FWE), and after the correct for multiple comparisons, the minimum cluster size of 100 voxels was present for final results.
Results
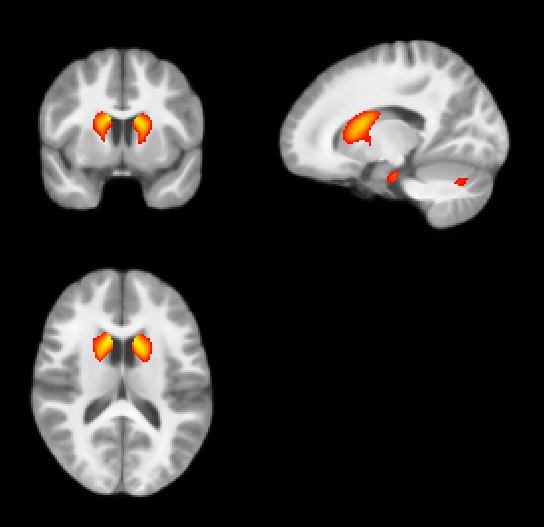
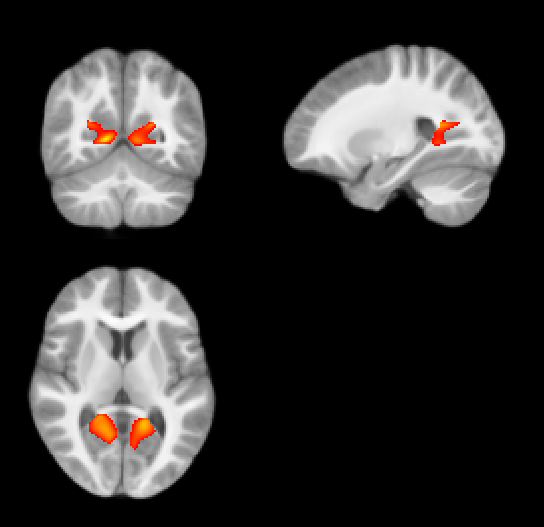
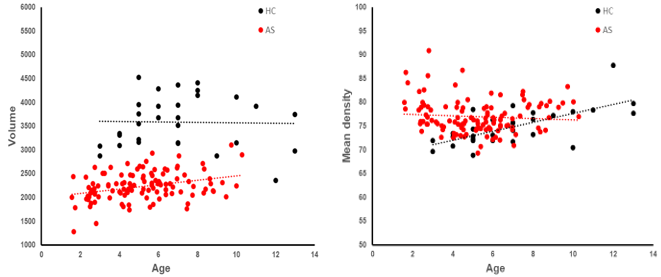
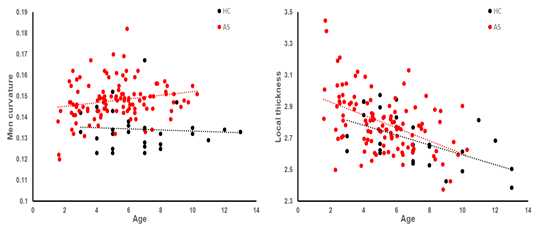
The figure.1 showed a significant loss of gray matter in bilateral caudate, amygdala, and cerebellum cortex. Figure.2 showed a significant higher of gray matter volume in bilateral lingual, precuneus, and orbital frontal cortex. The figure 3 and figure 4 showed the develop of most interest regions with the change of age. AS had smaller gray matter volume in caudate and also showed a faster increase of volume than controls. The gray matter denstity of AS in caudate showed increase while controls showed steady. The AS had more precuneus volume and mean curvature than controls, both AS and controls showed a similar tendency change of the thickness in precuneus, and the mean curvature of precuneus showed increase with age in AS while controls showed opposite.
Discussion
We have present both voxel-based and shape based analysis for angelman syndromes with novo maternal deletions. The result of loss volume in caudate and amygdala are consistent with previous research. The increase of gray matter in cortex and the loss in amygdala may relative to abnormal behavioral appearance in AS, such as consistent laughing, motor disorder[4, 5]. Both abnormal volume in precuneus and OFC were associated with the emotion control and autobiography memory [6]. Our study suggest a new finding of an abnormal shape and volume alternated in precuneus, which plays a key role in default network [7], these finding may indicate a new way of treatment, and may associate the structure alteration among different brain regions.Acknowledgements
References
1. Kishino, T., M. Lalande, and J. Wagstaff, UBE3A/E6-AP mutations cause Angelman syndrome. Nature genetics, 1997. 15(1): p. 70.
2. Ashburner, J., A fast diffeomorphic image registration algorithm. Neuroimage, 2007. 38(1): p. 95-113.
3. Ashburner, J. and K.J. Friston, Voxel-based morphometry—the methods. Neuroimage, 2000. 11(6): p. 805-821.
4. Cavanna, A.E. and M.R. Trimble, The precuneus: a review of its functional anatomy and behavioural correlates. Brain, 2006. 129(3): p. 564-583.
5. Sander, K. and H. Scheich, Left auditory cortex and amygdala, but right insula dominance for human laughing and crying. Journal of cognitive Neuroscience, 2005. 17(10): p. 1519-1531.
6. Fuentes, P., et al., Individual differences in the Behavioral Inhibition System are associated with orbitofrontal cortex and precuneus gray matter volume. Cognitive, Affective, & Behavioral Neuroscience, 2012. 12(3): p. 491-498.
7. AV, U., S. DV, and H. SA, Precuneus is a functional core of the default-mode network. Journal of Neuroscience the Official Journal of the Society for Neuroscience, 2014. 34(3): p. 932.
Figures