3121
Mapping astroglial glutamine synthetase activity in vivo in a preclinical model of epilepsy using glutamate-weighted CEST (GluCEST) MRI1Department of Radiology, University of Pennsylvania, Philadelphia, PA, United States, 2Molecular Imaging Research Center (MIRCen), Paris, France, 3Department of Neurology, University of Pennsylvania, Philadelphia, PA, United States
Synopsis
Epilepsy is broadly characterized by aberrant neuronal excitability causing seizures. Glutamate is the major excitatory neurotransmitter in the brain and can be detected using MRS and glutamate weighted chemical exchange saturation transfer (GluCEST) MRI. In this study, we performed high-resolution GluCEST MRI in a preclinical model of epilepsy to evaluate glutamatergic alterations in the hippocampus.
Introduction
Glutamate is the most abundant excitatory neurotransmitter in the brain and astrocytes participate in the control of neurotransmitter storage and neurotransmission efficacy1. Alterations in glutamate have been demonstrated in epilepsy patients using conventional 1H MRS approach in vivo2,3. Glutamate weighted chemical exchange saturation transfer (GluCEST) MRI is a recently developed technique to image glutamate4. GluCEST provides indirect detection of glutamate in vivo by measuring the exchange of glutamate amine protons with bulk water and provides greater sensitivity and spatial resolution than conventional 1H magnetic resonance spectroscopy (1H MRS) techniques. GluCEST MRI has been used to study neurodegeneration due to tau pathology induced synapse loss5, epilepsy6, Huntington’s disease7, schizophrenia8 and MPTP induced parkinsonism9. Methionine sulfoximine (MSO) is a mechanism-based inhibitor of astrocytic glutamine synthetase (GS) which converts glutamate into glutamine10. GS phosphorylates MSO, and the phosphorylated form of the drug binds irreversibly to the active site of the enzyme, permanently inactivating it. In the present study, C57Bl6 mice were treated with MSO acutely and chronically to monitor the metabolic changes via GluCEST MRI followed by the treatment.Methods
Three-month-old (n=6) C57Bl6 mice for the study; 3 mice underwent chronic intraperitoneal MSO (20 mg/kg for 3 weeks 3 days/week) treatment, while the remaining 3 mice underwent acute treatment (75 mg/kg) during the MR scans. Baseline MR scans were performed on all mice prior to treatment. For MR studies, mice were anesthetized with Isoflurane/air (1-2%, 1 L/hr) and positioned in a 20 mm diameter volume coil (m2m Imaging) at 9.4T Horizontal bore (Bruker, USA) spectrometer. GluCEST imaging was performed using a custom-programmed RF spoiled gradient echo readout pulse sequence in 0.5 mm thick coronal slices with a frequency selective continuous wave saturation preparation pulse. CEST images were collected using a 1-second long saturation pulse at B1 of 250 Hz (5.9 μT) for the frequencies ±2.25-3.75 ppm from water resonance with a step-size of 0.25 ppm. The imaging parameters were: Field of view 20×20 mm2, matrix size 192×192, TR 8 sec, averages per frequency 16. For the B0 inhomogeneity correction, Water Saturation Shift Referencing (WASSR)11 was performed with same parameters as GluCEST except for B1 0.2 μT, CEST pulse saturation length 0.4 sec acquired between 0 and ±1 ppm at step-size 0.1 ppm. The B0 corrected images at +3 ppm (M+3ppm) and −3 ppm (M−3ppm) were used for computing the % GluCEST contrast, which is equal to 100×[(M−3ppm − M+3ppm)/M−3ppm]. Regions of interest (ROIs) were manually segmented from T2-weighted images. For 1H MRS studies, a 1.2×1×5 mm3 voxel was placed in the hippocampus of the mice with parameters VAPOR water suppression, TE/TR = 20/3000 ms, 256 averages. Additionally, unsuppressed water spectrum with 8 averages was acquired for the quantification of metabolites. The spectra were processed using LCModel.Results and Discussion
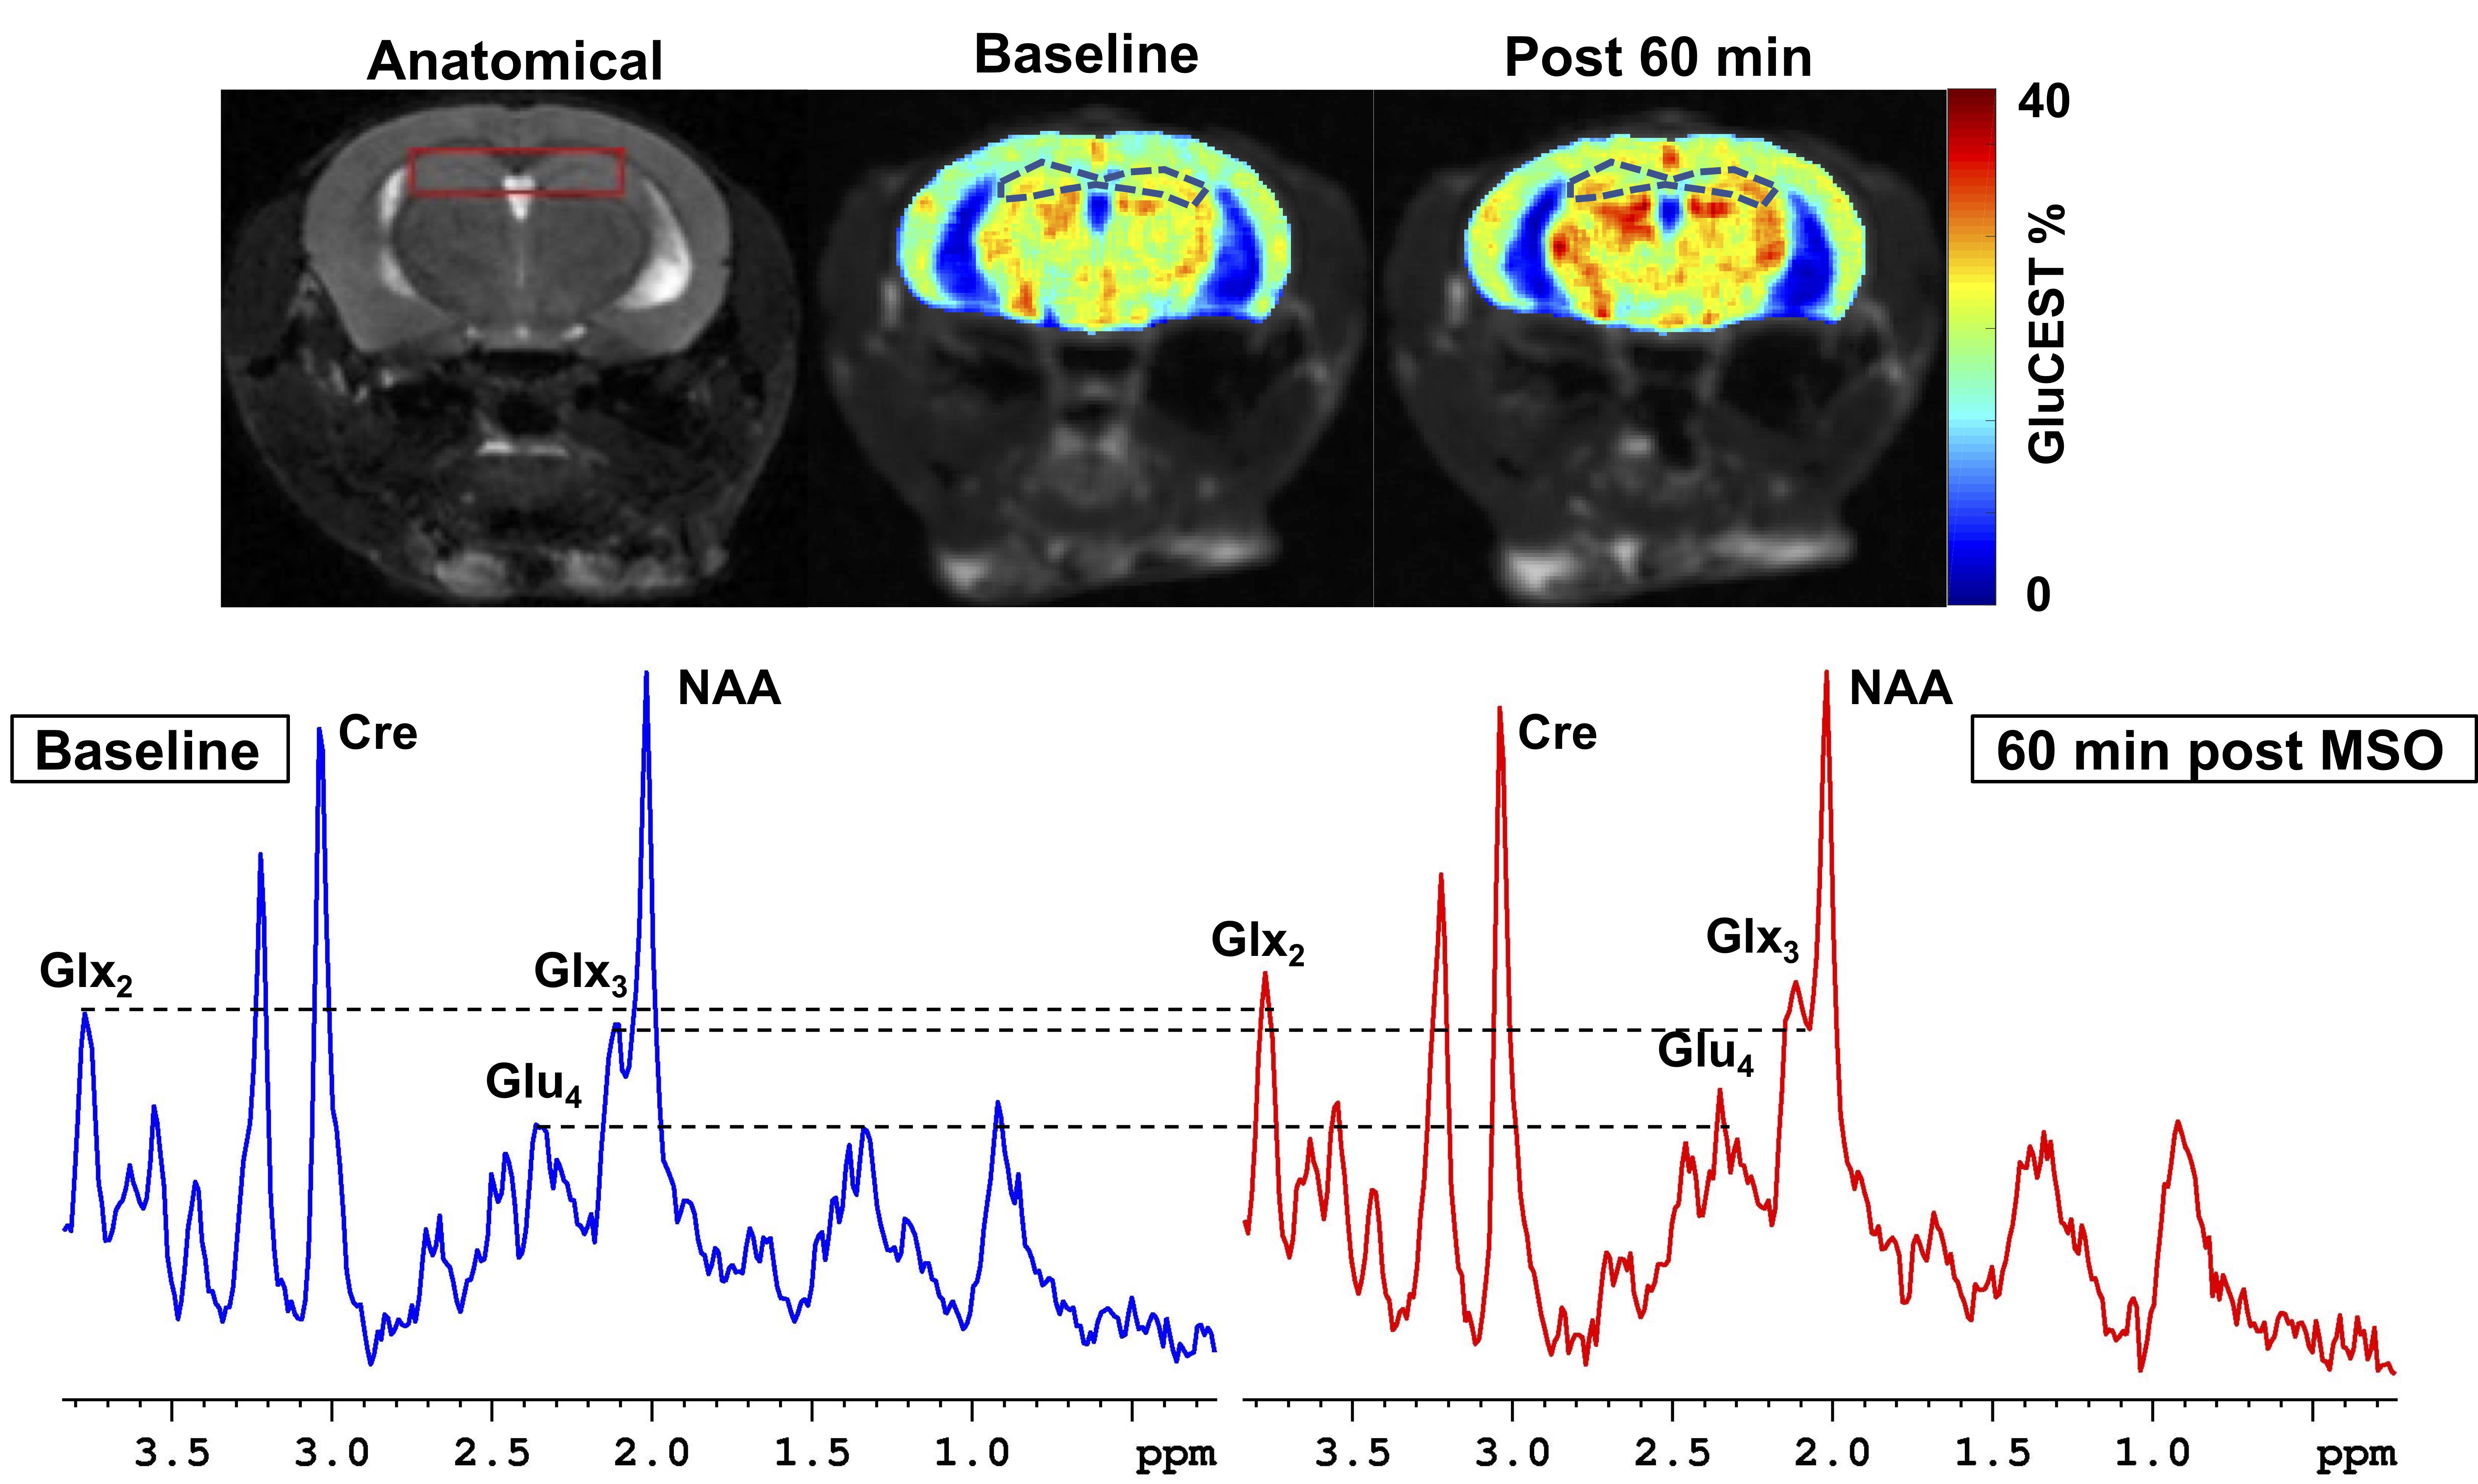
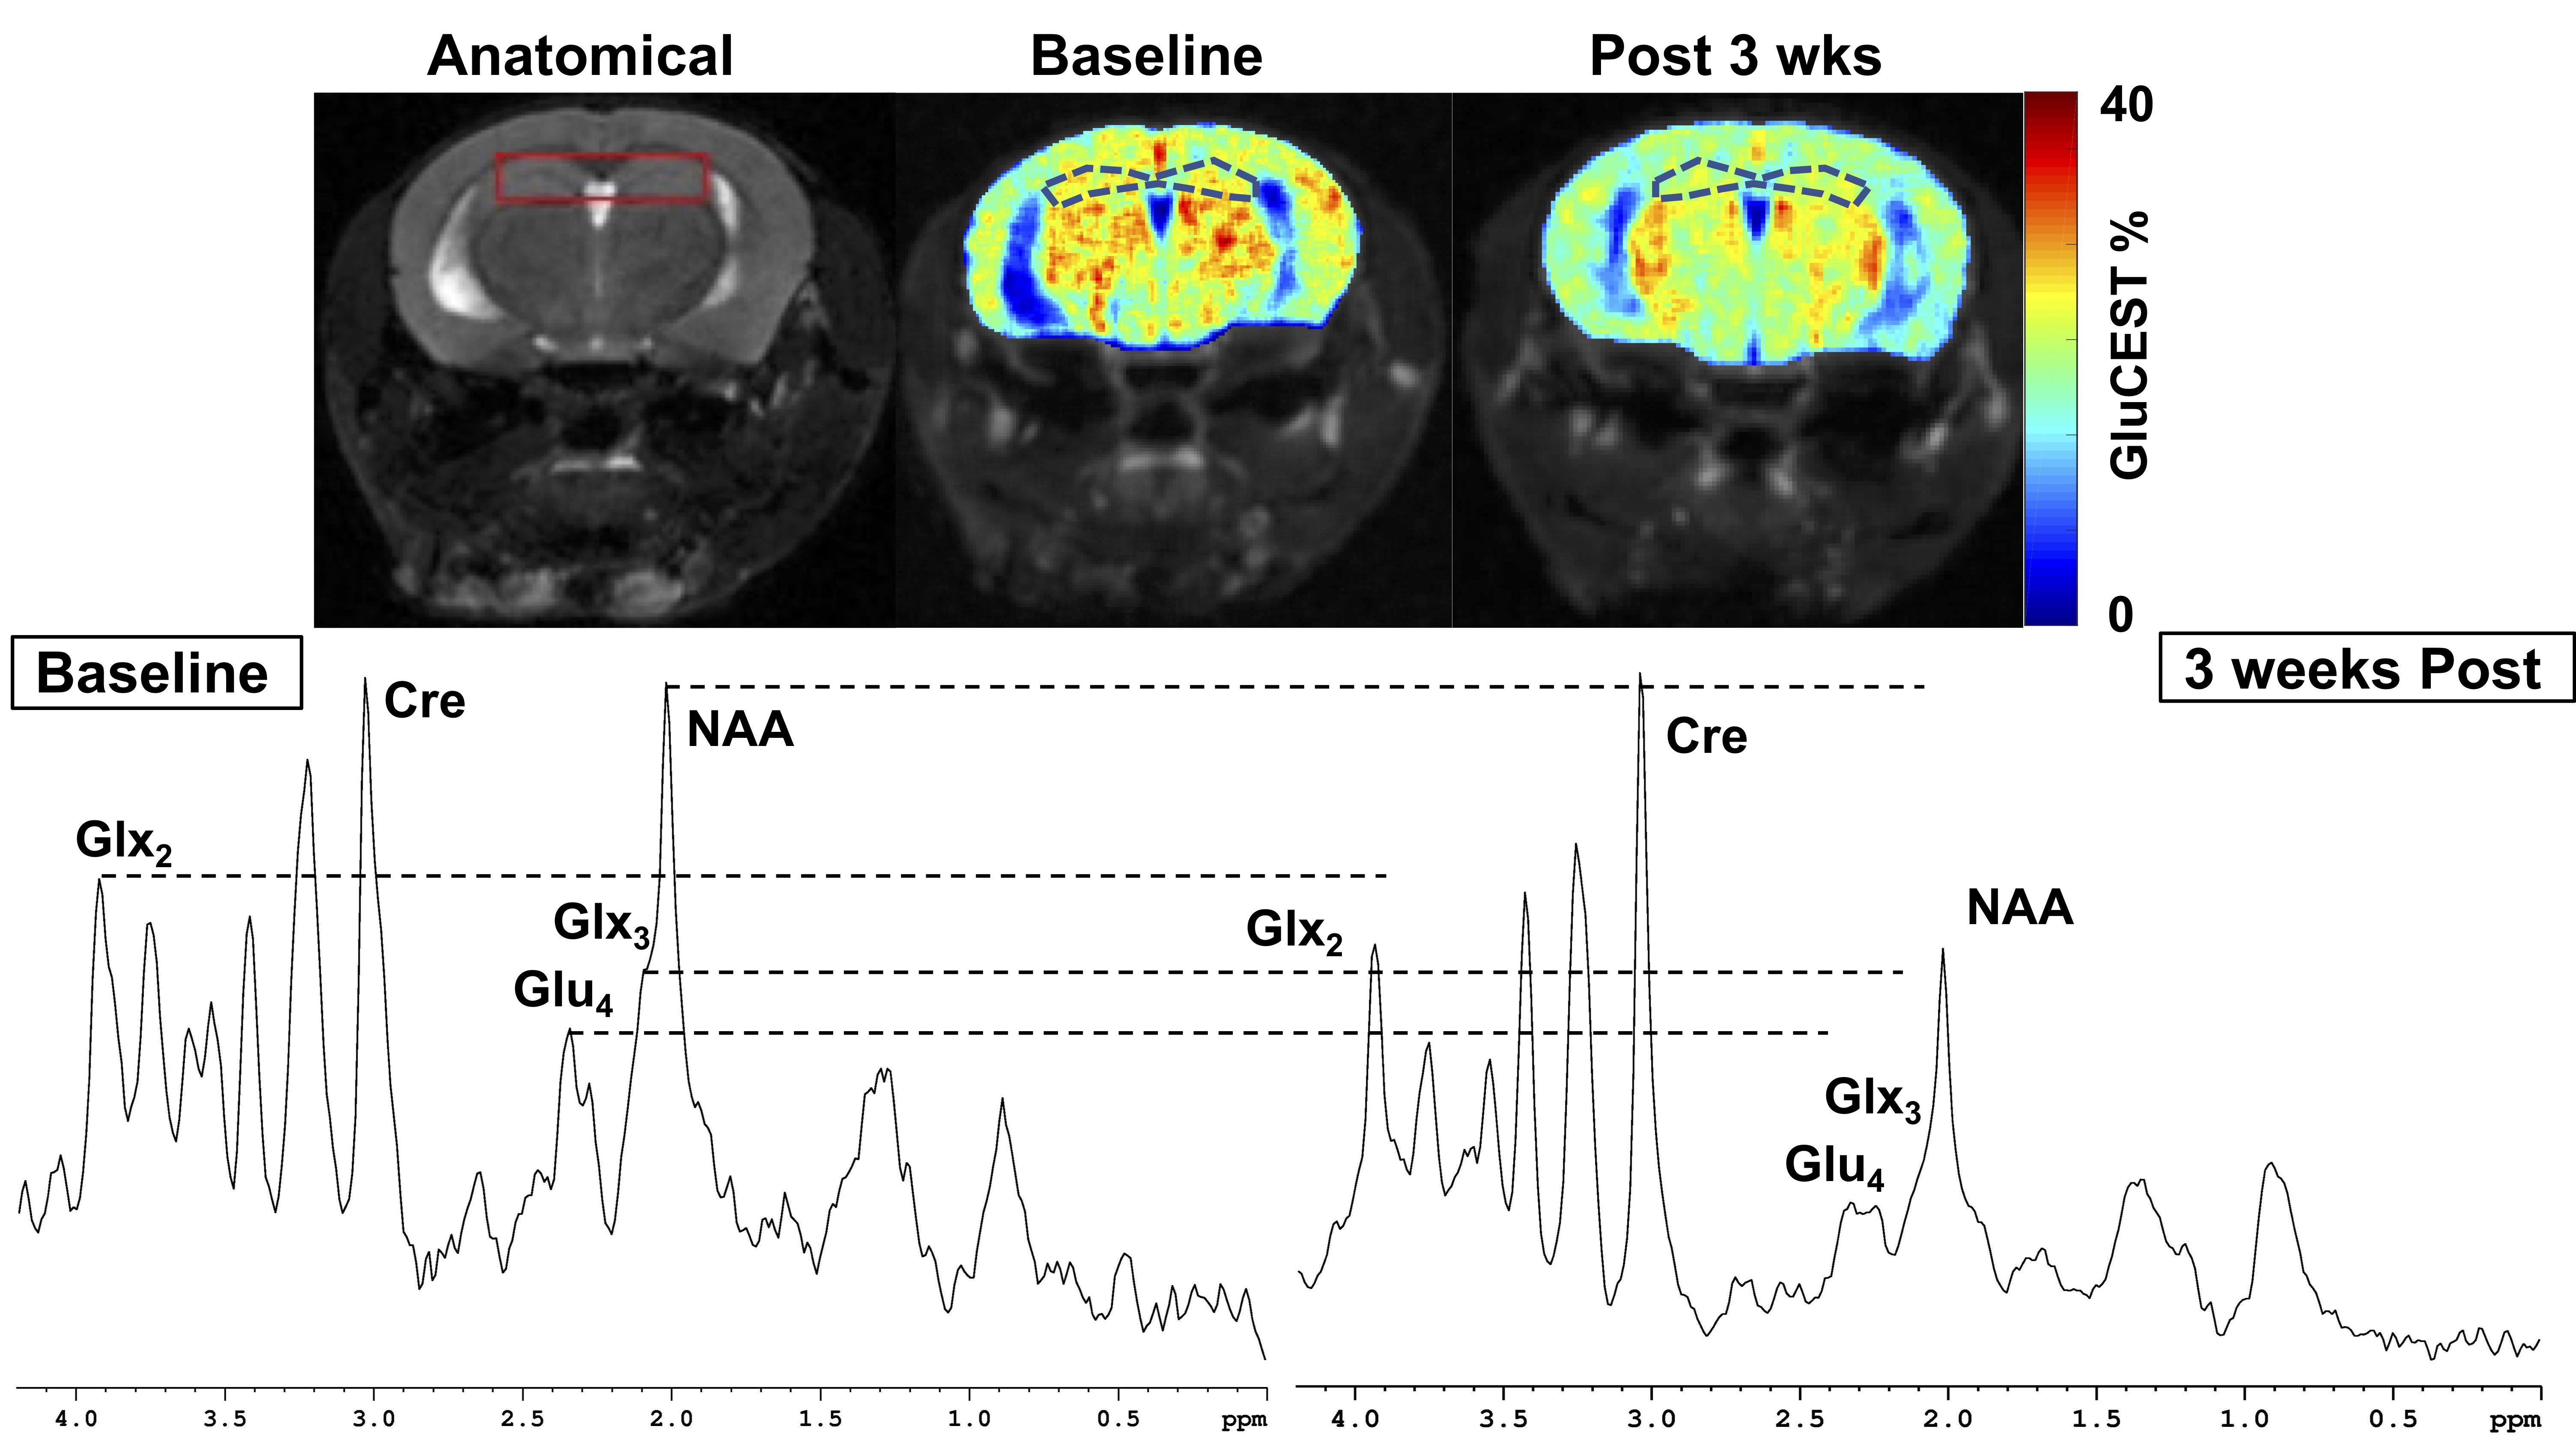
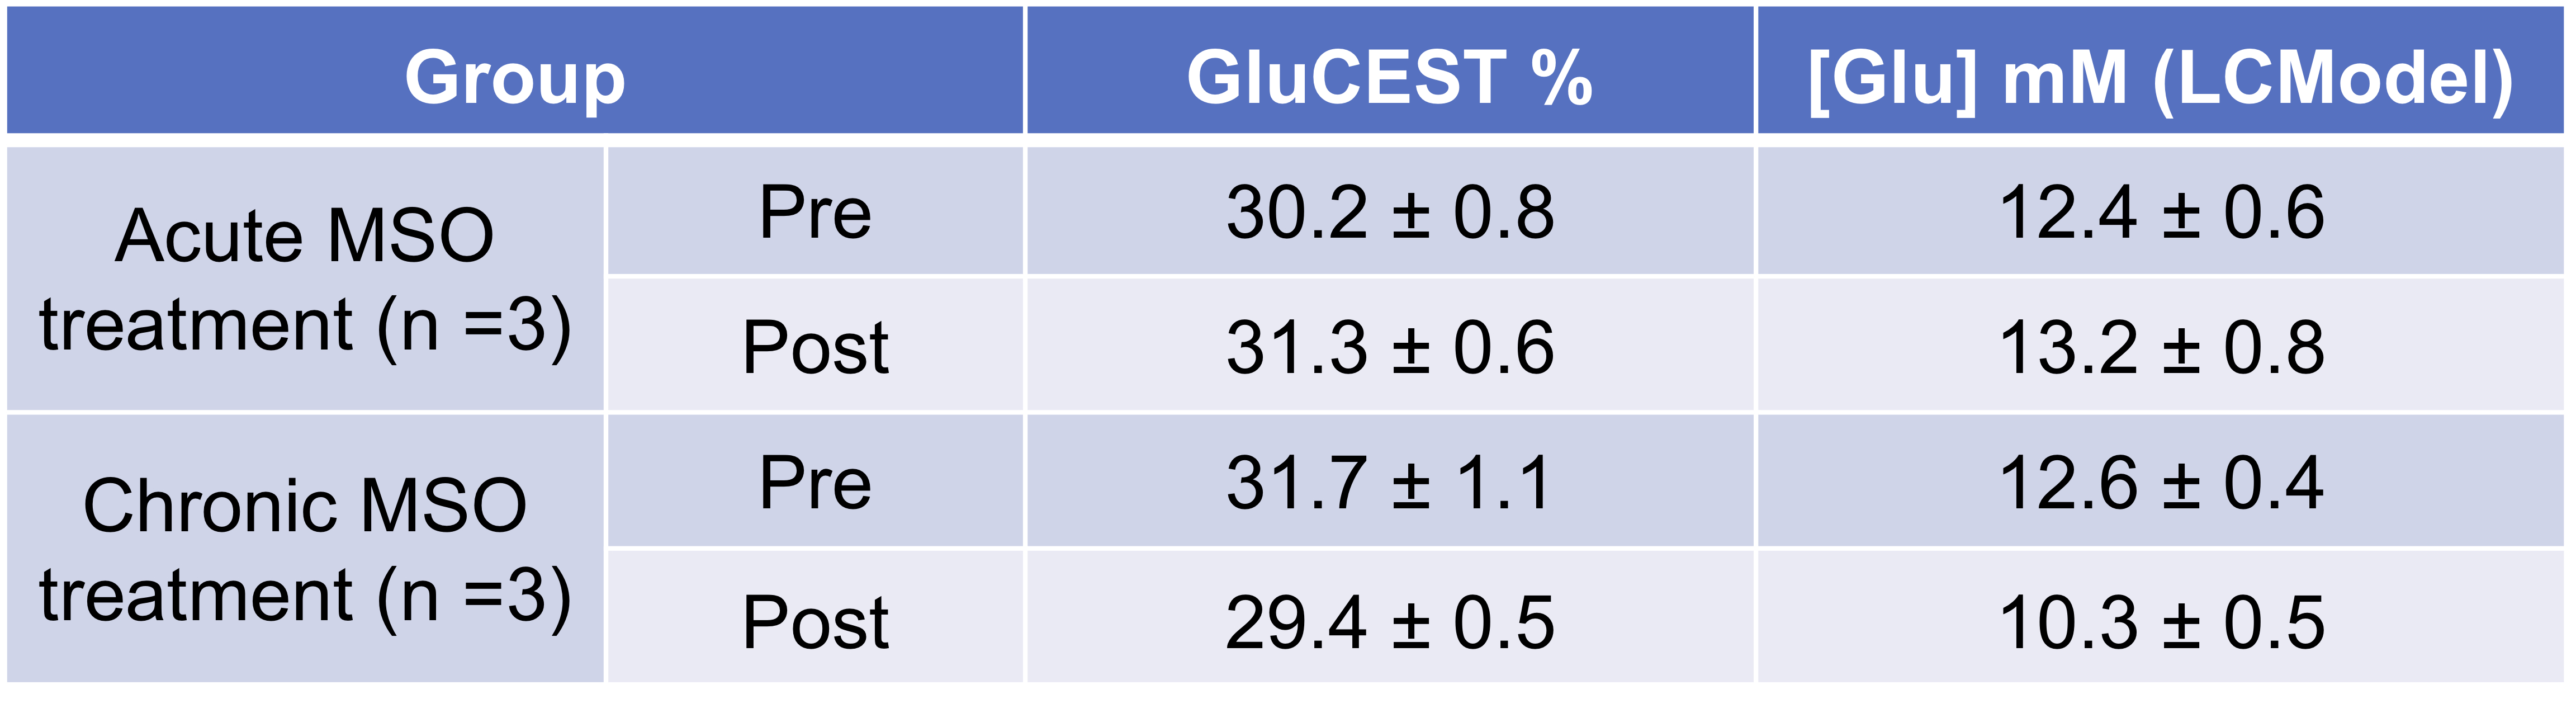
Acute treatment with MSO led to a transient increase in the GluCEST contrast in 60 minutes followed by the administration of MSO which was confirmed by 1H MRS (Figure 1). 1H MRS also showed no change in metabolites other than Glx2, Glx3, and Glx4. In contrast, the GluCEST contrast as well as [Glu] were lower in the brain following chronic MSO treatment for 3 weeks (Figure 2). Table 1shows the changes in GluCEST and [Glu] measured via LCModel fitting of the 1H MR spectra, indicating the GluCEST reflects the cellular glutamatergic alterations. The acute elevation of glutamate following the administration of MSO likely reflects impaired astrocytic glutamate recycling due to inhibition of GS. In contrast, accumulation of glutamate in the extracellular space with chronic exposure to MSO may lead to the neuronal and synaptic loss in the hippocampus through excitotoxic mechanisms. Reduced neuronal cell numbers could explain the observation of lower glutamate and N-acetyl aspartate in the brain. The role of GS dysfunction in the progression of epilepsy has been demonstrated well in the literature. Further studies are going on to understand the mechanism of alterations in the glutamate homeostasis following acute and chronic exposure to MSO.Acknowledgements
This project was supported by the National Institute of Biomedical Imaging and Bioengineering of the National Institutes of Health through Grant Number P41-EB015893 and the National Institute of Neurological Disorders and Stroke through Award Number R01NS087516References
1. Danbolt NC (2001) Prog Neurobiol 65:1-1051
2. Simister RJ et al (2003) Epilepsia 44:550-58
3. Simister RJ et al (2002) Epilepsia 43:1021-31
4. Cai K et al (2012) Nat Med 18:302-6
5. Crescenzi R et al (2014) Neuroimage 101:185-92
6. Davis K et al (2015) Sci Transl Med 7:309ra161
7. Pepin J et al (2016) Neuroimage 139:53-64
8. Roalf DR et al (2017) Mol Psychiatry 22:1298-1305
9. Bagga P et al (2016) J Neurochem 139:432-439
10. Cooper AJ et al (1976) J Biol Chem 251:6674-82
11. Kim M et al (2009) Magn Res Med 61:1441-50
Figures