3115
Optimisation of QSM measurements of venous oxygen saturation1Division of Neuroscience and Experimental Psychology, Faculty of Biology, Medicine and Health, Stopford Building, University of Manchester, Manchester, United Kingdom, 2Division of Neuroscience and Experimental Psychology, Faculty of Biology, Medicine and Health, The Wolfson Molecular Imaging Centre, University of Manchester, Manchester, United Kingdom, 3Applications and Workflow, GE Healthcare, Manchester, United Kingdom
Synopsis
Quantitative Susceptibility Mapping has been shown to be capable of making estimates of venous oxygen saturation ($$$Y_v$$$) which are comparable to those obtained using MR methods such as calibrated BOLD. While there have been a few studies which have considered optimal acquisition parameters for QSM1,2 none have focussed on the specific case of deoxyhaemoglobin. In this work, we propose a protocol for which voxel dimensions, final echo time, and readout polarity have been optimised. Demonstrations of reasonably precise estimates of which are in line with the broader literature recommend suitability of the protocol for future studies.
Introduction
The development of Quantitative Susceptibility Mapping (QSM) as a means of estimating venous oxygen saturation ($$$Y_v$$$) has tended to focus on the development of novel methods of susceptibility map calculation. No consensus exists for optimal scanning parameters, mitigating the comparison of $$$Y_v$$$ values across studies and hindering the process of translating QSM to clinical practice. The primary aim of this study is to investigate the variability in estimates of venous oxygen saturation which can be introduced through the selection of voxel size, longest echo time, and choice of bipolar readout versus uni-polar readout when using Morphology Enabled Dipole Inversion (MEDI) software. A second aim is to determine the precision of the venous oxygenation estimates using the suggested optimal settings.Methods
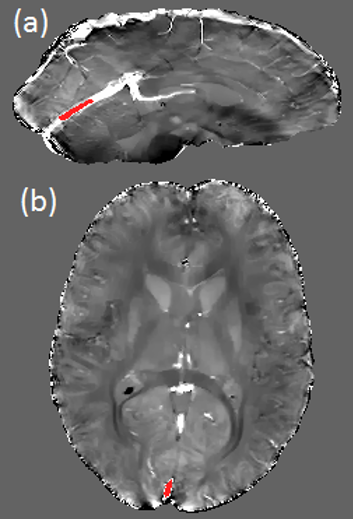
All acquisitions were performed on a PET-MR Signa 3T scanner (GE Healthcare, Milwaukee, WI) using a 32 channel NOVA head coil. A single volunteer participated in two scanning sessions. All scans were performed axially using flow-compensated 3D gradient multi-echo sequences. Parameters common to all scans include: BW ±62.5kHz, Flip Angle 15°, ASSET factor 2. Real, imaginary, and magnitude images were collected. Susceptibility was calculated using the MEDI+0 algorithm3,4 (http://pre.weill.cornell.edu/mri/pages/qsm.html) for Matlab (v2017a, The MathWorks, Inc., Natick, MA). Regions of Interest (ROIs) were drawn manually on the susceptibility maps in the straight sinus (SS) and the superior sagittal sinus (SSS) using MRIcro (v1.4, http://people.cas.sc.edu/rorden/mricro/mricro.html) as in Figure 1. $$$Y_v$$$ values were calculated using5 : $$$χ ̅=Hct∙[(1-Y_v )∙Δχ_0+Δχ_w]$$$ where $$$χ ̅$$$ is the mean susceptibility estimated from each ROI, $$$Y_v$$$ is the oxygen saturation (%), $$$Hct$$$ is the haematocrit (assumed as 0.4) and $$$Δχ_0$$$ and $$$Δχ_w$$$ are constants denoting the susceptibility shift between fully oxygenated and fully deoxygenated blood (3.39ppm (s.i.))6, and between oxygenated blood cells and water (-0.377ppm (s.i.))7 respectively.
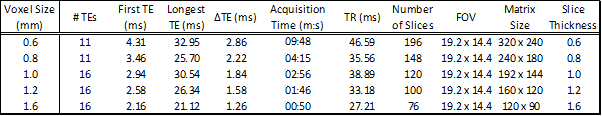
Data from the first session were used to examine the effect of voxel size, comparing a range of voxel sizes (Table 1) using a bipolar read-out in each case. The data were separated into odd and even echoes and the even-echo data were processed. A single 16 echo unipolar readout acquisition was used for evaluation of the impact of the choice of longest echo time on $$$Y_v$$$, starting with the three shortest, then adding the next echo until all 16 were used. This acquisition was also used, along with images from a second acquisition using a bipolar readout with 55% reduction in acquisition time but otherwise equivalent counterpart, in evaluation of the impact of readout gradient choice on image quality. Finally, precision of $$$Y_v$$$ was estimated from 7 repeated acquisitions in the second scanning session using the optimised QSM protocol outlined below. The mean values and the coefficients of variation (CoV) in $$$Y_v$$$ were determined in the SS and SSS.
Results
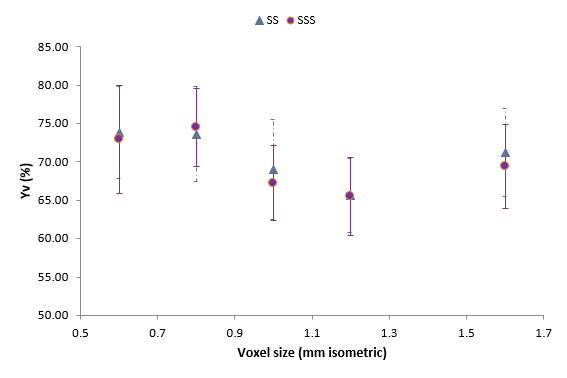
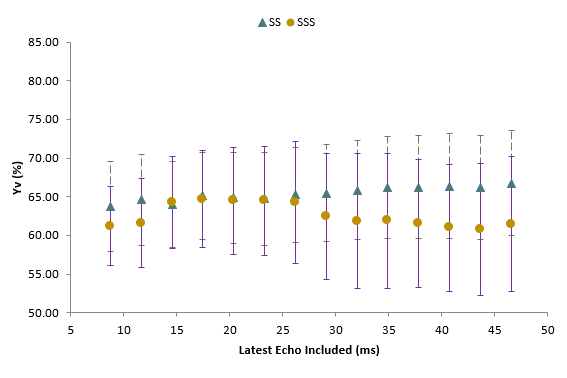
Larger voxels resulted in ~10% lower measured oxygen saturations, $$$Y_v$$$ for both blood vessels up to a minimum at voxel size 1.2mm (Figure 2), with higher values for the voxel sizes above this. The choice of longest echo time altered $$$Y_v$$$ by up to 4% in the SSS and 3% in SS, as seen in Figure 3. Combining QSM maps produced from separate analysis off odd and even echo data from the bipolar acquisition produced maps equivalent to those of the unipolar acquisition, circumventing artefacts which sometimes occurred when using unseparated echoes. From these results, an optimal protocol (voxel size 1mm, 6 echoes from 2.9 ms to 15.7 ms, bipolar acquisition) was designed with acquisition time 2:40. The CoV for $$$Y_v$$$ was estimated as 7.6% and 3.2% in the SSS and SS respectively with mean $$$Y_v$$$ values 65.9% and 63.7%.Discussion
$$$Y_v$$$ estimates were fairly robust to both voxel size and echo time suggesting that a very fast acquisition (rivalling for example TRUST8) with large voxels and short echoes would produce reasonable accurate estimates in these large veins. Of course, higher resolutions could be more desirable for estimates from smaller veins not included in this study and our choice of a 1mm voxel size for our ‘optimum’ protocol was partly motivated by this. Bipolar acquisition offers a clear time saving with no obvious detriment to the quality of the QSM maps. The precision of the $$$Y_v$$$ estimates is very good, with CoV of a similar magnitude to the TRUST technique, amongst others9,10,11.Acknowledgements
No acknowledgement found.References
- Haacke EM, Liu S, Buch S, Zheng W, Wu D, Ye Y. Quantitative susceptibility mapping: current status and future directions. Magn Reson Imaging. 2015;33(1):1-25.
- Lauzon ML, McCreary CR, McLean DA, Salluzzi M, Frayne R. Quantitative susceptibility mapping at 3 T: comparison of acquisition methodologies. NMR Biomed. 2017;30(4).
- Liu Z, Spincemaille P, Yao Y, Zhang Y, Wang Y. MEDI+ 0: morphology enabled dipole inversion with automatic uniform cerebrospinal fluid zero reference for quantitative susceptibility mapping. Magn Reson Med. 2018;79(5):2795-2803.
- Liu T, Liu J, De Rochefort L, et al. Morphology enabled dipole inversion (MEDI) from a single‐angle acquisition: comparison with COSMOS in human brain imaging. Magn Reson Med. 2011;66(3):777-783.
- Fan AP, Bilgic B, Gagnon L, et al. Quantitative oxygenation venography from MRI phase. Magn Reson Med. 2014;72(1):149-159.
- Langham MC, Magland JF, Epstein CL, Floyd TF, Wehrli FW. Accuracy and precision of MR blood oximetry based on the long paramagnetic cylinder approximation of large vessels. Magn Reson Med. 2009;62(2):333-340.
- Weisskoff RM, Kiihne S. MRI susceptometry: image‐based measurement of absolute susceptibility of MR contrast agents and human blood. Magn Reson Med. 1992;24(2):375-383.
- Lu, H., & Ge, Y. (2008). Quantitative evaluation of oxygenation in venous vessels using T2-Relaxation-Under-Spin-Tagging MRI. Magnetic Resonance In Medicine, 60(2), 357-363. doi: 10.1002/mrm.21627
- Fan, A., Schäfer, A., Huber, L., Lampe, L., von Smuda, S., & Möller, H. et al. (2016). Baseline oxygenation in the brain: Correlation between respiratory-calibration and susceptibility methods. Neuroimage, 125, 920-931. doi: 10.1016/j.neuroimage.2015.11.007
- Lajoie, I., Tancredi, F., & Hoge, R. (2016). Regional Reproducibility of BOLD Calibration Parameter M, OEF and Resting-State CMRO2 Measurements with QUO2 MRI. PLOS ONE, 11(9), e0163071. doi: 10.1371/journal.pone.0163071
- Liu, P., Xu, F., & Lu, H. (2012). Test-retest reproducibility of a rapid method to measure brain oxygen metabolism. Magnetic Resonance In Medicine, 69(3), 675-681. doi: 10.1002/mrm.24295
Figures