3001
QSM Detects Post-Concussion Changes in Subcortical Gray Matter Susceptibility1Radiology, Medical College of Wisconsin, Milwaukee, WI, United States, 2Neurosurgergy, Medical College of Wisconsin, Milwaukee, WI, United States
Synopsis
A longitudinal QSM study of sports concussion in 80 injured and control athletes is presented. Regional ROI analysis demonstrated group susceptibility effects that reproduced a previous smaller cohort study finding that QSM diffusely increased in the white matter after sports concussion. In addition, this larger cohort study identified a significant acute trend of decreased susceptibility in sub-cortical gray matter, which is indicative of the calcium influx that is known to occur during the neurometabolic cascade following brain injury. The subcortical gray matter QSM decrease correlated strongly with clinical injury severity metrics.
Introduction
Quantitative MRI is well-suited for potential use as a probe of the subtle neurological changes resulting from mTBI. Previous studies have explored mTBI-induced changes in MR imaging diffusion tensor imaging [1], diffusional kurtosis imaging[2], arterial spin-labeling[3], functional connectivity[4], and quantitative susceptibility mapping[5,6,7].
A recently published study presented widespread acute increases in white matter QSM after sports concussion in cohorts of 27 injured and control subjects[7]. Here, we present results of a similar longitudinal sports concussion study on a larger, independent cohort of 80 injured players and 80 matched controls. The new results reproduce the findings of broad white-matter QSM increases and also identify significant acute decreases in gray matter QSM. The latter finding provides preliminary evidence for a diagnostic imaging indicator of concussion reflecting the well-known calcium influx that occurs within the neurological cascade after traumatic brain injury[8]
Methods
Collegiate and high school football athletes provided written consent (or assent and parental consent if minors) for a study approved by the local institutional human research review board. 78 athletes enrolled in the study were imaged within 24-48 hours after injury, followed by examinations at 8 days, 15 days, and 45 days post-injury.
Imaging was performed on a clinical 3T MR imaging scanner using a 32-channel head receive array. QSM data were collected by saving the raw k-space data from a commercially available SWI application. SWI data acquisition parameters were as follows: in-plane data matrix, 320 256; FOV, 24 cm; slice thickness, 2 mm; TR, 58.6 ms, which allowed for the collection of 4 echoes. QSM were computed using RESHARP[9] background removal and VP-QSM[10].
Subject recruitment for the longitudinal exams was not perfect and quality control efforts excluded several datasets from analysis. The final analysis cohort had injured subject sub-cohorts of [78 82 78 56] at the four time-points, while the control cohort had sub-cohorts of [75 58 58 54].
All QSM maps were registered to a single QSM reference map in MNI coordinate space. A templated neurological QSM stability map was utilized from a previous, independent longitudinal control subject cohort[7] to restrict analysis to regions that had reliable and stable QSM estimates.
ROI analysis within white and subcortical gray matter (including global white and gray) compartments was performed using anatomic segmentations extracted from the Johns Hopkins University and Harvard MNI space atlases.
Mean susceptibility values were computed within each gray and white matter ROI for each subject. Group differences between the means were computed using 2-tailed independent samples t-tests with unequal variances at each visit. In addition, effect sizes between the groups were estimated by computing the Cohen D at each visit. Symptom duration (as a proxy of injury severity) measures were also correlated with the 24-hour susceptibility measurement.
Results and Discussion
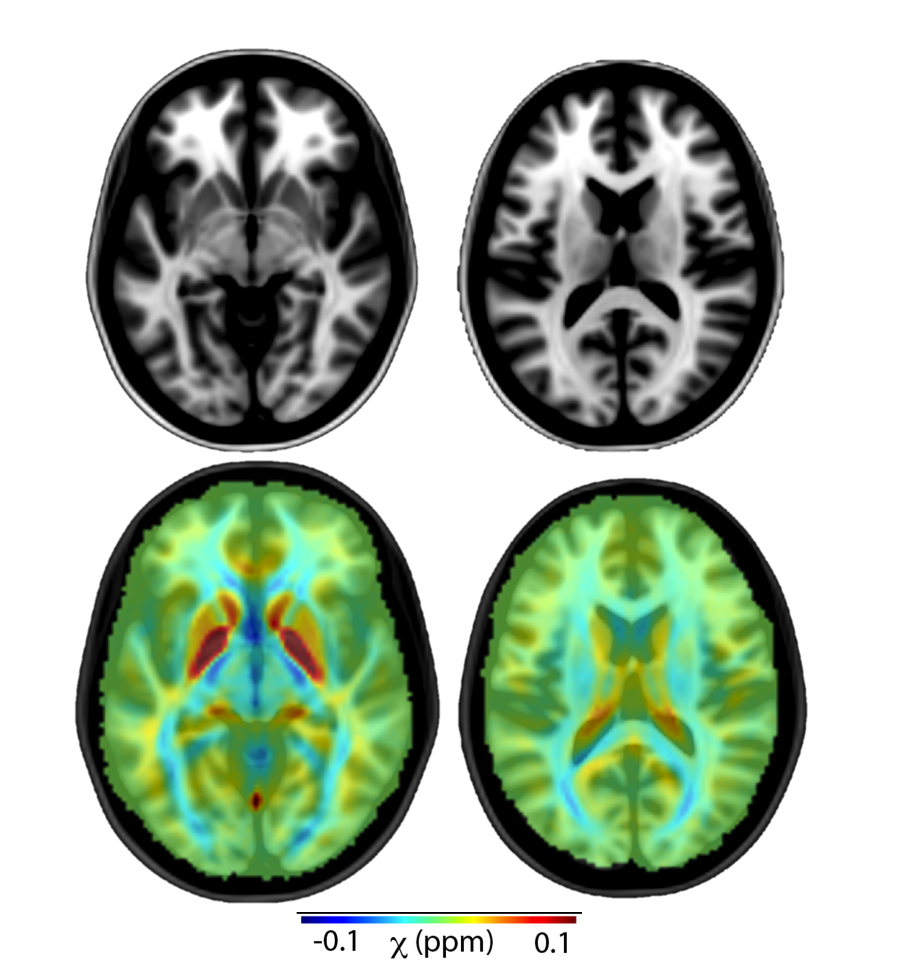
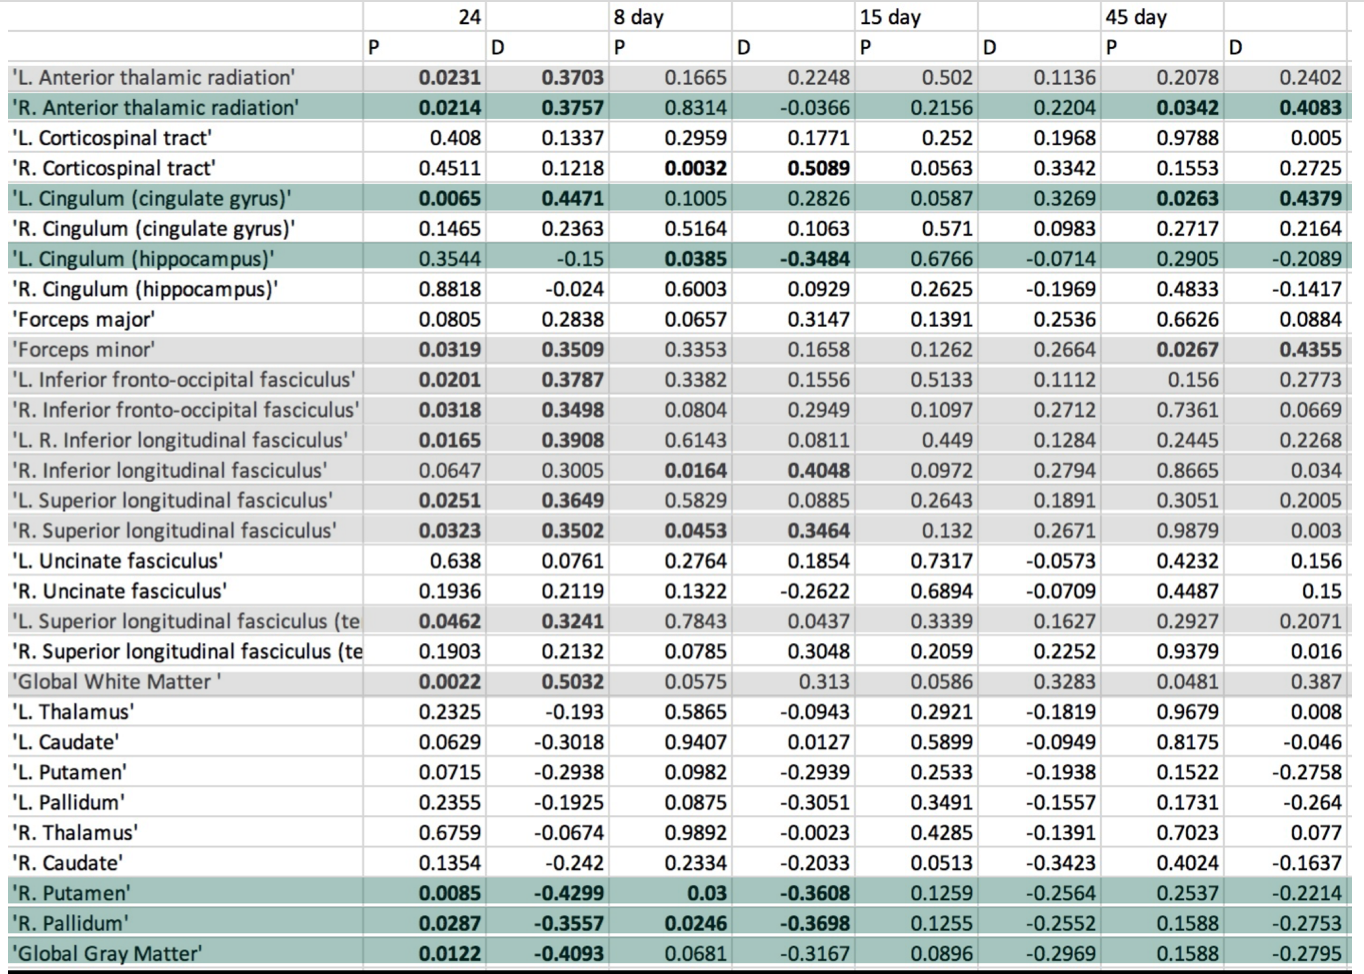
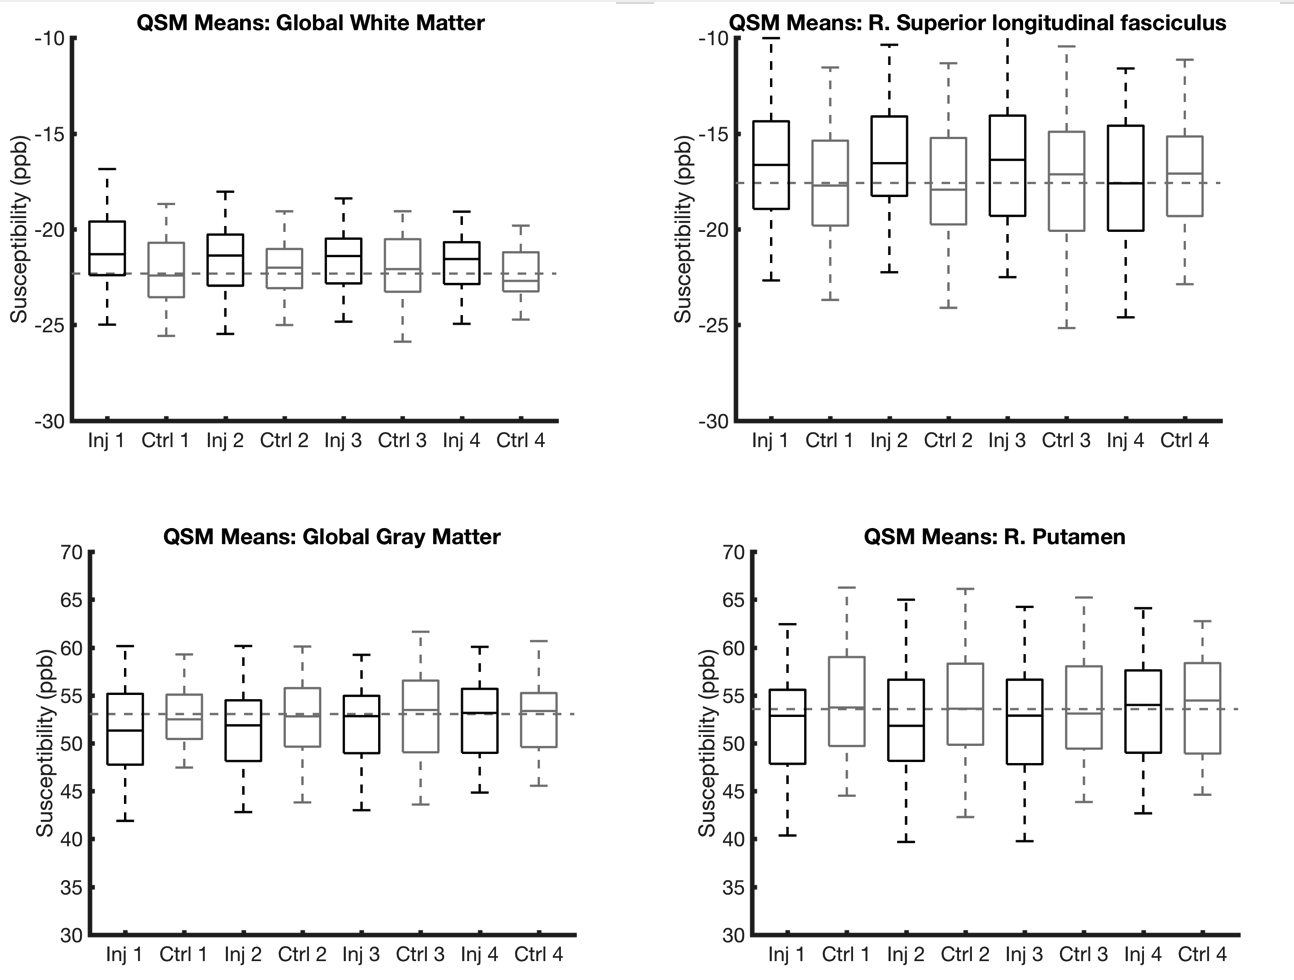
Figure 1 provides representative mean QSM maps across the entire control group for two axial slices. Table 1 provides the results of the statistical ROI analyses. Substantial group differences were found in the white matter and gray matter compartments. Several of the white matter compartment changes (gray highlights) were reproductions of a previous similar study on a smaller cohort (N=27). The green highlights were regions that showed new effects in the current larger cohort study, with the gray matter findings being a crucial new discovery. White matter and gray matter directional trends were all consistent, with increases in white matter and decreases in gray matter. Figure 2 provides a box-plot summarizing the longitudinal trends.
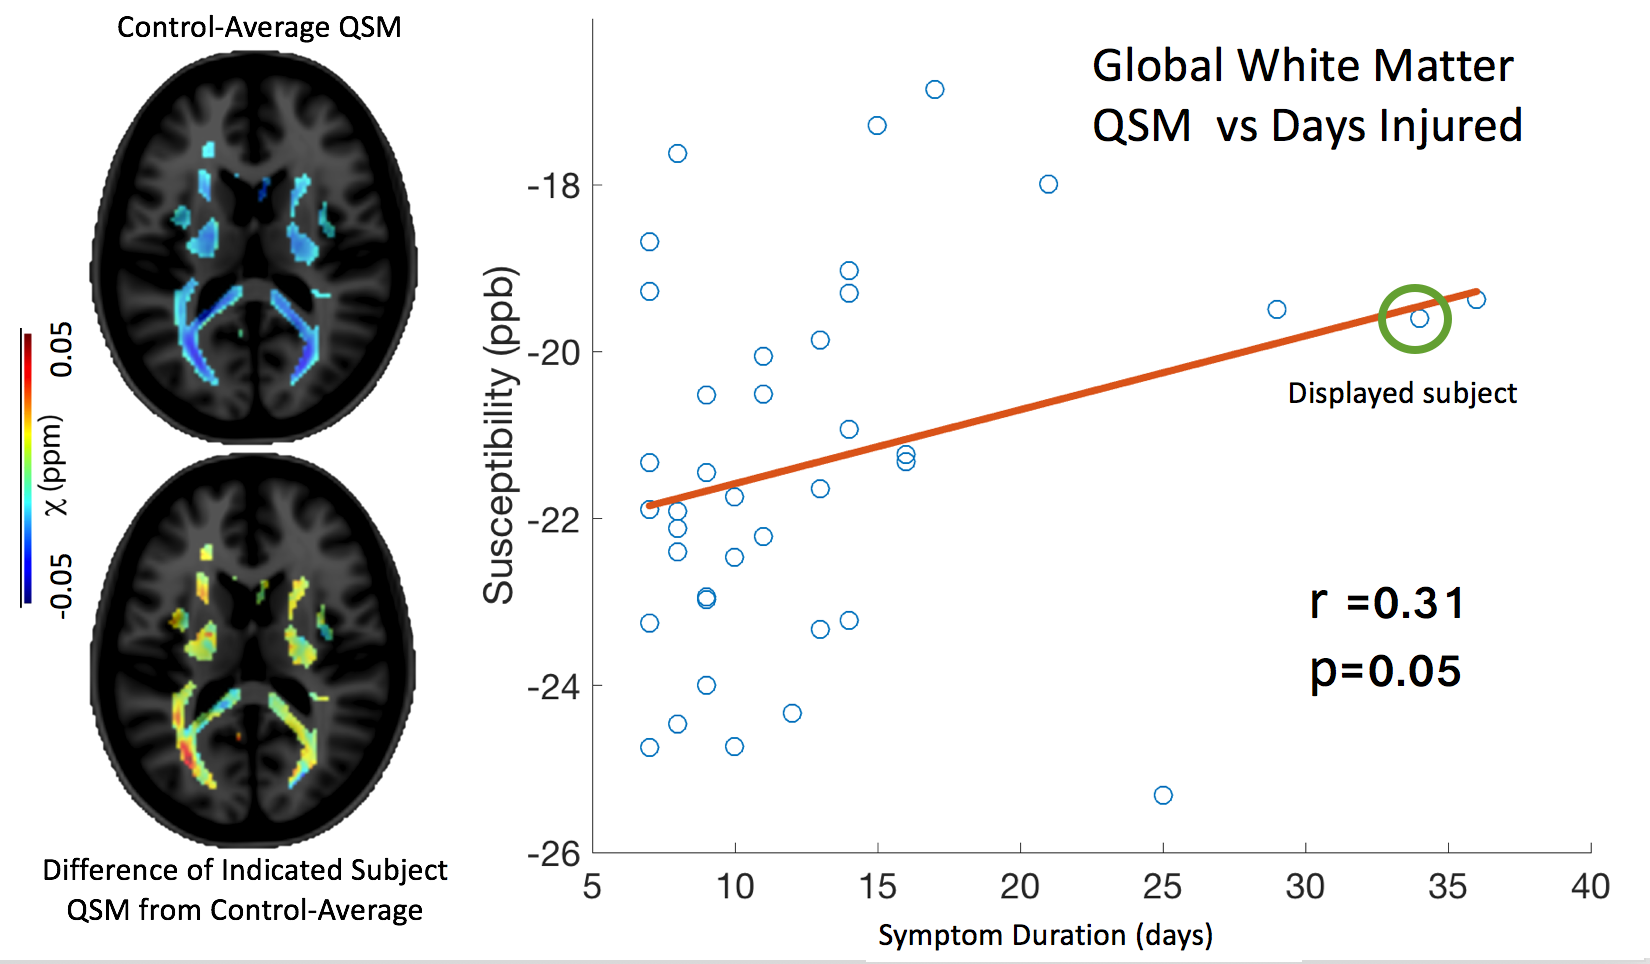
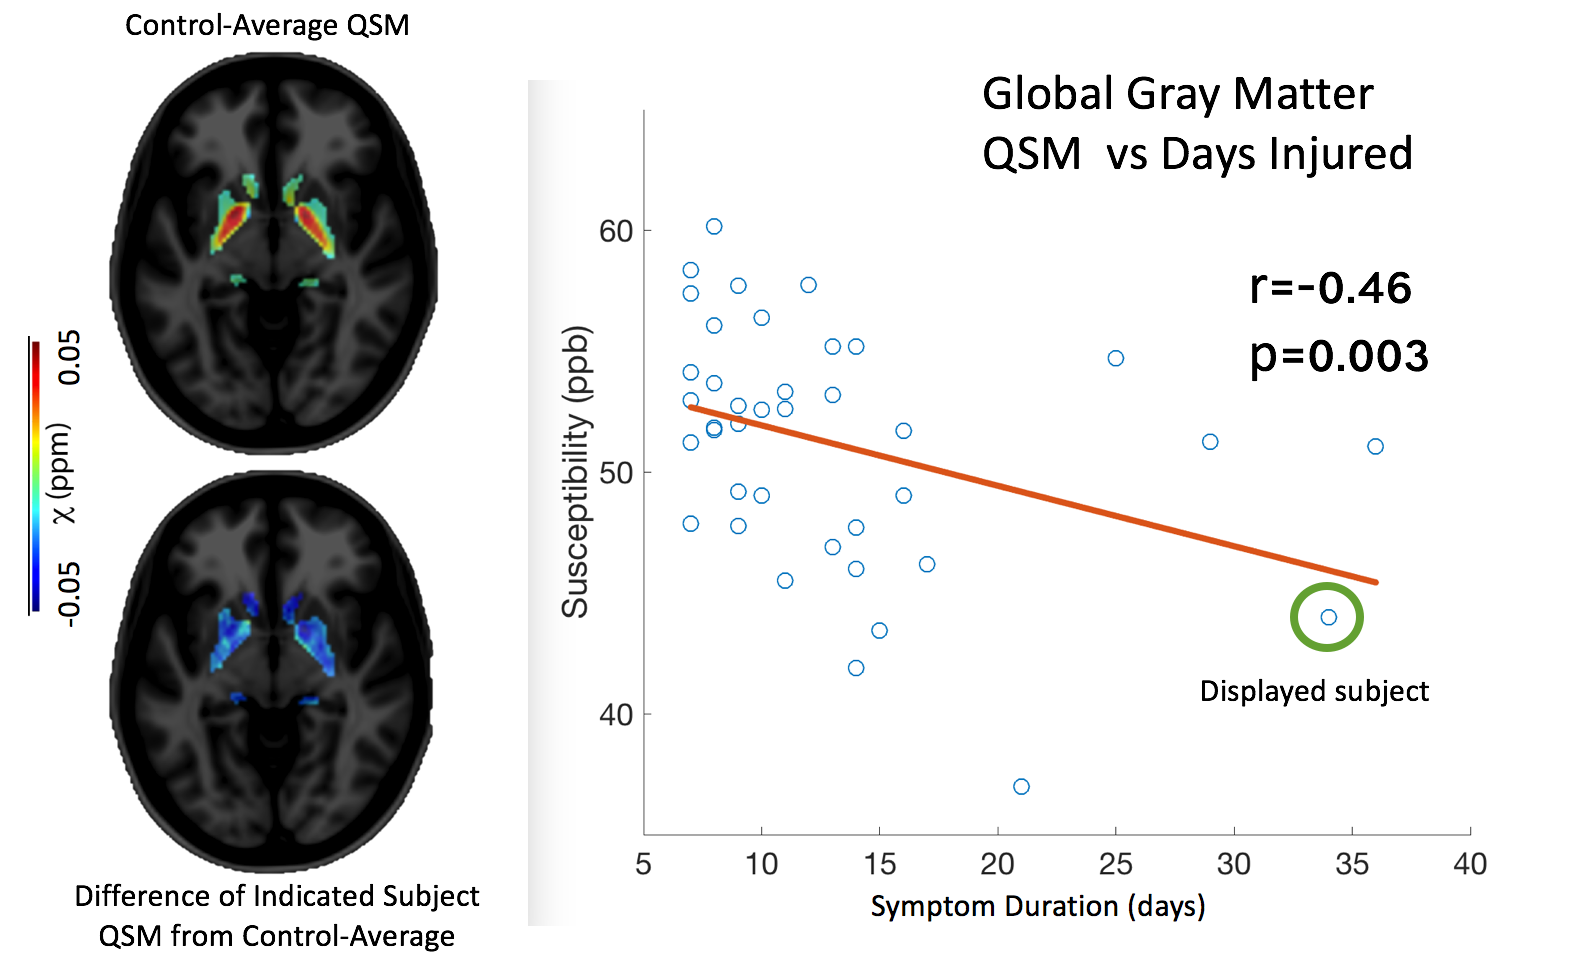
Figure 3 provides a scatter plot of the symptom duration metric (subjects > 6 days of symptoms ) vs QSM in the global white matter, while Figure 4 provides the same data for the global gray matter compartment (restricted by the aforementioned externally-derived QSM stability map). Correlations with injury severity were strongest using the displayed window (> 6 days). Lower severity injuries showed increased variation relative to susceptibility measurements. This may be indicative of the limits of the susceptibility measurement's sensitivity to injury severity. In addition to the correlation plots in Figures 2 and 3, QSM maps of the control mean (top) and injury difference (from the control mean) of one subject (circled in scatter plot) are presented. The Pearson correlations were 0.31 (p=0.05) and -0.46 (p=0.003) for the white and gray matter compartments, respectively.
In summary, this study has 1) reproduced identified post-concussion QSM increases in white matter and 2) acute QSM decreases in deep gray matter structures that correlate strongly with injury severity metrics (duration of symptoms). The former finding can be explained by the well-known calcium influx that results from neurological trauma[8].
Acknowledgements
Funded in part by the Department of Defense Head to Head 2 Project.References
1. Shenton ME, Hamoda HM, Schneiderman JS, et al. A review of magnetic resonance imaging and diffusion tensor imaging findings in mild traumatic brain injury. Brain Imaging Behav 2012;6:137–92 CrossRef Medline
2. Lancaster MA, Olson DV, McCrea MA, et al. Acute white matter changes following sport-related concussion: a serial diffusion tensor and diffusion kurtosis tensor imaging study. Hum Brain Mapping 2016;37:3821–34 CrossRef Medline
3. Wang Y, Nelson LD, LaRoche AA, et al. Cerebral blood flow alterations in acute sport-related concussion. J Neurotrauma 2016;33: 1227–36 CrossRef Medline
4. Mayer AR, Bellgowan PS, Hanlon FM. Functional magnetic resonance imaging of mild traumatic brain injury. Neurosci Biobehav Rev 2015;49:8 –18 CrossRef Medline
5. Liu W, Soderlund K, Senseney JS, et al. Imaging cerebral microhemorrhages in military service members with chronic traumatic brain injury. Radiology 2016;278:536 – 45 CrossRef Medline
6 Lin HH, Liu HS, Tsai PH, et al. Quantitative susceptibility mapping in mild traumatic brain injury. In: Proceedings of the Annual Meeting and Exhibition of the International Society for Magnetic Resonance in Medicine, Honolulu, Hawaii. April 22–27, 2017:2395
7. Koch, K.M., Meier, T.B., Karr, R., Nencka, A.S., Muftuler, L.T. and McCrea, M., 2018. Quantitative susceptibility mapping after sports-related concussion. American Journal of Neuroradiology, 39(7), pp.1215-1221.
8. Giza, C. C., & Hovda, D. A. (2001). The Neurometabolic Cascade of Concussion. Journal of athletic training, 36(3), 228-235.
9. Sun H, Wilman AH. Background field removal using spherical mean value filtering and Tikhonov regularization. Magn Reson Med 2014;71:1151–57 CrossRef Medline
10. Anderson C, Nencka A, Muftuler T, et al. Volume-parcellated quantitative susceptibility mapping.In: Proceedings of the Annual Meeting and Exhibition of the International Society for Magnetic Resonance in Medicine, Singapore. May 7–13, 2016:1108
Figures