2905
Comparison of quantitative blood oxygenation imaging methods for the assessment of brain tumor oxygen consumption in native MRI.1Neuroradiology, UKE, Hamburg, Germany, 2Radiology, UCSD, San Diego, CA, United States, 3Neurosurgery, UKE, Hamburg, Germany
Synopsis
The comparison of the blood oxygen extract fraction (OEF) of solid tumor regions between the QUantitative Imaging of eXtraction of Oxygen and TIssue Consumption (QUIXOTIC) and quantitative Blood Oxygenation Level Dependent (qBOLD) methods showed an opposite trend of qBOLD-OEF and QUIXOTIC-OEF between tumor and cortical GM. Further analysis suggests that QUIXOTIC-OEF may be compromised by the strong and long lasting magnetization of the increased interstitial water due to tumor edema and, therefore, no reliable parameter to assess tumor OEF. On the other hand, qBOLD-OEF may have correctly detected a higher OEF of solid tumor regions.
INTRODUCTION
QUantitative
Imaging of eXtraction of Oxygen and TIssue Consumption (QUIXOTIC) is
a velocity-selective spin labeling technique, which is able to assess
the magnetization of the post capillar venular blood at different
spin-echo times on a voxel-by-voxel basis [1]. Since R2 of
blood depends on the blood's oxygen saturation and hematocrit, an
oxygen extract fraction (OEF) map can be determined from the R2 map
of the venular blood. On the other hand, the quantitative Blood
Oxygenation Level Dependent (qBOLD) method assesses the blood
oxygenation by modeling the effect of the blood capillary network on
the tissue magnetization measured by gradient echo sampled spin-echo
(GESSE) [2].
Beside OEF, the qBOLD method also obtains the deoxygenated blood
volume (DBV) of the underlying blood capillary network. However, the
parameters of the qBOLD method show quite an amount of
interdependency between each other leading to instabilities in the
fitting of the qBOLD model especially for measurements with low
signal-to-noise ratio [3].
Also, tissue R2 values can be determined by both methods. The
aim of this work was to compare the OEF values obtained by both blood
oxygenation imaging methods in tumor patients.METHODS
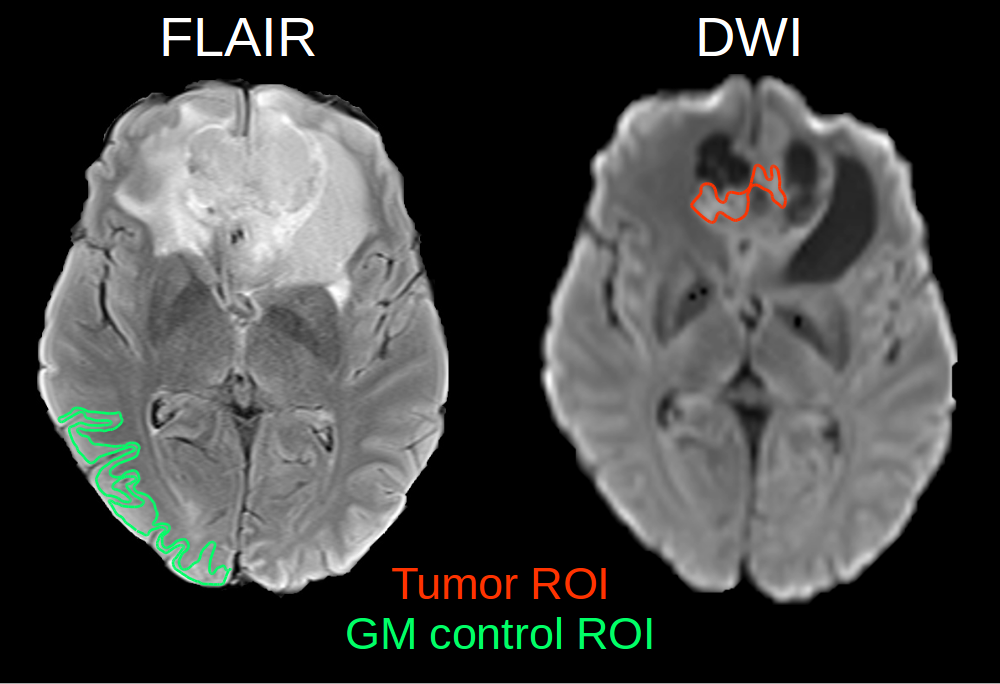
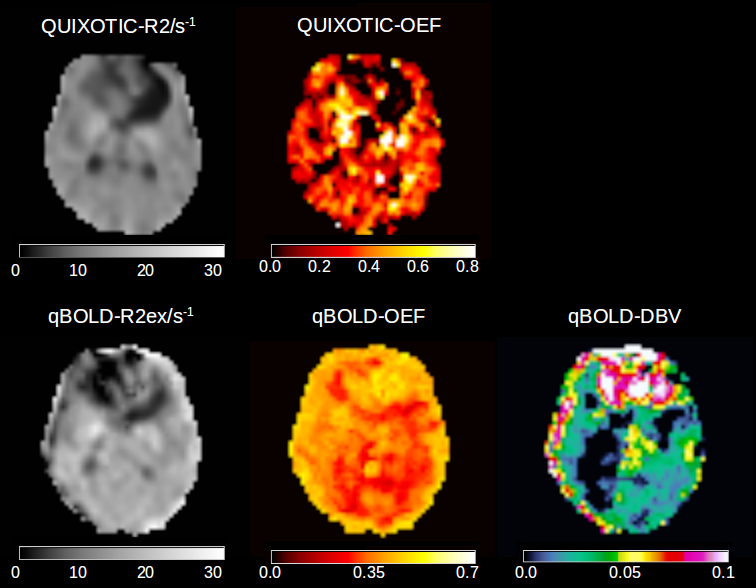
29 patients with preoperative gliomas (WHO grades 2-4) were imaged at 3T. The subjects gave written informed consent prior to inclusion into the study, which was approved by the local ethics committee. Fluid-attenuated inversion recovery (FLAIR) and diffusion-weighted (DWI) images were used to locate the tumor and the solid tumor regions (Fig.1). The QUIXOTIC sequence was scanned three times with three different T2prep times 20, 40 and 60ms, 20 labeled and 20 control images, 4x4mm2 in-plane resolution, 64x64 matrix, 5.5mm slice thickness, TE=12ms, TR=3000ms and 2min acquisition duration for each T2prep time. GESSE was acquired with gradient echo times TEs=20-80ms, DTE=4ms, spin echo occurring at 30ms, TR=3000ms, 3x3mm2 in-plane resolution, 64x64 matrix, 4mm slice thickness, averages=2, acquisition time 5:42 min. ROIs were transferred to QUIXOTIC and qBOLD images after co-registering to FLAIR and DWI using NiftyReg [4]. To improve the signal to noise ratio and therefore robustness of the quantitative parameter calculation [3], quantitative parameters used for statistical analysis were calculated based on median ROI values of raw image data and were not determined from precalculated voxel-by-voxel parameter maps (Fig.2). Data reconstruction was done using in house developed Matlab code followed by statistical analysis using SPSS (Wilcoxon-Mann-Whitney Test and Spearman's rank correlation coefficient).RESULTS
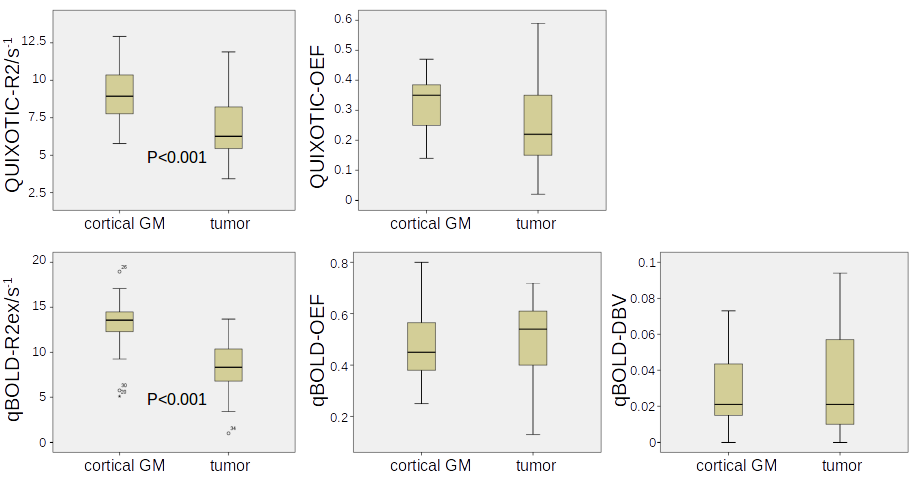
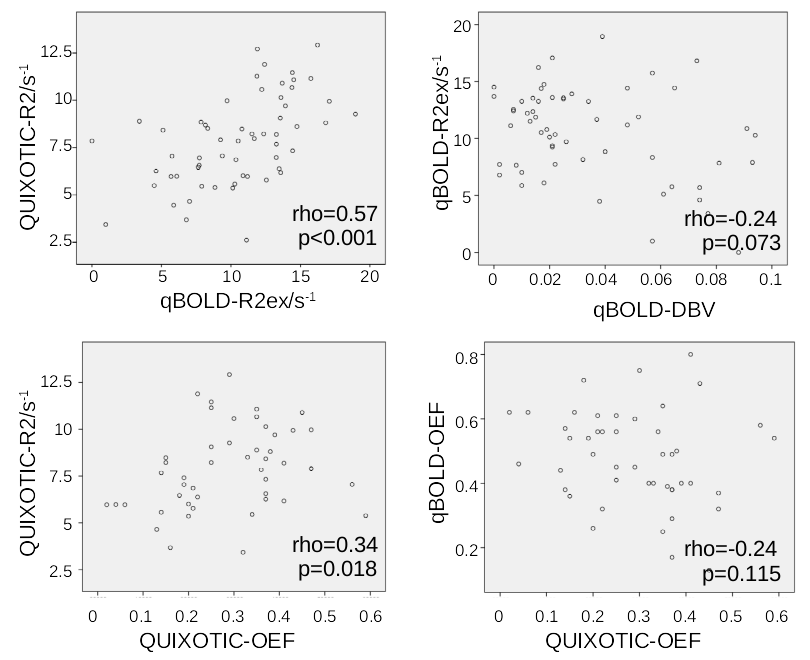
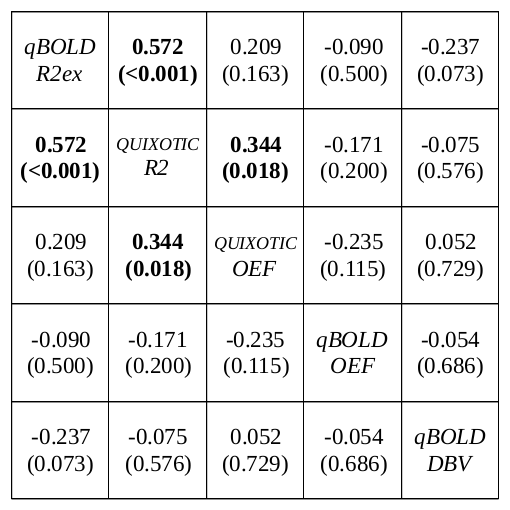
Box plots of all analyzed parameters are shown in Fig.3. Only R2ex of the qBOLD method and tissue R2 of the QUIXOTIC method showed a statistically significant difference (p<0.001) between tumor and cortical GM with lower R2 for tumor and higher R2 for cortical GM. Both, qBOLD-OEF and QUIXOTIC-OEF, show no statistically significant difference between tumor and cortical GM, however, qBOLD-OEF seems to be higher for tumor than for cortical GM. Contrarily, QUIXOTIC-OEF seems to be lower for tumor than for cortical GM. Correlation coefficients between all analyzed parameters and exemplary scatter plots are shown in Fig.4 and Fig.5. Here, qBOLD-R2ex and QUIXOTIC-R2 showed a strong and statistically significant correlation (rho=0.57). Interestingly, QUIXOTIC-OEF also showed a statistically significant correlation (rho=0.34) with QUIXOTIC-R2 and a little weaker correlation (rho=0.21) with qBOLD-R2ex. Furthermore, qBOLD-OEF and QUIXOTIC-OEF (rho=-0.24) showed a weak negative correlation as well as qBOLD-R2ex and qBOLD-DBV (rho=-0.24).DISCUSSION and CONCLUSION
The
lower tissue R2 values observed with both methods (qBOLD-R2ex and
QUIXOTIC-R2) for the tumor are most likely caused by tumor edema due
to increased amount of interstitial water. The strong correlation
between both R2 measurements confirms their similar sensitivity.
Interestingly,
qBOLD-OEF and QUIXOTIC-OEF show an opposite trend between tumor and
cortical GM, which is confirmed by their negative correlation with
each other. However, the
statistically significant correlation between
QUIXOTIC-OEF and
QUIXOTIC-R2 suggests that the
magnetization of the post
capillar venular blood may
be compromised by the strong
and long lasting magnetization of the increased interstitial
water due to tumor edema. Therefore, the employed T2prep QUIXOTIC
may not allow to
reliably assess tumor OEF.
On
the other hand, the negative correlation between qBOLD-R2ex and
qBOLD-DBV demonstrates their not fully solved interdependency even by
using high signal-to-noise data from median raw image ROI values.
However, the absent correlations of qBOLD-OEF with qBOLD-DBV and
qBOLD-R2ex suggest a successful isolation of qBOLD-OEF from the
interdependency with the other qBOLD parameters. Therefore, the
higher solid tumor OEF may have been correctly detected by the qBOLD
method.Acknowledgements
We thank the German Research Foundation (DFG) for financial support: grant no. SE 2052/1-1.References
1. Bolar DS, Rosen BR, Sorensen AG, Adalsteinsson E. QUantitative Imaging of eXtraction of oxygen and TIssue consumption (QUIXOTIC) using venular-targeted velocity-selective spin labeling. Magn Reson Med. 2011 Dec;66(6):1550-62.
2. He X, Yablonskiy DA. Quantitative BOLD: mapping of human cerebral deoxygenated blood volume and oxygen extraction fraction: default state. Magn Reson Med. 2007 Jan;57(1):115-26.
3. Sohlin MC, Schad LR. Theoretical prediction of parameter stability in quantitative BOLD MRI: dependence on SNR and sequence parameters. In: Proceedings of 18th Annual Meeting of ISMRM, Honolulu, Hawaii, 2009. (abstract 1623).
4. Modat M, Ridgway GR, Taylor ZA, Lehmann M, Barnes J, Hawkes DJ, Fox NC, Ourselin S. Fast free-form deformation using graphics processing units. Comput Methods Programs Biomed. 2010 Jun;98(3):278-84.
Figures