2898
Copula Transform Characterizing the Inter-dependence of Multi-parametric Magnetic Resonance Imaging for Glioblastoma Patients1Department of Clinical Neurosciences, University of Cambridge, Cambridge, United Kingdom, 2Department of Neurosurgery, Shanghai Jiao Tong University School of Medicine, Shanghai, United Kingdom, 3The Centre for Mathematical Imaging in Healthcare, Department of Pure Mathematics and Mathematical Statistics, University of Cambridge, Cambridge, United Kingdom, 4Department of Radiology, University of Cambridge, Cambridge, United Kingdom, 5Radiology, Medical Imaging Center, University Medical Center Groningen, Groningen, Netherlands
Synopsis
The purpose of this study was to interrogate the inter-dependence of perfusion and diffusion imaging, and further investigate the clinical relevance of the inter-dependence of perfusion and diffusion, using a glioblastoma cohort containing 115 patients. A statistical method, the empirical copula transform, was applied obtain the joint distribution of perfusion and diffusion imaging, which was then discretized to extract second-order features for hierarchical patient clustering. Three patient subgroups were identified which showed significantly different overall survival and progression-free survival. The results showed that the inter-dependence between perfusion and diffusion imaging may be useful in stratifying patients and evaluating tumor invasiveness.
Introduction
Glioblastoma represents the commonest malignant brain tumors, characterized by dismal prognosis. A highly heterogeneous microstructure and vasculature can be found within glioblastoma, which may create various tumor microenvironment and lead to different phenotypes. A systematic method to investigate the global mismatch between cellularity and vascularity is important. The multi-parametric imaging may describe complementary information including tumor microstructure and vasculature. However, due to the marginal distribution of different imaging modalities, finding validated surrogates to depict the inter-dependence between imaging modalities remains a challenge. Copula transform is a multivariate probability distribution describing the inter-dependence of random variables [1]. The purpose of this study was to interrogate the inter-dependence of microstructure and vasculature using perfusion and diffusion imaging using the copula transform, and to investigate the utility of this approach in tumor invasiveness assessment.Methods
Patients
This study was approved by the local institutional review board. Informed written consent was obtained from all patients. We prospectively recruited 115 patients (mean age 59.3 years, range 22 - 76 years, 87 males) with supratentorial de novo glioblastoma. Patients with history of previous brain tumor, cranial surgery, radiotherapy/chemotherapy, and contraindication for MRI scanning were excluded. All subjects received maximal safe tumor resection and diagnosis was confirmed by pathology. After surgery, temozolomide chemoradiotherapy was performed following the Stupp protocol. The Response Assessment in Neuro-oncology criteria was used to evaluate patient response [2].
Imaging processing and regions of interest
All MRI sequences were pre-operatively acquired using a 3T MRI scanner. MRI sequences include T2-weighted, post-contrast T1-weighted and FLAIR images, as well as dynamic susceptibility contrast (DSC), diffusion tensor imaging (DTI) with inline ADC calculation using b values of 0–1000 sec/mm2. All images were co-registered to T2W images. The relative cerebral blood volume (rCBV) maps were generated from the DSC images after leakage corrected using NordicICE. Contrast-enhancing (CE) regions were manually delineated and cross-validated by three experienced researchers on the co-registered post-contrast T1-weighted images.
Copula transform and patient clustering
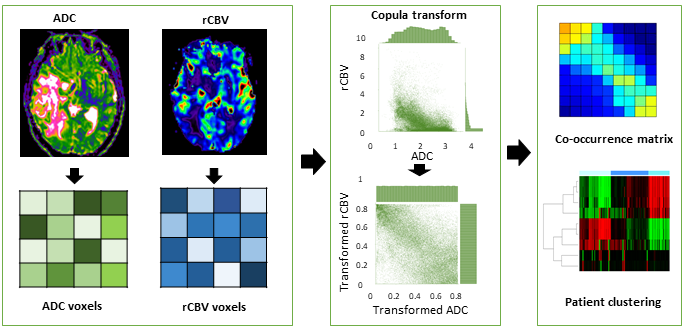
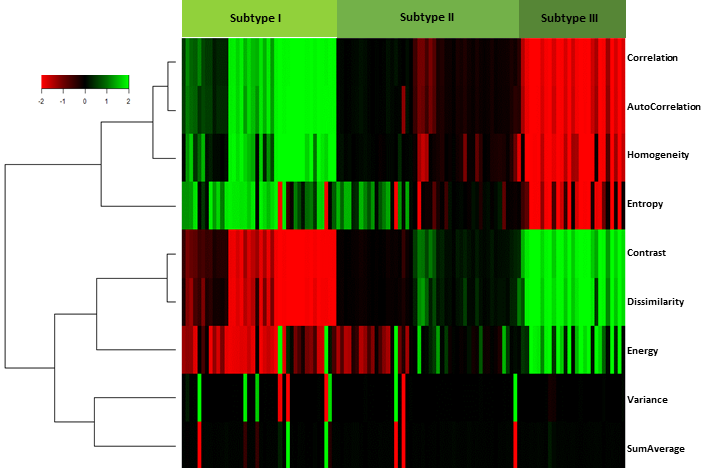
The study design is shown in Figure 1. Empirical copula transform was applied to the ADC and rCBV maps on each patient individually. A discrete feature extraction then was applied to the joint distribution of ADC and rCBV. The extracted features included Energy, Contrast, Entropy, Homogeneity, Correlation, SumAverage, Variance, Dissimilarity, and AutoCorrelation [3]. A hierarchical clustering using complete method was then performed on the patients, based on the extracted features. To find the most stable and unambiguous patient clustering, we varied the number of clusters from 2 to 10. The optimal number of clusters was selected according to the majority vote among the 26 indices as implemented in the R package ‘Nbclust’ [4]. A leave-one-out cross-validation (LOOCV) procedure was applied for constructing and validating the patient clusters.
Statistical analysis
The clinical characteristics of patient clusters were compared with Kruskal-Wallis rank sum test. Kaplan-Meier analysis using Log-rank test was performed to evaluate patient survival. Patients who were alive at the last known follow-up were censored. The hypothesis of no effect was rejected at a two-sided level of 0.05.
Results
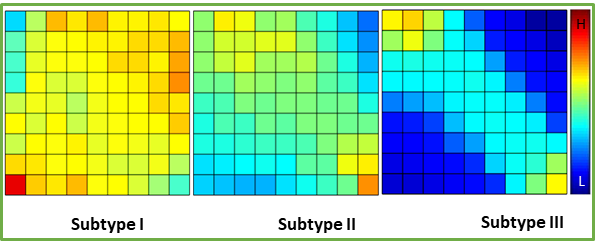
Three patient subgroups were identified from the unsupervised clustering, containing 40 patients (35 %), 48 patients (42 %), and 27 patients (23 %) respectively (Figure 2). The mean values of co-occurrence consensus clustering matrix from LOOCV are 0.91, 0.95 and 0.98 respectively, suggesting that three patient clusters generated from the unsupervised clustering were stable. The average discretized matrix of ADC-rCBV joint distribution demonstrated that subtype I displayed a most uniform joint distribution, and subtype Ⅲ displayed a most diagonalized joint distribution (Figure 3). These subtypes showed no significant differences in clinical characteristics, but were significantly different in patient survivals. Kaplan-Meier analysis using Log-rank test showed significantly different overall survival (P = 0.039) and progression-free survival (P = 0.025) for the three identified subtypes.Discussion
Tumor microstructure estimated from diffusion imaging and vascularity estimated from perfusion imaging can describe the key characteristics associated with tumor pathogenesis. Although existing evidences suggest benefits from combining imaging techniques to identify tumor subregions that are responsible for treatment failure, systematic measures to integrate perfusion and diffusion imaging are lacking. Previous studies have validated the robustness of the copula transform in estimating non-linear correlation in multimodal neuroimaging data [5]. Using this method, our study demonstrated that the inter-dependence of ADC and rCBV and discrete feature extraction can be used to characterize glioblastoma. The results showed that both high and low inter-dependent tumor microvasculature and microstructure were associated with worsened survival, suggesting that the inter-dependence between perfusion and diffusion imaging may provide clinically relevant information.Acknowledgements
The research was supported by the National Institute for Health Research (NIHR) Brain Injury MedTech Co-operative based at Cambridge University Hospitals NHS Foundation Trust and University of Cambridge; The views expressed are those of the author(s) and not necessarily those of the NHS, the NIHR or the Department of Health and Social Care (SJP, project reference NIHR/CS/009/011); Cambridge Trust and China Scholarship Council (CL & SW); CBS acknowledges support from the Leverhulme Trust project on ‘Breaking the non-convexity barrier’, EPSRC grant Nr. EP/M00483X/1, the EPSRC Centre Nr. EP/N014588/1, the RISE projects CHiPS and NoMADS, the Cantab Capital Institute for the Mathematics of Information and the Alan Turing Institute.References
[1] Nelsen RB. An introduction to copulas: Springer Science & Business Media; 2007.
[2] Wen PY, Macdonald DR, Reardon DA, et al. Updated Response Assessment Criteria for High-Grade Gliomas: Response Assessment in Neuro-Oncology Working Group. Journal of Clinical Oncology. 2010;28(11):1963-72.
[3] Haralick RM, Shanmugam K, Dinstein I. Textural Features for Image Classification. Ieee Transactions on Systems Man and Cybernetics. 1973;Smc3(6):610-21.
[4] Charrad M, Ghazzali N, Boiteau V, Niknafs A. Nbclust: An R Package for Determining the Relevant Number of Clusters in a Data Set. Journal of Statistical Software. 2014;61(6):1-36.
[5] Ince RA, Giordano BL, Kayser C, et al. A statistical framework for neuroimaging data analysis based on mutual information estimated via a gaussian copula. Hum Brain Mapp. 2017;38(3):1541-73.
Figures