2814
Monitoring the neurotransmitter response to hypoglycemia in the prefrontal cortex in diabetes using an advanced MRS protocol at 7T1Department of Radiology, University of Minnesota, Minneapolis, MN, United States, 2Department of Medicine, University of Minnesota, Minneapolis, MN, United States
Synopsis
Studies of neurotransmitter response to changing glycemia levels are needed to address mechanisms of cerebral adaptations to hypoglycemia. Here we present an advanced MRS acquisition protocol that combines commercial 7T hardware, dielectric padding, optical motion tracking and frequency and B0 shim correction to ensure optimal stability of data quality during a challenging infusion protocol to maintain euglycemic and hypoglycemic blood glucose levels. Data obtained from the prefrontal cortex in patients with type 1 diabetes demonstrate excellent quality and reproducibility during euglycemia and hypoglycemia, which will allow robust mechanistic investigations of the primary neurotransmitters, glutamate and GABA, under changing glycemic conditions.
Purpose
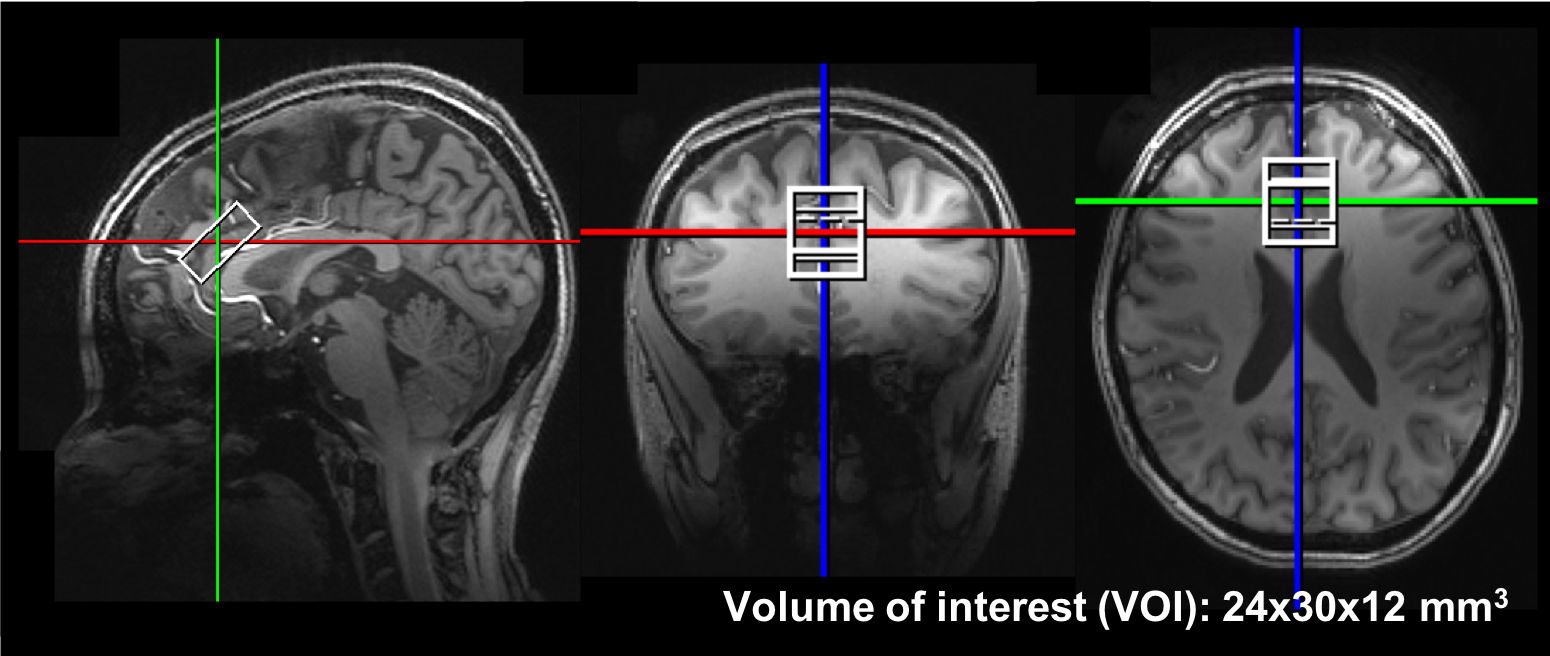
Impaired awareness of hypoglycemia (IAH), which is a diminished ability to perceive the onset of hypoglycemia, triples the risk of potentially fatal severe hypoglycemia [1] for patients with type-1 diabetes (T1D). The primary excitatory and inhibitory neurotransmitters glutamate (Glu) and γ-aminobutyric acid (GABA), were proposed to be involved in the development of IAH [2-4]. Studying Glu and GABA involvement in the mechanism of IAH by MRS requires lengthy MR scans while maintaining eu- and hypoglycemic blood glucose levels in the scanner [3, 5] that typically result in a large rate of experimental failure [5]. Therefore, our goal in this study was to develop a robust MRS protocol to minimize data loss and provide high sensitivity to neurotransmitter changes. We utilized 7T to ensure excellent signal-to-noise ratio (SNR) and reproducibility [6], a commercial RF coil in conjunction with dielectric padding [7] to ensure sufficient B1+ without the need for B1 shimming [8] and real-time motion [9], frequency and shim correction [10] to eliminate data loss due to subject motion. The optimized protocol was evaluated in the prefrontal cortex (PFC) (Figure 1), a region associated with IAH [11], in patients with T1D during consecutive eu- and hypoglycemic clamps.Methods
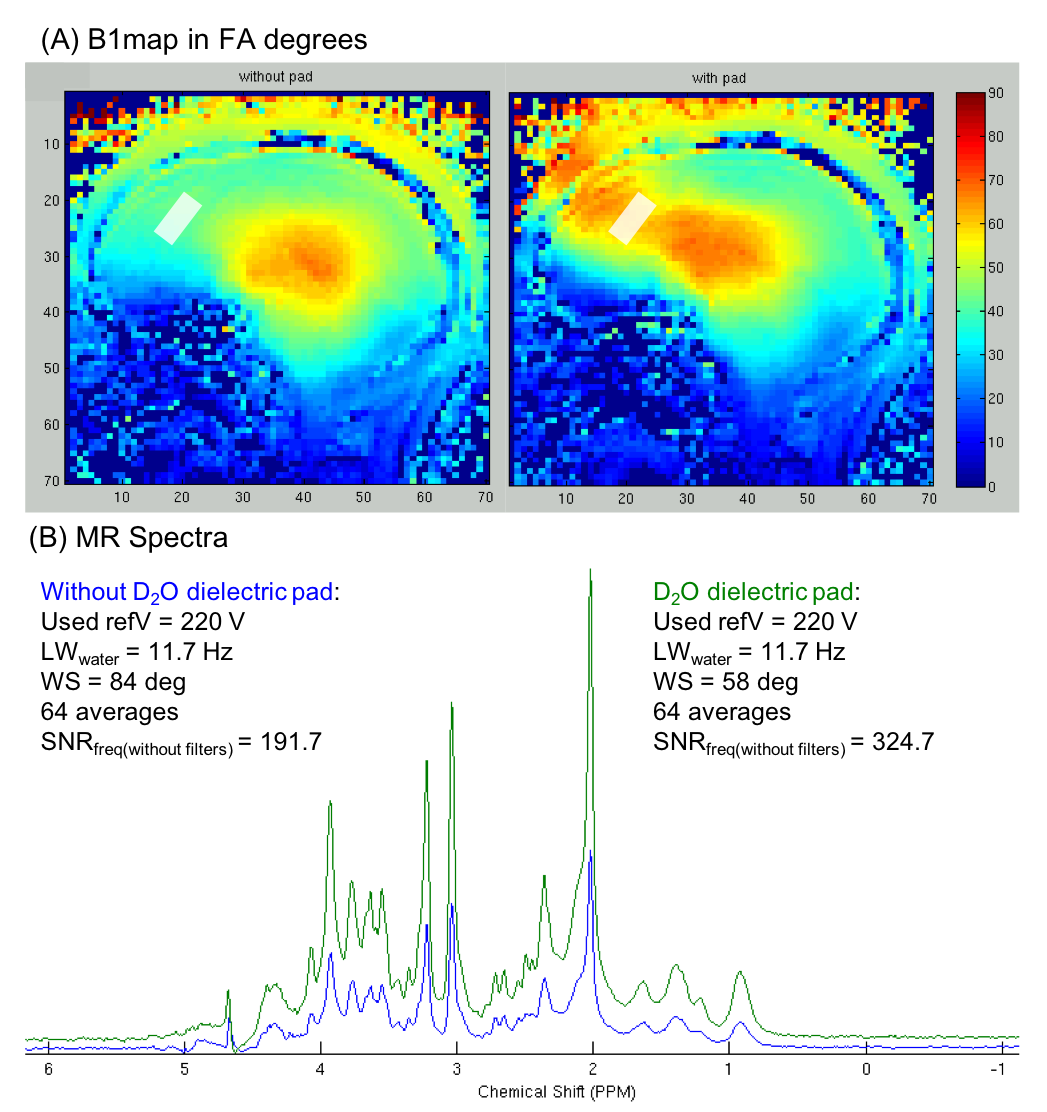
MR experiments were performed using a 7T Siemens scanner and a Nova Medical 1TX/32RX head coil. A barium titanate (BaTiO3, CAS#12047-27-7) dielectric pad (180x100x5.5mm3) prepared with D2O was placed on the forehead of subjects. An optical motion tracking system (MPT high field, Metria) [12] was used to compensate for head movements, in combination with a frequency and shim navigator for first-order B0 shim correction, as described previously [10].
The effect of the dielectric padding on B1+ and SNR was evaluated in 3 healthy volunteers (1 female, 43 ± 22 years). In addition, 4 subjects with T1D (2 females, 28 ± 9 years) were scanned while undergoing euglycemic and hypoglycemic clamps in the scanner, as described previously [3, 5]. FASTMAP [13] was used for voxel-based B0 shimming. MRS data from PFC (24x12x30 mm3) were measured with semi-LASER [14] (TR = 5s, TE = 26ms, 64 transients). Eddy-current, single-shot frequency and phase corrections were performed using MRspa [15] before spectral quantification with LCModel [16] (6.3-0G).
Results
B1+ in the frontal cortex was substantially improved by use of a BaTiO3 dielectric pad (Figure 2), resulting in ~60% gain in SNR (N=3) of sLASER spectra, by allowing 90° excitation and adiabatic RF refocusing with the 7T Nova coil.
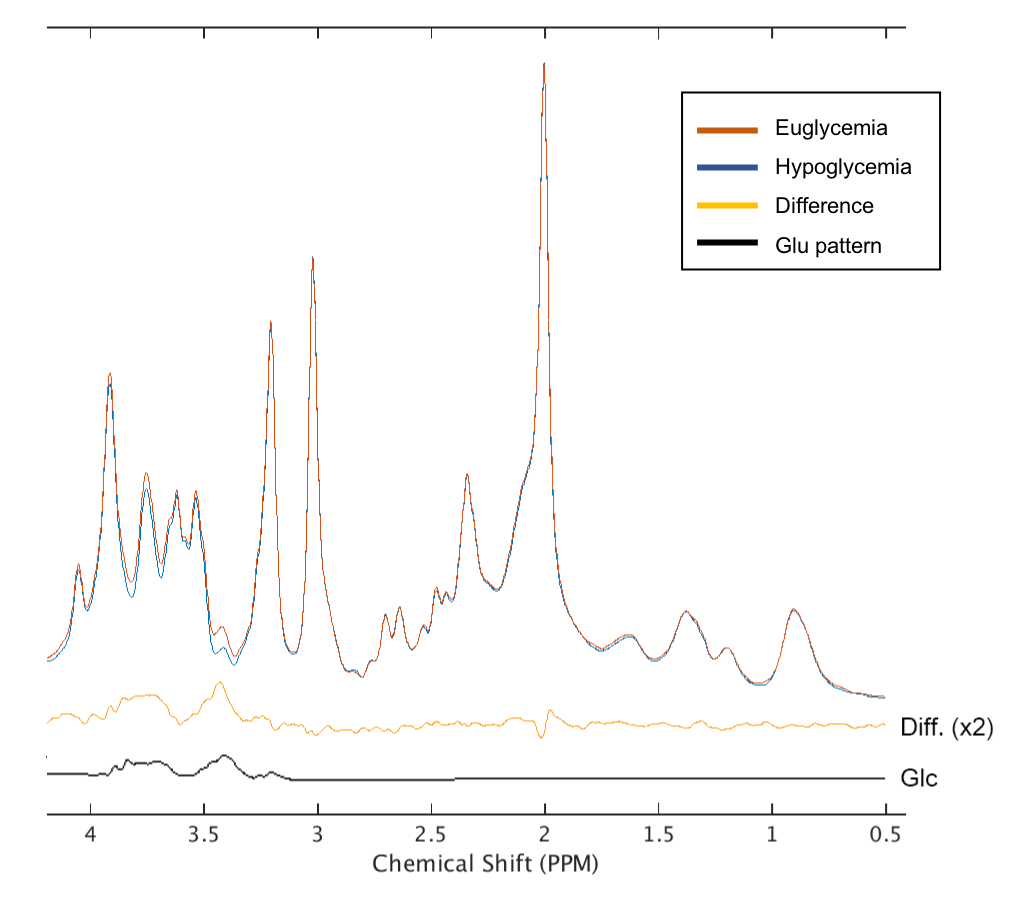
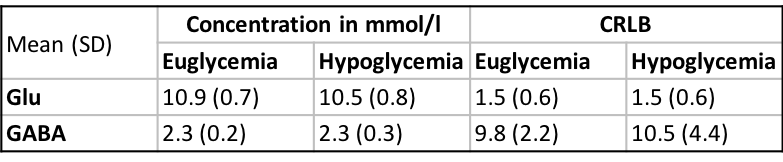
Real-time motion, frequency and first-order B0 shim correction allowed preservation of spectral quality during the 1-1.5 hours patients with T1D underwent the eu- and hypoglycemic clamps (Figure 3). Spectral quality metrics of 5 minute-spectra obtained during euglycemia (across-subject mean of plasma glucose 109.2 ± 13.4 mg/dL) and hypoglycemia (plasma glucose 51.3 ± 2.3 mg/dL) were not different (p = 0.27 for SNR; p=0.53 for linewidths; paired, 2-tailed t-test) (Table 1). The spectral quality allowed quantification of 14 metabolites (Asp, Cr, Gln, Glu, GABA, GSH, GPC, Ins, Lac, PCr, PE, NAA, NAAG, Tau) with CRLB<20%. PFC MRS data clearly showed a lower glucose contribution in the hypoglycemia vs. euglycemia spectra (Figure 3). Cramer-Rao lower bounds (CRLB) of the neurotransmitters of interest, Glu and GABA, were the same during eu- and hypoglycemia (p=1 for Glu; p=0.55 for GABA; paired, 2-tailed t-test) (Table 2) and indicated exquisite sensitivity to detect subtle changes in neurotransmitter concentrations.
Discussion
Here we demonstrate a highly optimized 7T MRS protocol that combined a commercial RF coil, dielectric padding, optical motion tracking and frequency and B0 shim correction to ensure optimal stability of data quality during a challenging infusion protocol to maintain euglycemic and hypoglycemic blood glucose levels in patients. The use of dielectric pad boosted RF energy delivery to the PFC, allowing adiabaticity in sLASER at short TE and thereby optimal SNR. Real time motion, frequency and B0 shim correction enabled acquisition of high-quality spectra throughout the prolonged MR sessions.
CRLB of Glu and GABA indicated excellent reproducibility during both eu- and hypoglycemia. Finally, a trend for reduction in cortical Glu levels in response to hypoglycemia was consistent with prior reports in the occipital cortex [2, 3], but a larger sample is needed to confirm this response in the PFC.
Acknowledgements
R01 NS035192, P41 EB015894, P30 NS076408.References
1. Clarke, W.L., et al., Reduced awareness of hypoglycemia in adults with IDDM. A prospective study of hypoglycemic frequency and associated symptoms. Diabetes Care, 1995. 18(4): p. 517-22.
2. Bischof, M.G., et al., Cerebral glutamate metabolism during hypoglycaemia in healthy and type 1 diabetic humans. Eur J Clin Invest, 2006. 36(3): p. 164-9.
3. Terpstra, M., et al., Changes in human brain glutamate concentration during hypoglycemia: insights into cerebral adaptations in hypoglycemia-associated autonomic failure in type 1 diabetes. J Cereb Blood Flow Metab, 2014. 34(5): p. 876-82.
4. Chan, O., et al., Increased GABAergic tone in the ventromedial hypothalamus contributes to suppression of counterregulatory responses after antecedent hypoglycemia. Diabetes, 2008. 57(5): p. 1363-70.
5. Moheet, A., et al., Initial experience with seven tesla magnetic resonance spectroscopy of hypothalamic GABA during hyperinsulinemic euglycemia and hypoglycemia in healthy humans. Magn Reson Med, 2014. 71(1): p. 12-8.
6. Terpstra, M., et al., Test-retest reproducibility of neurochemical profiles with short-echo, single-voxel MR spectroscopy at 3T and 7T. Magn Reson Med, 2016. 76(4): p. 1083-91.
7. Yang, Q.X., et al., Manipulation of image intensity distribution at 7.0 T: Passive RF shimming and focusing with dielectric materials. Journal of Magnetic Resonance Imaging, 2006. 24(1): p. 197-202.
8. Emir, U.E., et al., Regional neurochemical profiles in the human brain measured by (1)H MRS at 7 T using local B(1) shimming. NMR Biomed, 2012. 25(1): p. 152-60.
9. Maclaren, J., et al., Prospective motion correction in brain imaging: a review. Magn Reson Med, 2013. 69(3): p. 621-36.
10. Deelchand, D.K., et al. Prospective motion and B0 shim correction for MRS at 7 T in 26th meeting of International Society of Magnetic Resonance in Medicine. 2018. Paris, France.
11. Dunn, J.T., et al., Attenuation of amydgala and frontal cortical responses to low blood glucose concentration in asymptomatic hypoglycemia in type 1 diabetes: a new player in hypoglycemia unawareness? Diabetes, 2007. 56(11): p. 2766-73.
12. Zaitsev, M., et al., Magnetic resonance imaging of freely moving objects: prospective real-time motion correction using an external optical motion tracking system. Neuroimage, 2006. 31(3): p. 1038-50.
13. Gruetter, R. and I. Tkac, Field mapping without reference scan using asymmetric echo-planar techniques. Magnetic Resonance in Medicine, 2000. 43(2): p. 319-323.
14. Oz, G. and I. Tkac, Short-Echo, Single-Shot, Full-Intensity Proton Magnetic Resonance Spectroscopy for Neurochemical Profiling at 4 T: Validation in the Cerebellum and Brainstem. Magnetic Resonance in Medicine, 2011. 65(4): p. 901-910.
15. Deelchand, D.K., MRspa: Magnetic Resonance signal processing and analysis. 2016, https://www.cmrr.umn.edu/downloads/mrspa/: Minneapolis, Minnesota, U.S.A.
16. Provencher, S.W., Estimation of Metabolite Concentrations from Localized in-Vivo Proton Nmr-Spectra. Magnetic Resonance in Medicine, 1993. 30(6): p. 672-679.
Figures