2785
Progressive Supranuclear Palsy versus Parkinson’s disease-related damage using quantitative multimodal MRI1CENIR, ICM, Paris, France, 2Neuroradiology, APHP, Pitie Salpêtrière, Paris, France, 3Sorbonne Universite, Univ Paris 06, UMR S 1127, CNRS UMR 7225, ICM, Paris, France, 4Clinique des mouvements anormaux, Département des Maladies du Système Nerveux, Hôpital Pitié-Salpêtrière, PARIS, France, 5NeuroSpin, CEA, Gif-Sur-Yvette, France
Synopsis
Our primary objective was to generate a precise in vivo model of neurodegeneration of brainstem nuclei, cerebellum, basal ganglia, basal forebrain, and cortex using multimodal MRI in progressive supranuclear palsy (PSP). Secondary objective was to use multimodal imaging biomarkers to efficiently differentiate PSP from Parkinson disease (PD) patients and healthy control subjects (HC). Multiple factorial analyses of the regional damage allowed to efficiently differentiate PSP from HC and PD, in agreement with previous pathological studies. These results suggest the possibility of direct non-invasive assessment of brain damage at multiple level of the central nervous system in PSP and efficient multimodal multiregional based differential diagnosis between PSP and PD patients
INTRODUCTION
Progressive supranuclear palsy (PSP) is a neurodegenerative disorder, whose definite diagnosis is based on postmortem histological brain examination.1-2 Lesions are evidenced in the basal ganglia (putamen, globus pallidus, subthalamic nucleus (STN), the nucleus basalis of Meynert (NBM), midbrain, substantia nigra (SN), pedunculopontine nucleus (PPN), pons and locus coeruleus (LC).2-3 Previous MRI studies have observed volume decrease and diffusion imaging changes in PSP patients mostly the basal ganglia and the mesencephalon.4-5 Still, diagnosis can be challenging, especially in early stages of the disease. In this study we aimed to generate a precise in vivo model of PSP brain neurodegeneration. Additionally, we aimed to test a comprehensive model using the multimodal imaging biomarkers in order to efficiently differentiate PSP from Parkinson disease (PD) patients and from healthy controls (HC).METHODS
Subjects: Eleven patients with PSP (mean age: 61.7±7.8 years, disease duration: 3.8±1.5 years) were compared with 26 age-matched HC (mean age 60.8±8.3 years) and 51 age-matched PD patients (mean age: 60.6±8.9 years, disease duration: 8.9±3.5 years). Clinical examination included the Unified Parkinson’s Disease Rating Scale and extensive neuropsychological assessment.
MRI data acquisition: MRI acquisition was performed using a 3 Tesla TRIO TIM system (Siemens, Erlangen, Germany) using a 12-channel receive-only head coil. The protocol included three-dimensional (3D) T1-weighted (T1-w) images, 3D T2-weighted (T2-w) images, diffusion tensor imaging (DTI) and R2* mapping. Neuromelanin (NM)-sensitive images were acquired using two-dimensional (2D) axial turbo spin echo T1-w images (TR/TE/flip angle: 900ms/15ms/180°, voxel size: 0.4*0.4*3mm3, 3 averages). The DTI parameters were as follows: TR/TE/flip angle =14000ms/101ms/90°, voxel size = 1.7*1.7*1.7mm3, b-value=1500s/mm2, 60 diffusion gradients directions). R2* mapping was computed using a gradient-echo planar sequence with 6 TEs (range, 24-94 ms), TR/flip angle: 9000 ms/90° and voxel size: 2*2*2 mm3. T2*-w high-resolution images were also acquired at 7 Tesla with the following parameters: TR/TE/flip angle: 2180ms/29.9ms/65°, field of view: 192 mm2, voxel size of 0.5x0.5x0.5 mm3, 40 slices.
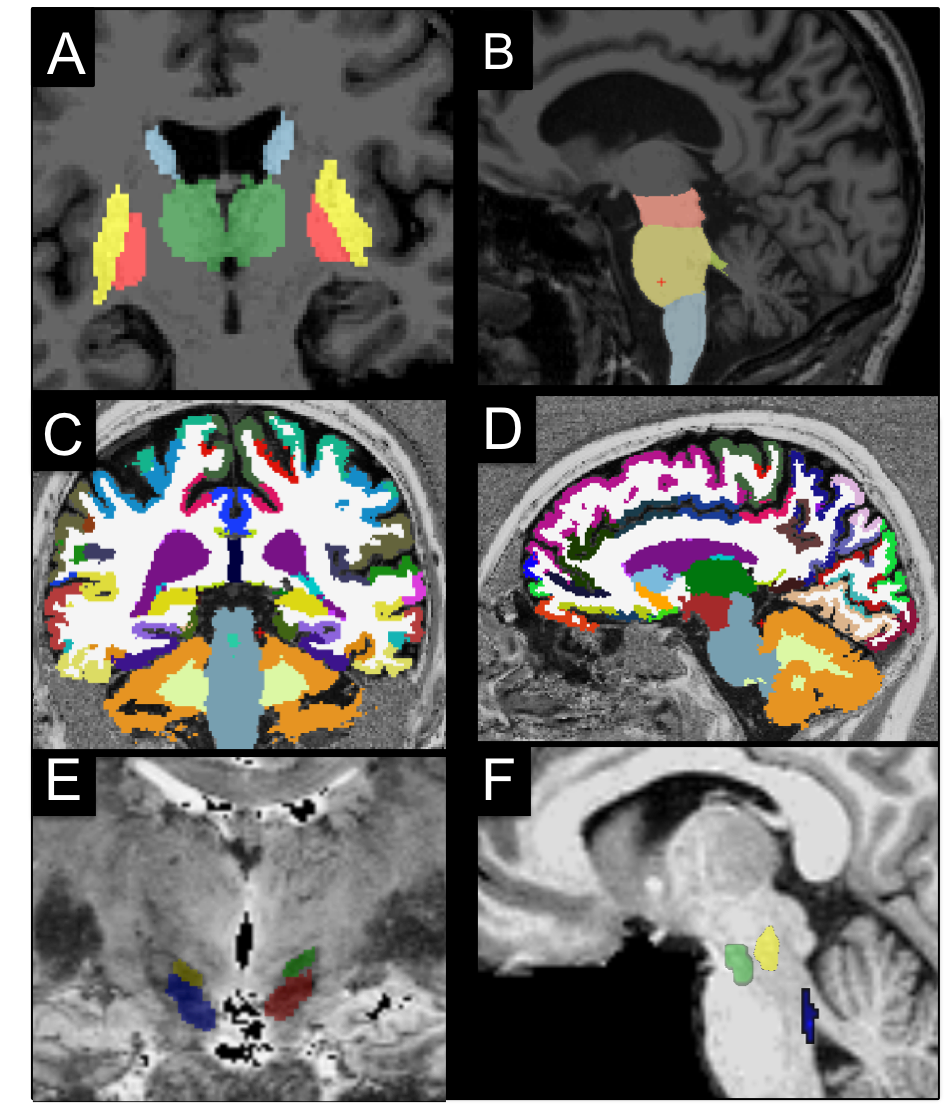
Image analysis: Image processing and analysis were performed using in-house software written in MATLAB. The regions of interest (ROIs) were segmented automatically in the basal ganglia and brainstem as well as in cortical and subcortical regions using FreeSurfer (http://freesurfer.net/, MGH, Boston, MA, USA) software (Figure 1). ROIs were drawn manually at 3T in the SN using NM images, and in the NBM using T1-w and T2-w images, and at 7T in the STN using T2*-w images. The locus coeruleus (LC), cuneiform nucleus and PPN were segmented semi-automatically with in-house software.6-7 Volume, R2*, fractional anisotropy (FA), and mean diffusivities (MD) were calculated in the ROIs.
Statistical analysis: The statistical analysis was performed using R. Based on cut-off values and local extrema, we defined three damage levels that were associated to each subject and region. A multiple factor analysis (MFA) was performed to determine the underlying structure of the data using a data-driven technique. Variables describing the same brain regions were grouped together to form blocks. MFA was then run on the subsets associated each to a brain region. As a first step, individual PCA was performed on each block, which then was normalized by the corresponding first Eigen value. Obtained matrices are then merged to form a global matrix and a global PCA is performed. The individual observations are then projected onto the global space to determine the differences and similarities between the individual groups and the relationships between the brain regions.
RESULTS
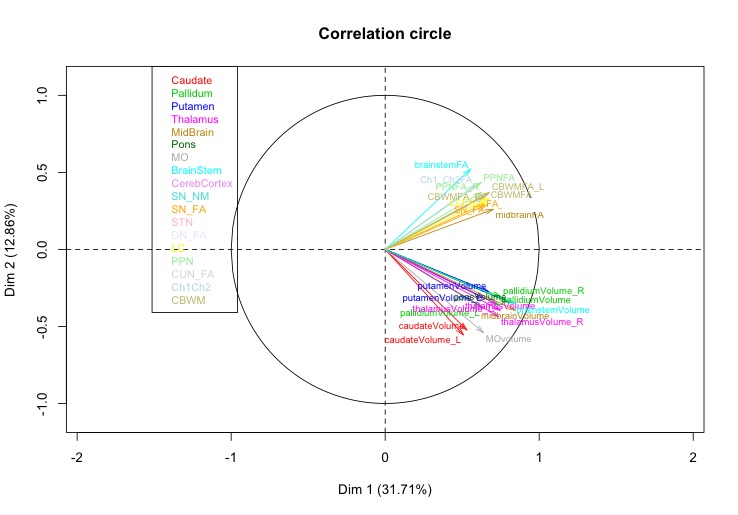
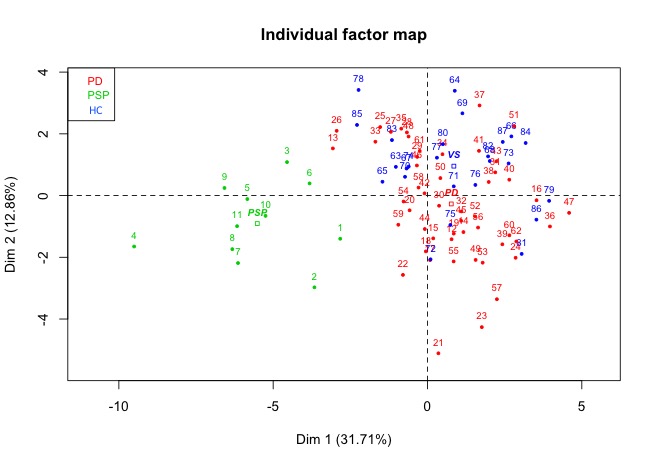
Using the damage level computation model combining all the biomarkers patients with PSP showed extensive damage that predominated in the midbrain, SN, STN, globus pallidus, LC and PPN. MFA showed an excellent separation between PSP and PD (Figure 2). Eigen values from the global PCA indicated that the first three factors explained 33%, 18%, and 10% of the total variance. The first component (pallidum, putamen, thalamus, midbrain, pons and cerebellar white matter) separated clearly HC from PSP and PD while the second component (caudate nucleus, medulla oblongata and cerebellar cortex) separated PSP and PD (Figure 3).DISCUSSION
MFA, using multimodal MRI biomarkers, including brainstem and basal ganglia regions, namely the midbrain, SN, STN, globus pallidus, LC, and PPN, allowed excellent characterization of PSP in line with previous pathological studies. Moreover MFA allowed to differentiate PSP patients from PD and HC.
CONCLUSION
Our results showed that quantitative MRI biomarkers allowed to evidence extensive brain damage in PSP patients in basal ganglia regions and in brainstem and basal forebrain structures corresponding to those previously reported in pathological studies. A model considering the combination of the above-mentioned biomarkers allowed to efficiently differentiate PSP patients from both PD and HC.Acknowledgements
ANR nucleipark, DHOS-Inserm, France Parkinson, ENP and the Investissements d'Avenir, IHU-A-ICM, Paris Institute of Translational neuroscience ANR- 10-IAIHU-06References
1. Colosimo C, Bak TH, Bologna M, Berardelli A. Fifty years of progressive supranuclear palsy. J Neurol Neurosurg Psychiatry, 2014; 85(8):938-44
2. Steele JC, Richardson JC, Olszewski J. Progressive supranuclear palsy. A heterogeneous degeneration involving the brain stem, basal ganglia and cerebellum with vertical gaze and pseudobulbar palsy, nuchal dystonia and dementia. Arch Neurol 1964; 10:333–359
3. David R Williams, Andrew J Lees. Progressive supranuclear palsy: clinicopathological concepts and diagnostic challenges. Lancet Neurol 2009; 8: 270– 79
4. Zanignia S, Calandra-Buonaura G, Manners DN et al., Accuracy of MR markers for differentiating Progressive Supranuclear Palsy from Parkinson's disease. NeuroImage: Clinical. 2016; 736–742
5. Piattella MC, Upadhyay N, Bologna M, Neuroimaging evidence of gray and white matter damage and clinical correlates in progressive supranuclear palsy. J Neurol. 2015; 262(8):1850-8.
6. Bardinet E, Bhattacharjee M, Dormont D et al., A three-dimensional histological atlas of the human basal ganglia. II. Atlas deformation strategy and evaluation in deep brain stimulation for Parkinson disease. J Neurosurg. 2009; 110(2):208-19
7. García-Lorenzo D, Longo-Dos Santos C, Ewenczyk C, et al. The coeruleus/subcoeruleus complex in rapid eye movement sleep behaviour disorders in Parkinson’s disease. Brain J Neurol. 2013;136:2120–2129
Figures