2709
Comparison of Phase-Sensitive Inversion Recovery from MPRAGE and MP2RAGE1Global MR Applications & Workflow, GE Healthcare Canada, Vancouver, BC, Canada, 2Division of Neurology, Department of Pediatrics, BC Children’s Hospital and University of British Columbia, Vancouver, BC, Canada, 3Global MR Applications & Workflow, GE Healthcare, Rochester, MN, United States
Synopsis
In this work, we obtained phase sensitive inversion recovery (PSIR) signal from MPRAGE and MP2RAGE sequences. Both PSIR images have better image contrast than magnitude images. The PSIR from MPRAGE requires shorter acquisition time, however, PSIR from MP2RAGE provides better contrast and has no $$$B_1$$$ field inhomogeneity effect. Selection of which PSIR technique to use may depend on study aims.
INTRODUCTION
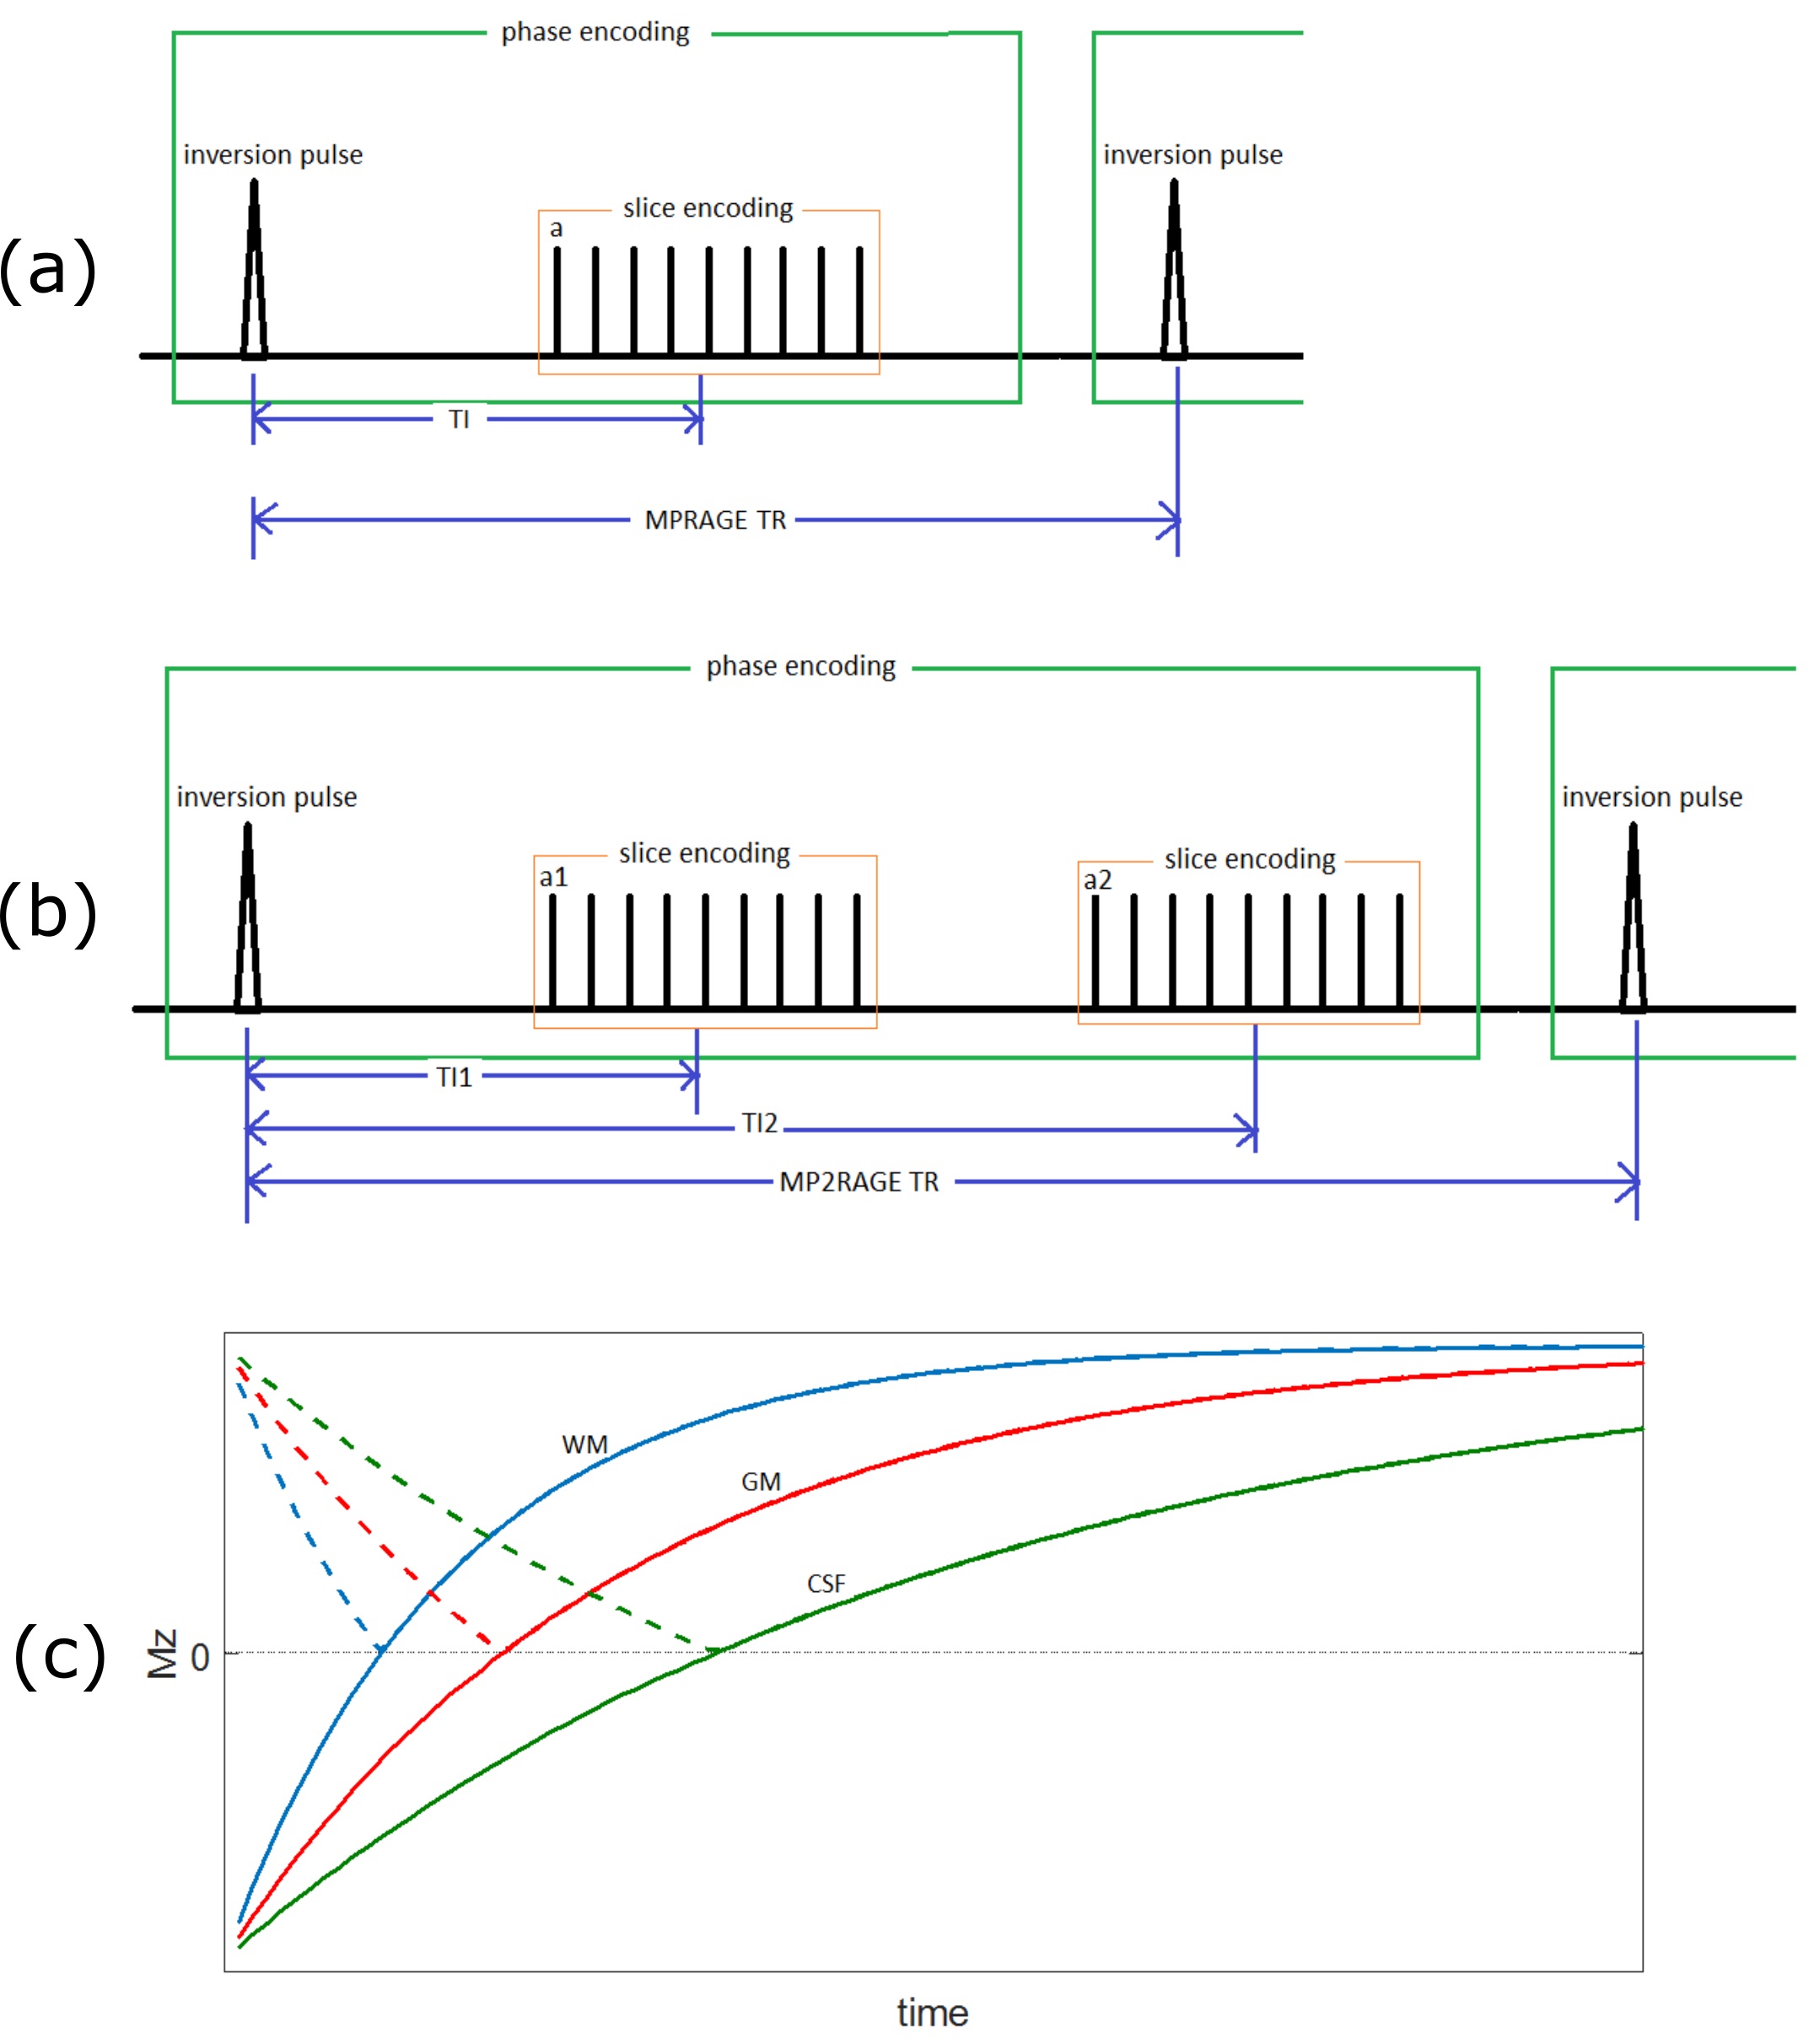
PSIR holds promise for a number of clinical neuroradiologic applications(1,2). In PSIR imaging, the longitudinal magnetization ($$$M_z$$$) is first inverted by a 180° radiofrequency (RF) pulse, and then allowed to recover by $$$T_1$$$ relaxation during an inversion time (TI). As shown in Figure 1 (a) and (b), the Magnetization-Prepared Rapid Acquisition Gradient Echoes (MPRAGE) sequence and Magnetization-Prepared 2 Rapid Acquisition Gradient Echoes (MP2RAGE) sequence both start with a 180° RF pulse (3,4), so PSIR images can be obtained.
For the MPRAGE sequence, the phase-sensitive reconstruction method is based on the local phase statistics, assuming smooth background phase and a region-growing algorithm (5). PSIR will restore the real magnetization (solid lines) from the magnitude magnetization (dash lines), as shown in Figure 1(c).
For MP2RAGE sequences, the PSIR images can be obtained by (6):
$$$PSIR=\frac{\pm\left|SI_{1}\right|}{\left|SI_{1}\right|+\left|SI_{2}\right|}$$$ [1]
Where $$$SI_{1}$$$ and $$$SI_{2}$$$ are the images from the first and second MP2RAGE data acquisition. The polarity of $$$\left|SI_{1}\right|$$$ was defined as being negative if the phase change between $$$SI_{1}$$$ and $$$SI_{2}$$$ voxels lie in the range $$$\pi/2$$$ and $$$3\pi/2$$$.
METHODS
All experiments were performed on a 3T GE Discovery MR750 scanner (GE Healthcare, Waukesha, WI) with a GE 32-Channel head coil on three healthy adult volunteers. They all provided signed, informed consent prior to participation. The subjects were asked to stay still during the scan.
For MPRAGE-PSIR, the sequence was prescribed to cover a sagittal slab. The coil combined complex images were saved for the phase-sensitive reconstruction. The TI value was optimized for best PSIR image contrast.
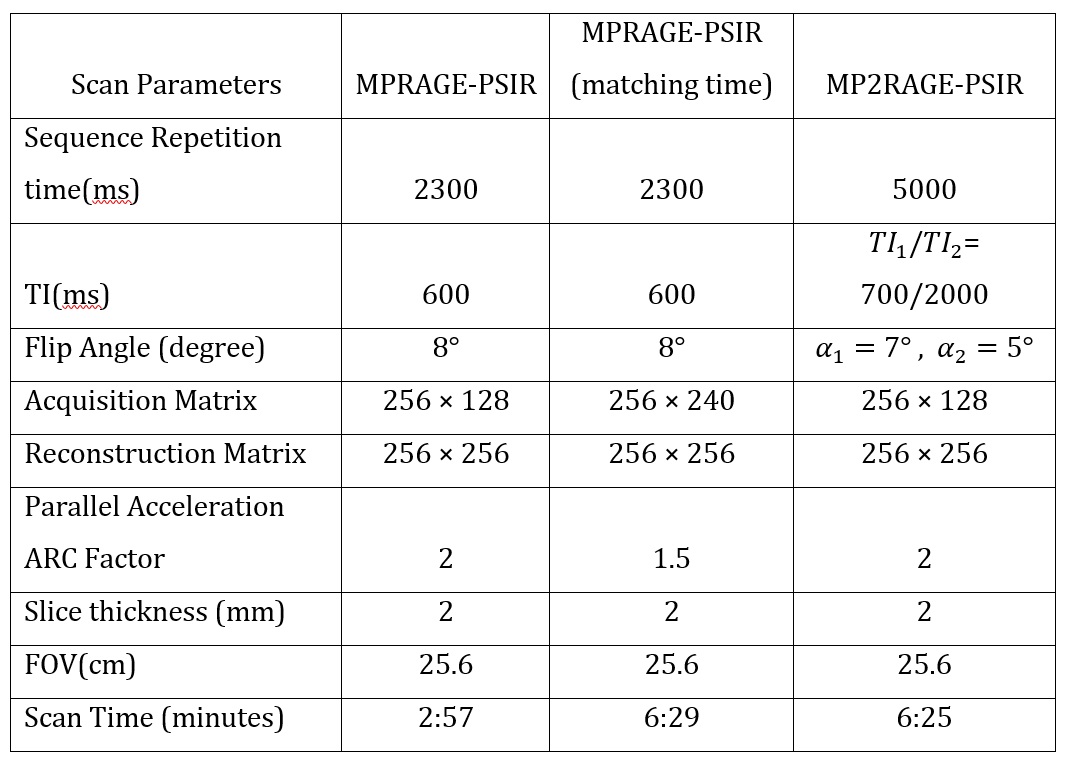
For MP2RAGE-PSIR, the sequence was prescribed after MPRAGE with matching FOV, image voxel size using the optimized parameters from the literature(4), shown in Table 1. Complex images for each coil, $$$({SI_1})_{coil_i}$$$ and $$$({SI_2})_{coil_i}$$$, were obtained during the data acquisition, and $$$({PSIR})_{coil_i}$$$ was obtained using Equation [1]. The coil combined PSIR was calculated with optimal weighted average(7).
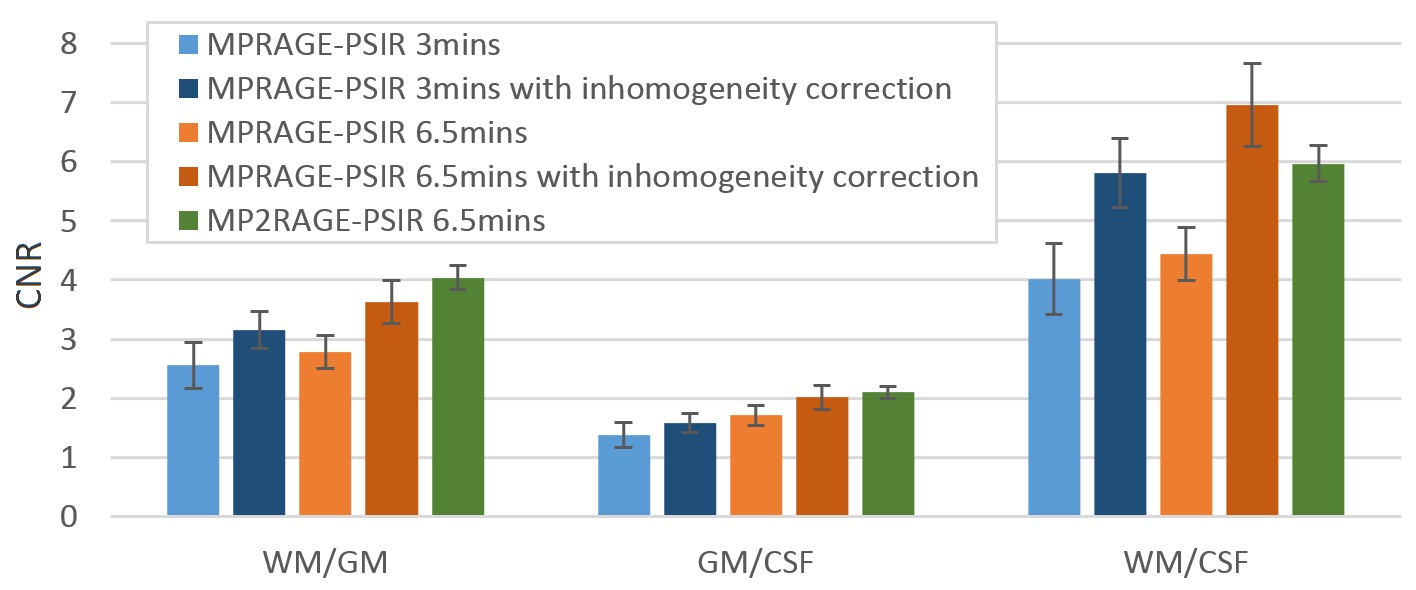
Data analysis was performed on the 3D volumes of MPRAGE-PSIR and MP2RAGE-PSIR brain images using the SPM 8 (Statistical Parametric Mapping) software package (8). Regions of interest (ROIs) were separated for white matter (WM), grey matter (GM), and cerebrospinal fluid (CSF), and inhomogeneity was corrected for MPRAGE-PSIR images. The contrast-to-noise ratios (CNR) were calculated for WM/GM, GM/CSF, and WM/CSF according to the equation $$$CNR=\frac{(S_a-S_b)}{\sqrt{({SD_{a}}^{2} +{SD_{b}}^{2})/2)}}$$$, where $$$S_a$$$ (or $$$S_b$$$) is the mean signal intensity and $$$SD_a$$$ (or $$$SD_b$$$) is the standard deviation of tissue $$$a$$$ (or $$$b$$$) within the ROI (9).
RESULTS
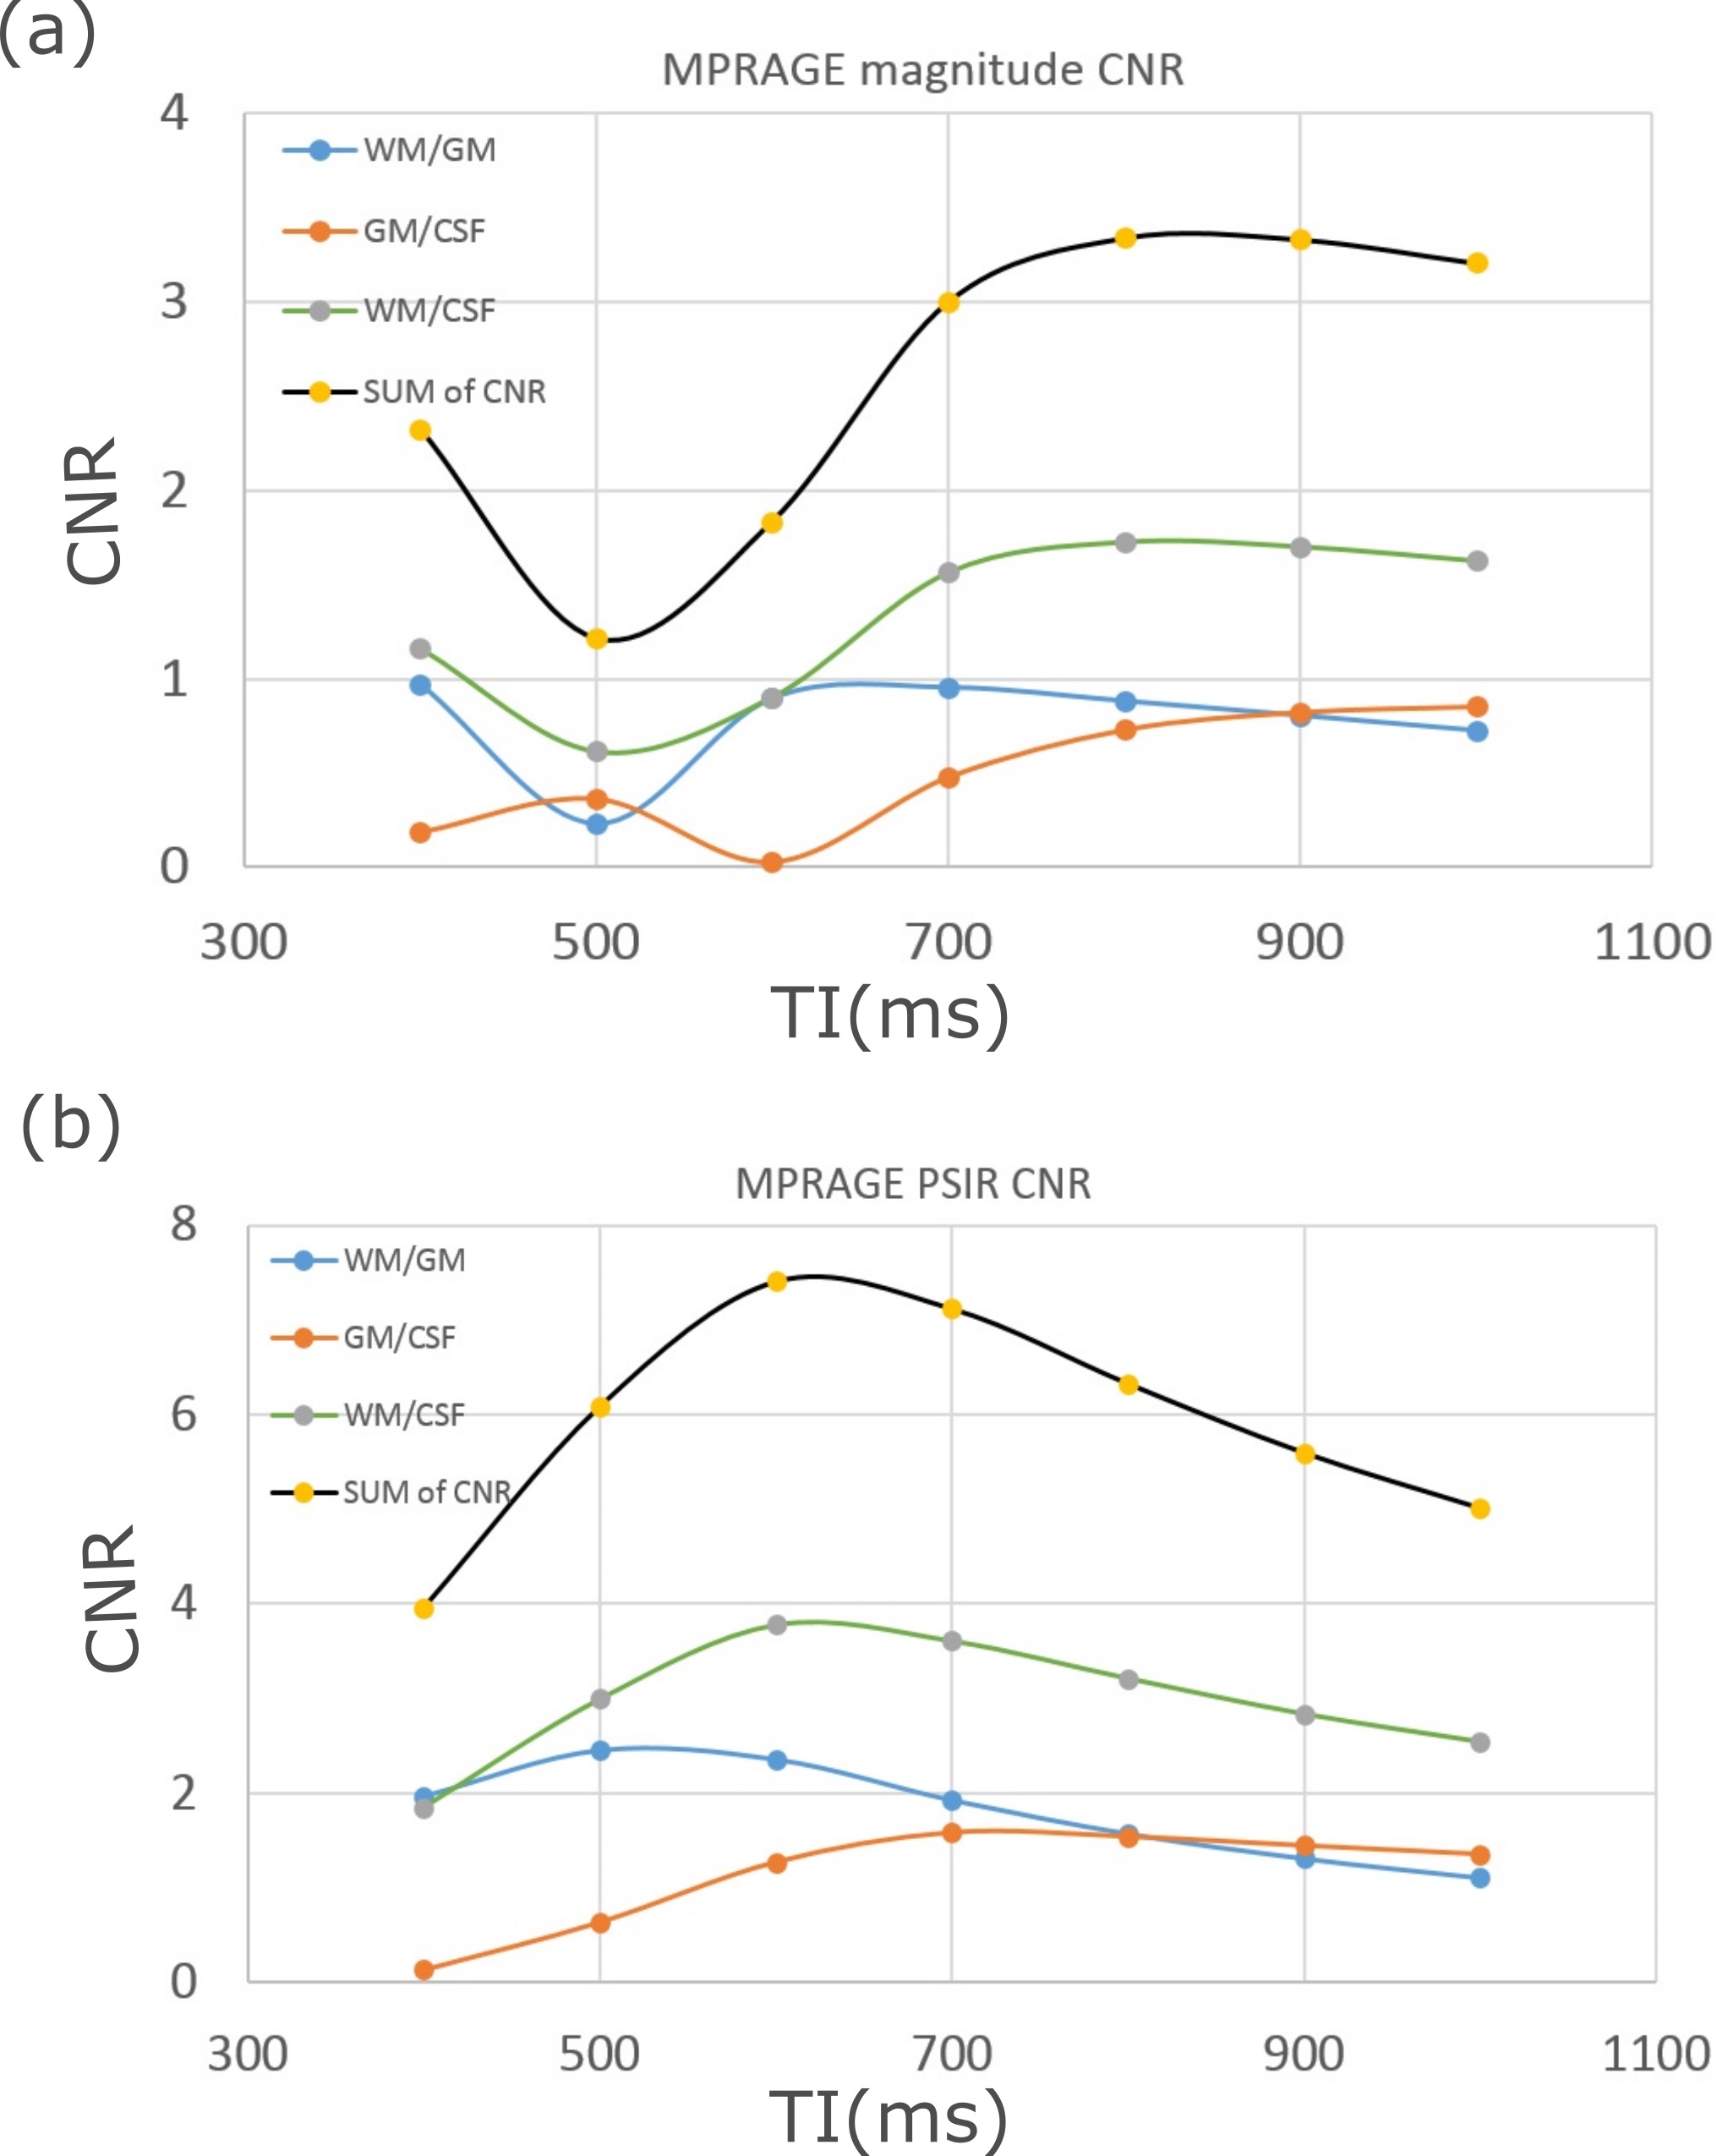
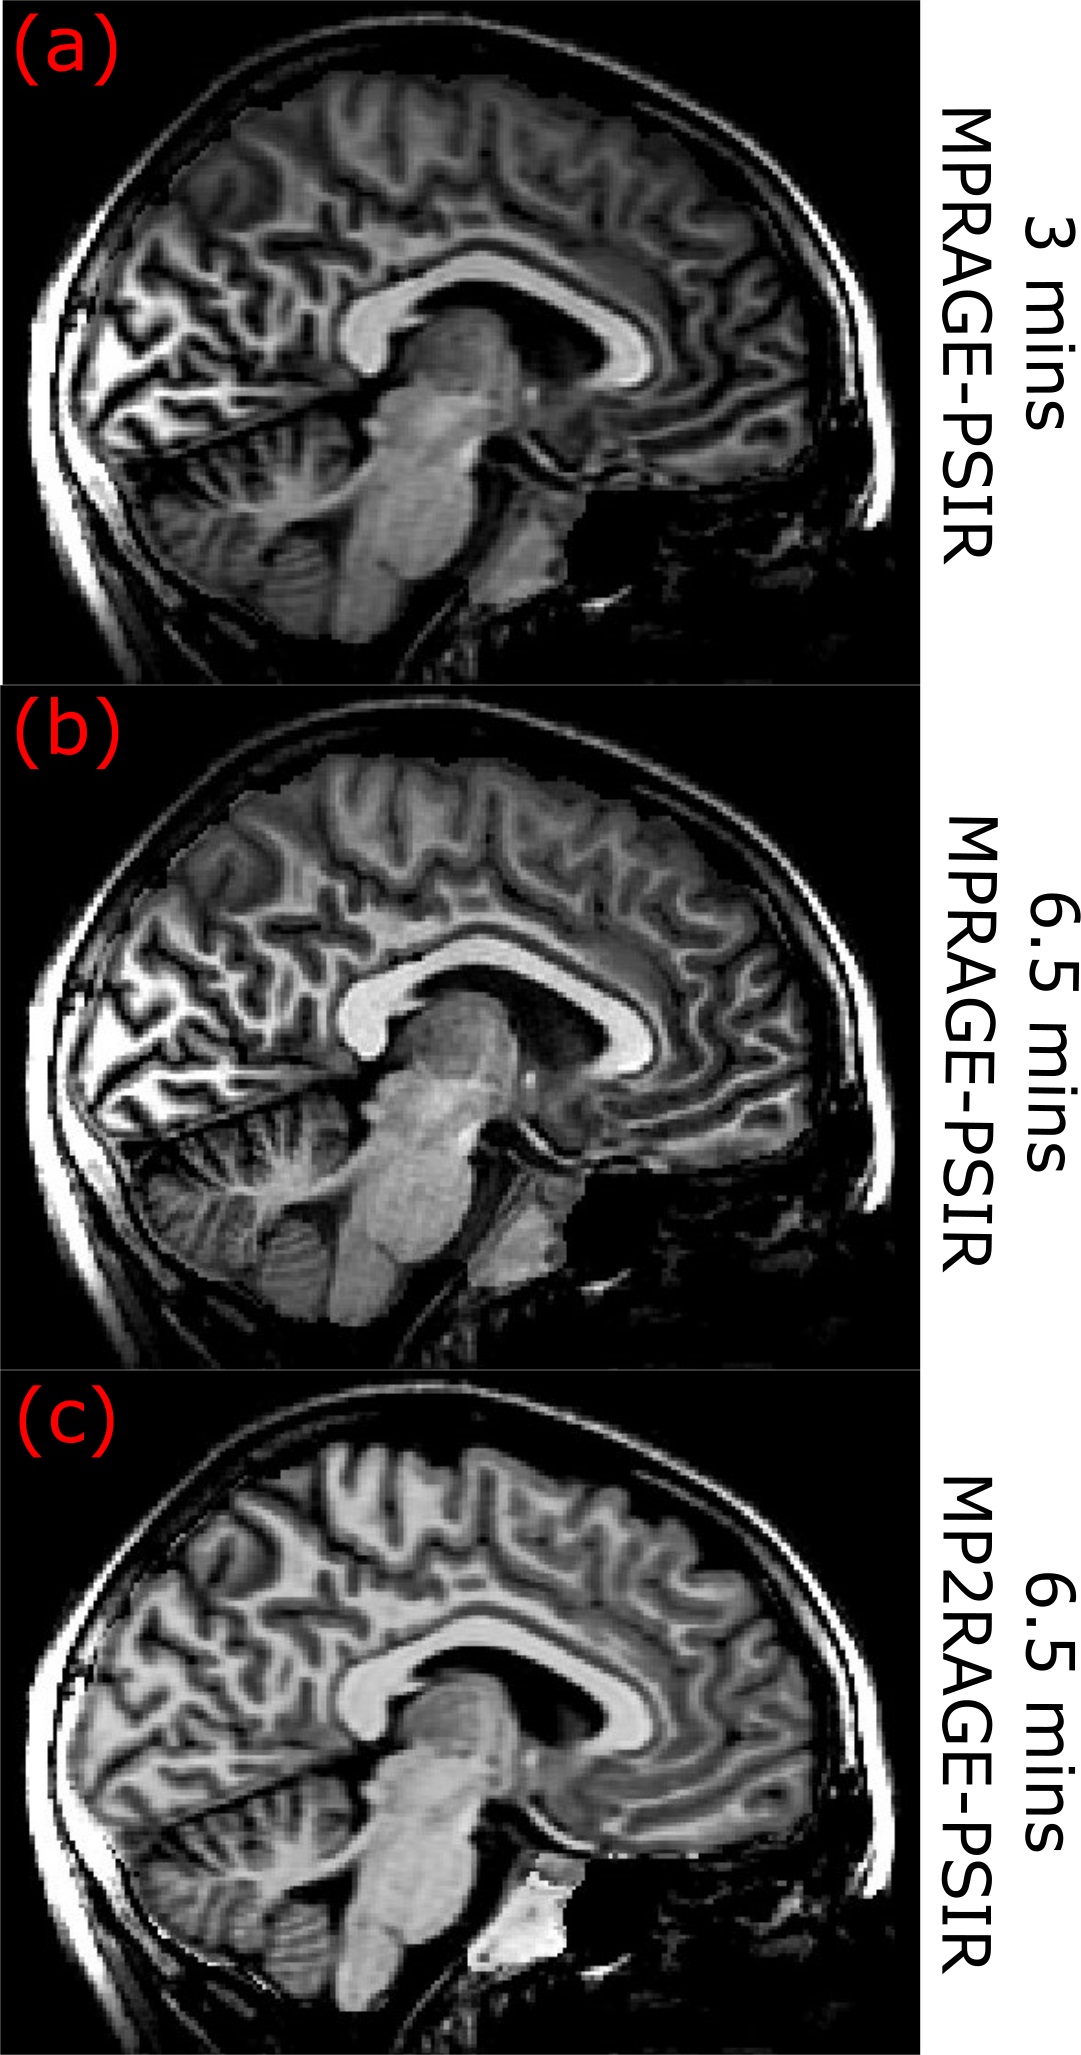
For MPRAGE sequence, the CNR for brain volume ROIs versus TI are shown in Figure 2. For MPRAGE-PSIR images (Figure 2(b)), summated CNR is largest at TI≈600ms, and is greater than the maximum summated CNR from MPRAGE magnitude image (Figure 2(a)), at TI≈900ms. Figure 3 (a-c) shows the representative MPRAGE-PSIR at optimal TI, and MP2RAGE-PSIR images. Upon visual inspection, the 6.5 minutes MPRAGE-PSIR shows better details in brain structure compared to the rest (e.g. unsmoothed cerebellar fissures), while the MP2RAGE-PSIR shows better image contrast and intensity uniformity.
Figure 4 compares the CNR of MPRAGE-PSIR and MP2RAGE-PSIR for different ROIs. The CNR is increased from the 6.5 minutes MPRAGE-PSIR compared to the 3 minutes MPRAGE-PSIR. However, the CNRWM/GM from MP2RAGE-PSIR is 45% greater than CNRWM/GM from equivalent scan time MPRAGE-PSIR. With SPM 8 inhomogeneity correction applied, the CNR of MPRAGE-PSIR images can be improved, resulting in 6.5 minutes MPRAGE-PSIR images with similar CNR as the MP2RAGE-PSIR images.
DISCUSSION
Both MPRAGE-PSIR and MP2RAGE-PSIR provide good tissue contrast in brain images. With matching FOV and resolution, MPRAGE-PSIR has a shorter acquisition time (2:57 mins) compared to MP2RAGE-PSIR (6:25 mins), but, the CNR from MP2RAGE-PSIR is greater overall.
MPRAGE-PSIR does not address the $$$B_1$$$ inhomogeneity effect (as shown in Figure 3(a)) and requires offline correction for better CNR, while the MP2RAGE-PSIR image is $$$B_1$$$ inhomogeneity corrected as evident in Equation [1]. The CNR from 6.5 minutes MPRAGE-PSIR image with offline inhomogeneity correction applied has comparable CNR to the MP2RAGE-PSIR images, but with finer details of the brain resolved upon visual inspection. Because the MP2RAGE-PSIR image is obtained from the images $$$SI_{1}$$$ and $$$SI_{2}$$$ at two inversion times, a $$$T_1$$$ map could also be derived from MP2RAGE-PSIR image, which can not be obtained from MPRAGE-PSIR.
CONCLUSION
We have compared two PSIR methods from MPRAGE and MP2RAGE sequences. Both methods produced improved tissue contrast in brain images. MPRAGE-PSIR can be acquired in a short time and achieve comparable CNR when additional non-uniformity correction is applied, while MP2RAGE-PSIR can provide better image contrast without the $$$B_1$$$ inhomogeneity effect. Our investigations will be helpful for further PSIR studies at different magnetic field strength to draw attention to brain areas.Acknowledgements
We thank Michelle Lau for her assistance in data collection. We thank Suchandrima Banerjee for the good comments and suggestions. We also thank everyone in BC Children’s MR Research facility and all the healthy volunteers for the help.References
1. Ma J. Multislice and multicoil phase-sensitive inversion-recovery imaging. Magn. Reson. Med. 2005;53:904–910.
2. Hou P, Hasan KM, Sitton CW, Wolinsky JS, Narayana PA. Phase-sensitive T1 inversion recovery imaging: a time-efficient interleaved technique for improved tissue contrast in neuroimaging. AJNR Am J Neuroradiol 2005;26:1432–1438.
3. Brant-Zawadzki M, Gillan GD, Nitz WR. MP RAGE: a three-dimensional, T1-weighted, gradient-echo sequence--initial experience in the brain. Radiology 1992;182:769–775.
4. Marques JP, Kober T, Krueger G, van der Zwaag W, Van de Moortele P-F, Gruetter R. MP2RAGE, a self bias-field corrected sequence for improved segmentation and T1-mapping at high field. Neuroimage 2010;49:1271–1281.
5. Ma J. Phase-sensitive inversion recovery method of MR imaging., Patent number: 6192263, 1998.
6. Mougin O, Abdel-Fahim R, Dineen R, Pitiot A, Evangelou N, Gowland P. Imaging gray matter with concomitant null point imaging from the phase sensitive inversion recovery sequence. Magn Reson Med 2016;76:1512–1516.
7. Zhang J, Bjornson B, Xiang Q-S. Combining Multi-channel MP2RAGE Images with Minimized Noise. In: ISMRM 24th Annual Meeting. Singapore; p. #1917.
8. Ashburner J, Friston KJ. Unified segmentation. NeuroImage 2005;26:839–851.
9. Lee JN, Riederer SJ. The contrast-to-noise in relaxation time, synthetic, and weighted-sum MR images. Magnetic Resonance in Medicine 1987;5:13–22.
Figures