2523
Using dynamic sodium imaging to assess furosemide action in the porcine kidney1University of Birmingham, Birmingham, United Kingdom, 2Aarhus Unviersity, Aarhus, Denmark, 3Unviersity of Cambridge, Cambridge, United Kingdom, 4University of Aarhus, Aarhus, Denmark, 5University of Cambridge, Cambridge, United Kingdom
Synopsis
The ability to image sodium is believed to be a powerful tool to understand physiological processes,
Introduction
23Na Magnetic Resonance Imaging (MRI) is a non-invasive technique capable of probing the in vivo bio distribution of sodium [1]. Previous studies have assessed the healthy and pathologically disturbed renal sodium distribution [2–5]. Further dynamic imaging has been undertaken to understand the action of acute diuretic drugs on a pre-clinical system, revealing alterations in medullary and cortical sodium [4,5]. However, the feasibility of such imaging on a clinical system has not been demonstrated. Here we present the first dynamic renal imaging results on a clinical system, assessing the temporal action of furosemide, utilising a 3D cones Ultra short Echo Time (UTE) k-space acquisition [6].Methods
Three Danish domestic pigs were anaesthetised (propofol (0.4mg/kg/h) and fentanyl (8 µg/kg/h)), ventilated, and placed in a 3T MRI scanner (GE 750, WI). T1 weighted 1H imaging was performed (8 channel cardiac array, field of view (FOV) = 380mm, reconstruction matrix = 288x288x192, repetition time (TR) = 3ms, echo time (TE) = 1ms, flip angle (FA) = 12 degrees), 23Na imaging was performed with a pair of Helmholtz loop coils (3D cones readout, respiratory gated, volume excite, FOV = 240mm, TR = 45ms, TE = 0.5ms, flip angle = 60 degrees, NEX = 5, total scan time = 5 minutes, reconstruction matrix = 120x120x120, calibration phantoms = 4% agar, 20, 100 mmolL-1). B1 maps were acquired to correct for flip angle across the volume (protocol as above, flip angles = 40,80 degrees, NEX = 1) .
Furosemide (0.5 mgkg -1), an acute diuretic, which blocks reabsorption of sodium, potassium and chloride in the distal loop of Henle and abolishes the cortico-medullary osmotic gradient was introduced after a baseline sodium acquisition, and sodium imaging performed in 5-minute blocks for 30 minutes.
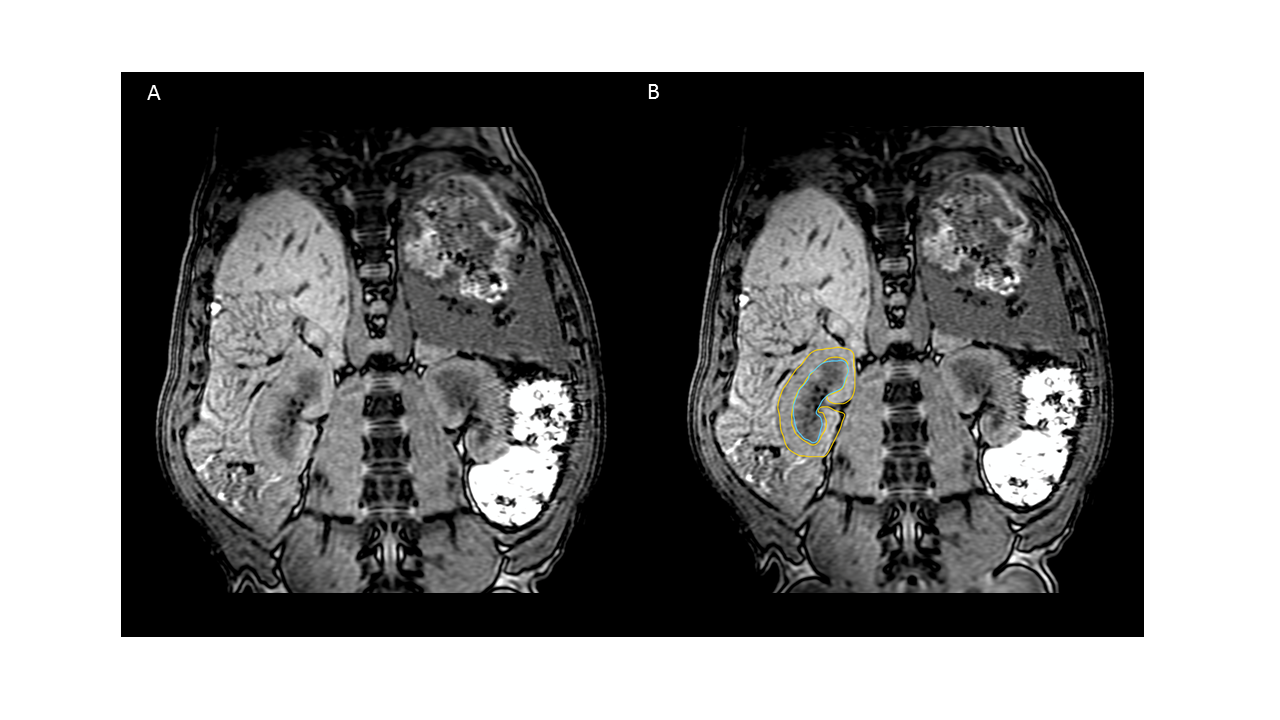
Between each imaging block, arterial blood gas samples were acquired to assess for alterations in serum metabolites. Regions of interest were drawn on each kidney using 1H images, segmenting medullar and cortex (Fig1B). The whole kidney was also segmented by combining both regions previously drawn. Further segmentation of the kidney was performed as previously reported, using 7 layers 7.
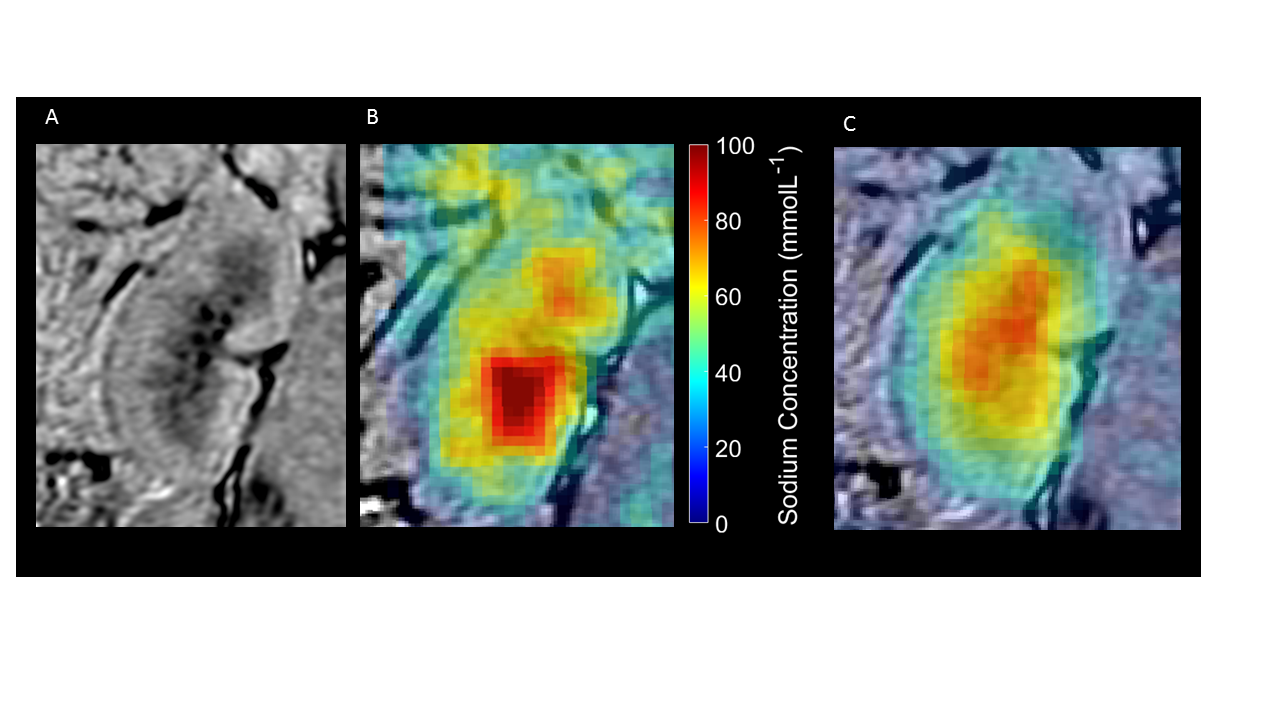
Sodium concentration maps were calculated using the calibration phantoms and a region of noise outside of the body (concentration maps pre and 20 post-furosemide seen in Figure 28.
Regions of interest were used to define average sodium concentration values for the kidney, and a linear fit across segmented layers to determine the cortico-medullary sodium gradient.
Temporal alterations in the sodium gradient were assessed by deriving the angle of fit at each time point.
Statistical analysis
Significance was defined at p<0.05. ANOVA and Bonferroni corrected Wilcoxon rank-sum tests were performed to assess for differences between baseline and time point measures of the cortico-medullar sodium gradient angle, serum metabolites, and segmented medullar/cortex sodium concentration.
Results
Kidney segmentation
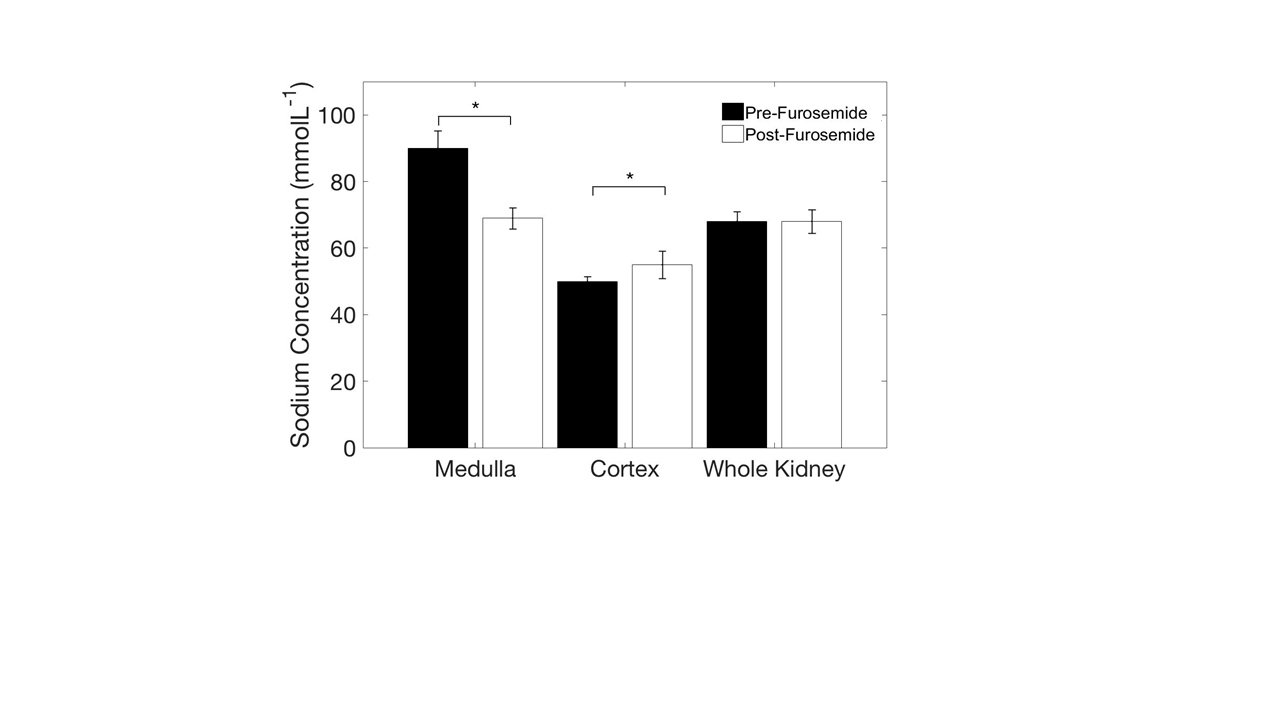
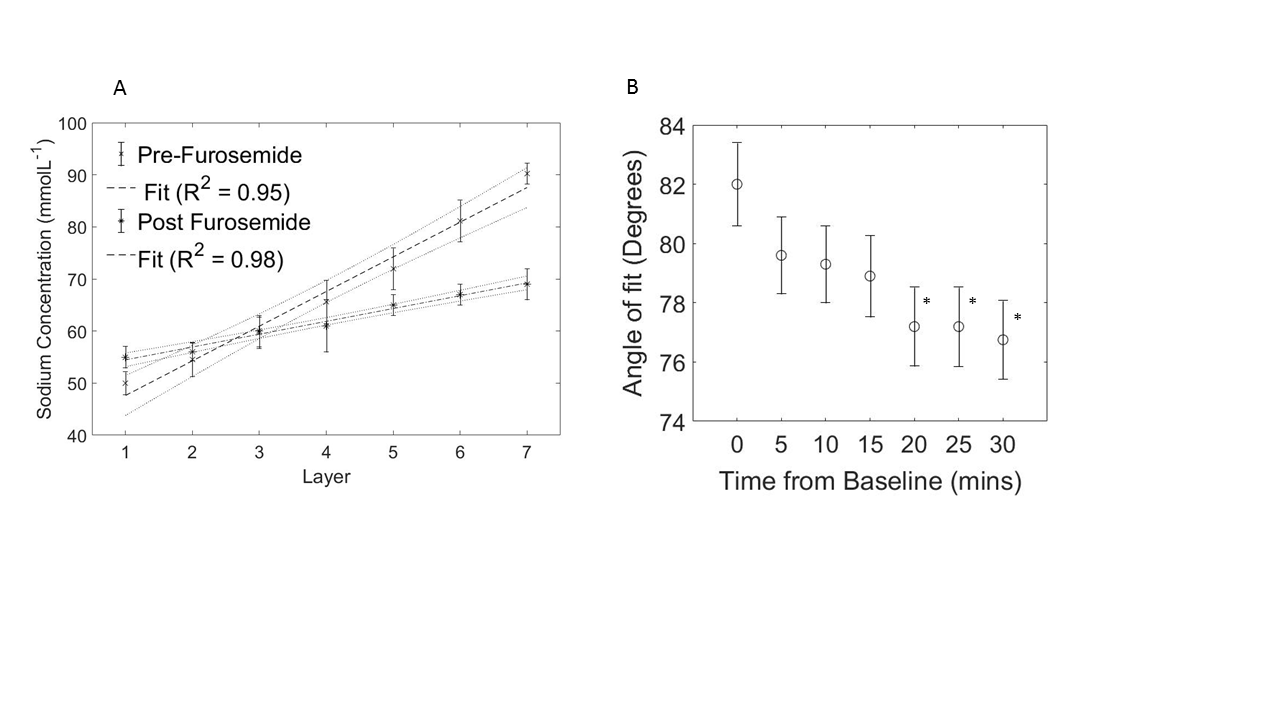
Segmentation of the kidneys revealed elevated sodium in the medulla, compared to the cortex (90±5vs47±2mmolL-1,Fig3A, p<0.05). Furthermore, there was a detectable decrease in the medullary, and increase in the cortex, sodium distribution observed 30 minutes post-furosemide (90±5vs70±3mmolL-1, 47±2vs56±4mmolL-1, respectively, Fig.3B, p<0.05 in both cases). However, there was no discernible difference in the overall sodium concentration of the whole kidney. The cortico-medullary sodium gradient was observed in all cases (Fig.4A), with a flattening of the gradient observed post-furosemide at all time points (82±1.5vs77.5±1.5 degrees at 20 minutes post-furosemide, Fig.4, p<0.05 in all cases).
Serum metabolites
No significant alterations in serum metabolites were detected during the experiment, p>0.05 in all cases. Serum sodium remained constant throughout each experiment (139±2, mmolL-1)
Discussion
This study has shown the feasibility of using dynamic quantitative sodium imaging to non-invasively monitor physiological alterations induced by acute diuresis, detecting early alterations in the cortico-medullar gradient.
Further study in to the use of dynamic sodium imaging to assess the glomerular filtration rate may be possible.
A limitation, however, of this work is the lack of tissue validation for sodium concentration results, which would further strengthen the study.
Conclusion
In conclusion, this work provides evidence for the use of an efficient UTE k-space trajectory, 3D cones, to image temporal alterations in renal sodium distribution after the introduction of an acute diuretic. This work was undertaken on a clinical system with a scan time and FOV useable in patients, providing further evidence for the translation of renal sodium imaging in to clinical practise.Acknowledgements
This study was funded by the Medical Research Council and Aarhus UniversityReferences
1. Madelin, G. Sodium Magnetic Resonance Imaging: Biomedical Applications. (2012).
2. Moon, C. H. et al. Quantitative sodium MR imaging of native versus transplanted kidneys using a dual-tuned proton/sodium (1H/23Na) coil: Initial experience. Eur. Radiol. 24, 1320–1326 (2014).
3. Maril, N., Margalit, R., Rosen, S., Heyman, S. N. & Degani, H. Detection of evolving acute tubular necrosis with renal 23Na MRI: studies in rats. Kidney Int. 69, 765–768 (2006).
4. Maril, N., Margalit, R., Mispelter, J. & Degani, H. Sodium magnetic resonance imaging of diuresis: Spatial and kinetic response. Magn. Reson. Med. 53, 545–552 (2005).
5. Maril, N., Margalit, R., Mispelter, J. & Degani, H. Functional sodium magnetic resonance imaging of the intact rat kidney. Kidney Int. 65, 927–935 (2004).
6. Gurney, P. T., Hargreaves, B. a & Nishimura, D. G. Design and analysis of a practical 3D cones trajectory. Magn. Reson. Med. 55, 575–82 (2006).
7. Milani, B. et al. Reduction of cortical oxygenation in chronic kidney disease: evidence obtained with a new analysis method of blood oxygenation level-dependent magnetic resonance imaging. Nephrol. Dial. Transplant. gfw362 (2016). doi:10.1093/ndt/gfw362
8. Christensen, J. D., Barrere, B. J., Boada, F. E., Vevea, J. M. & Thulborn, K. R. Quantitative tissue sodium concentration mapping of normal rat brain. Magn. Reson. Med. 36, 83–89 (1996).
Figures