2488
High-Resolution T1 maps of Brain Metabolites1CIBM, Radiology and Medical Informatics, University of Geneva, Geneva, Switzerland, 2Swiss Center for Affective Sciences, University of Geneva, Geneva, Switzerland
Synopsis
High-resolution T1 maps are measured over the whole human brain with proton FID-MRSI with incremental flip-angles. MRSI datasets with multiple flip-angles are reconstructed simultaneously through a low-rank-total generalized variation model and T1 values are determined by fit of the steady state magnetization with B1 inhomogeneity correction. Twofold compressed-sensing acceleration enables acquisition of a single flip-angle in 5 min and resulting in acquisition of 3 flip-angles in 15 min. Precise determination of T1 would enables an accurate correction of signal loss and might provide important information on brain micro-structure.
Introduction
Precise determination of the metabolite longitudinal relaxation time (T1) is a key element for quantitative magnetic resonance spectroscopy. It enables an accurate correction of signal loss due to T1 relaxation. In addition, metabolite T1 value is influenced by the molecular environment and might provide important information on brain micro-structure such as between tissue types and lobes1, 2. Although T1 values seems to vary strongly spatially, no metabolite T1 map was ever measured to our knowledge. With the presented methodology, we aim to estimate T1 maps from metabolites in high-resolution (4mm in-plane). Free induction decay - magnetic resonance spectroscopic imaging (FID-MRSI)3 allows for fast determination of metabolite distributions at high resolution3. Depending on the repetition time (TR) and the flip-angle (FA), measured metabolite signal can be weighted by T1 relaxation. In clinical setting (3T), metabolic signal-to-noise at high-resolution is low and long scan-time is required to measure data with different FA. To cope with these limitations, we developed a specific reconstruction model for successive acquisition with multiple FA. Including low-rank and total generalized variation (TGV) regularization in the model, all acquired FA datasets are reconstructed at once. In addition a compressed-sensing acceleration was implemented via random k-space sampling. This research aims to show the feasibility of high-resolution T1 map measurement with accelerated FID-MRSI.Method
Sequence
A
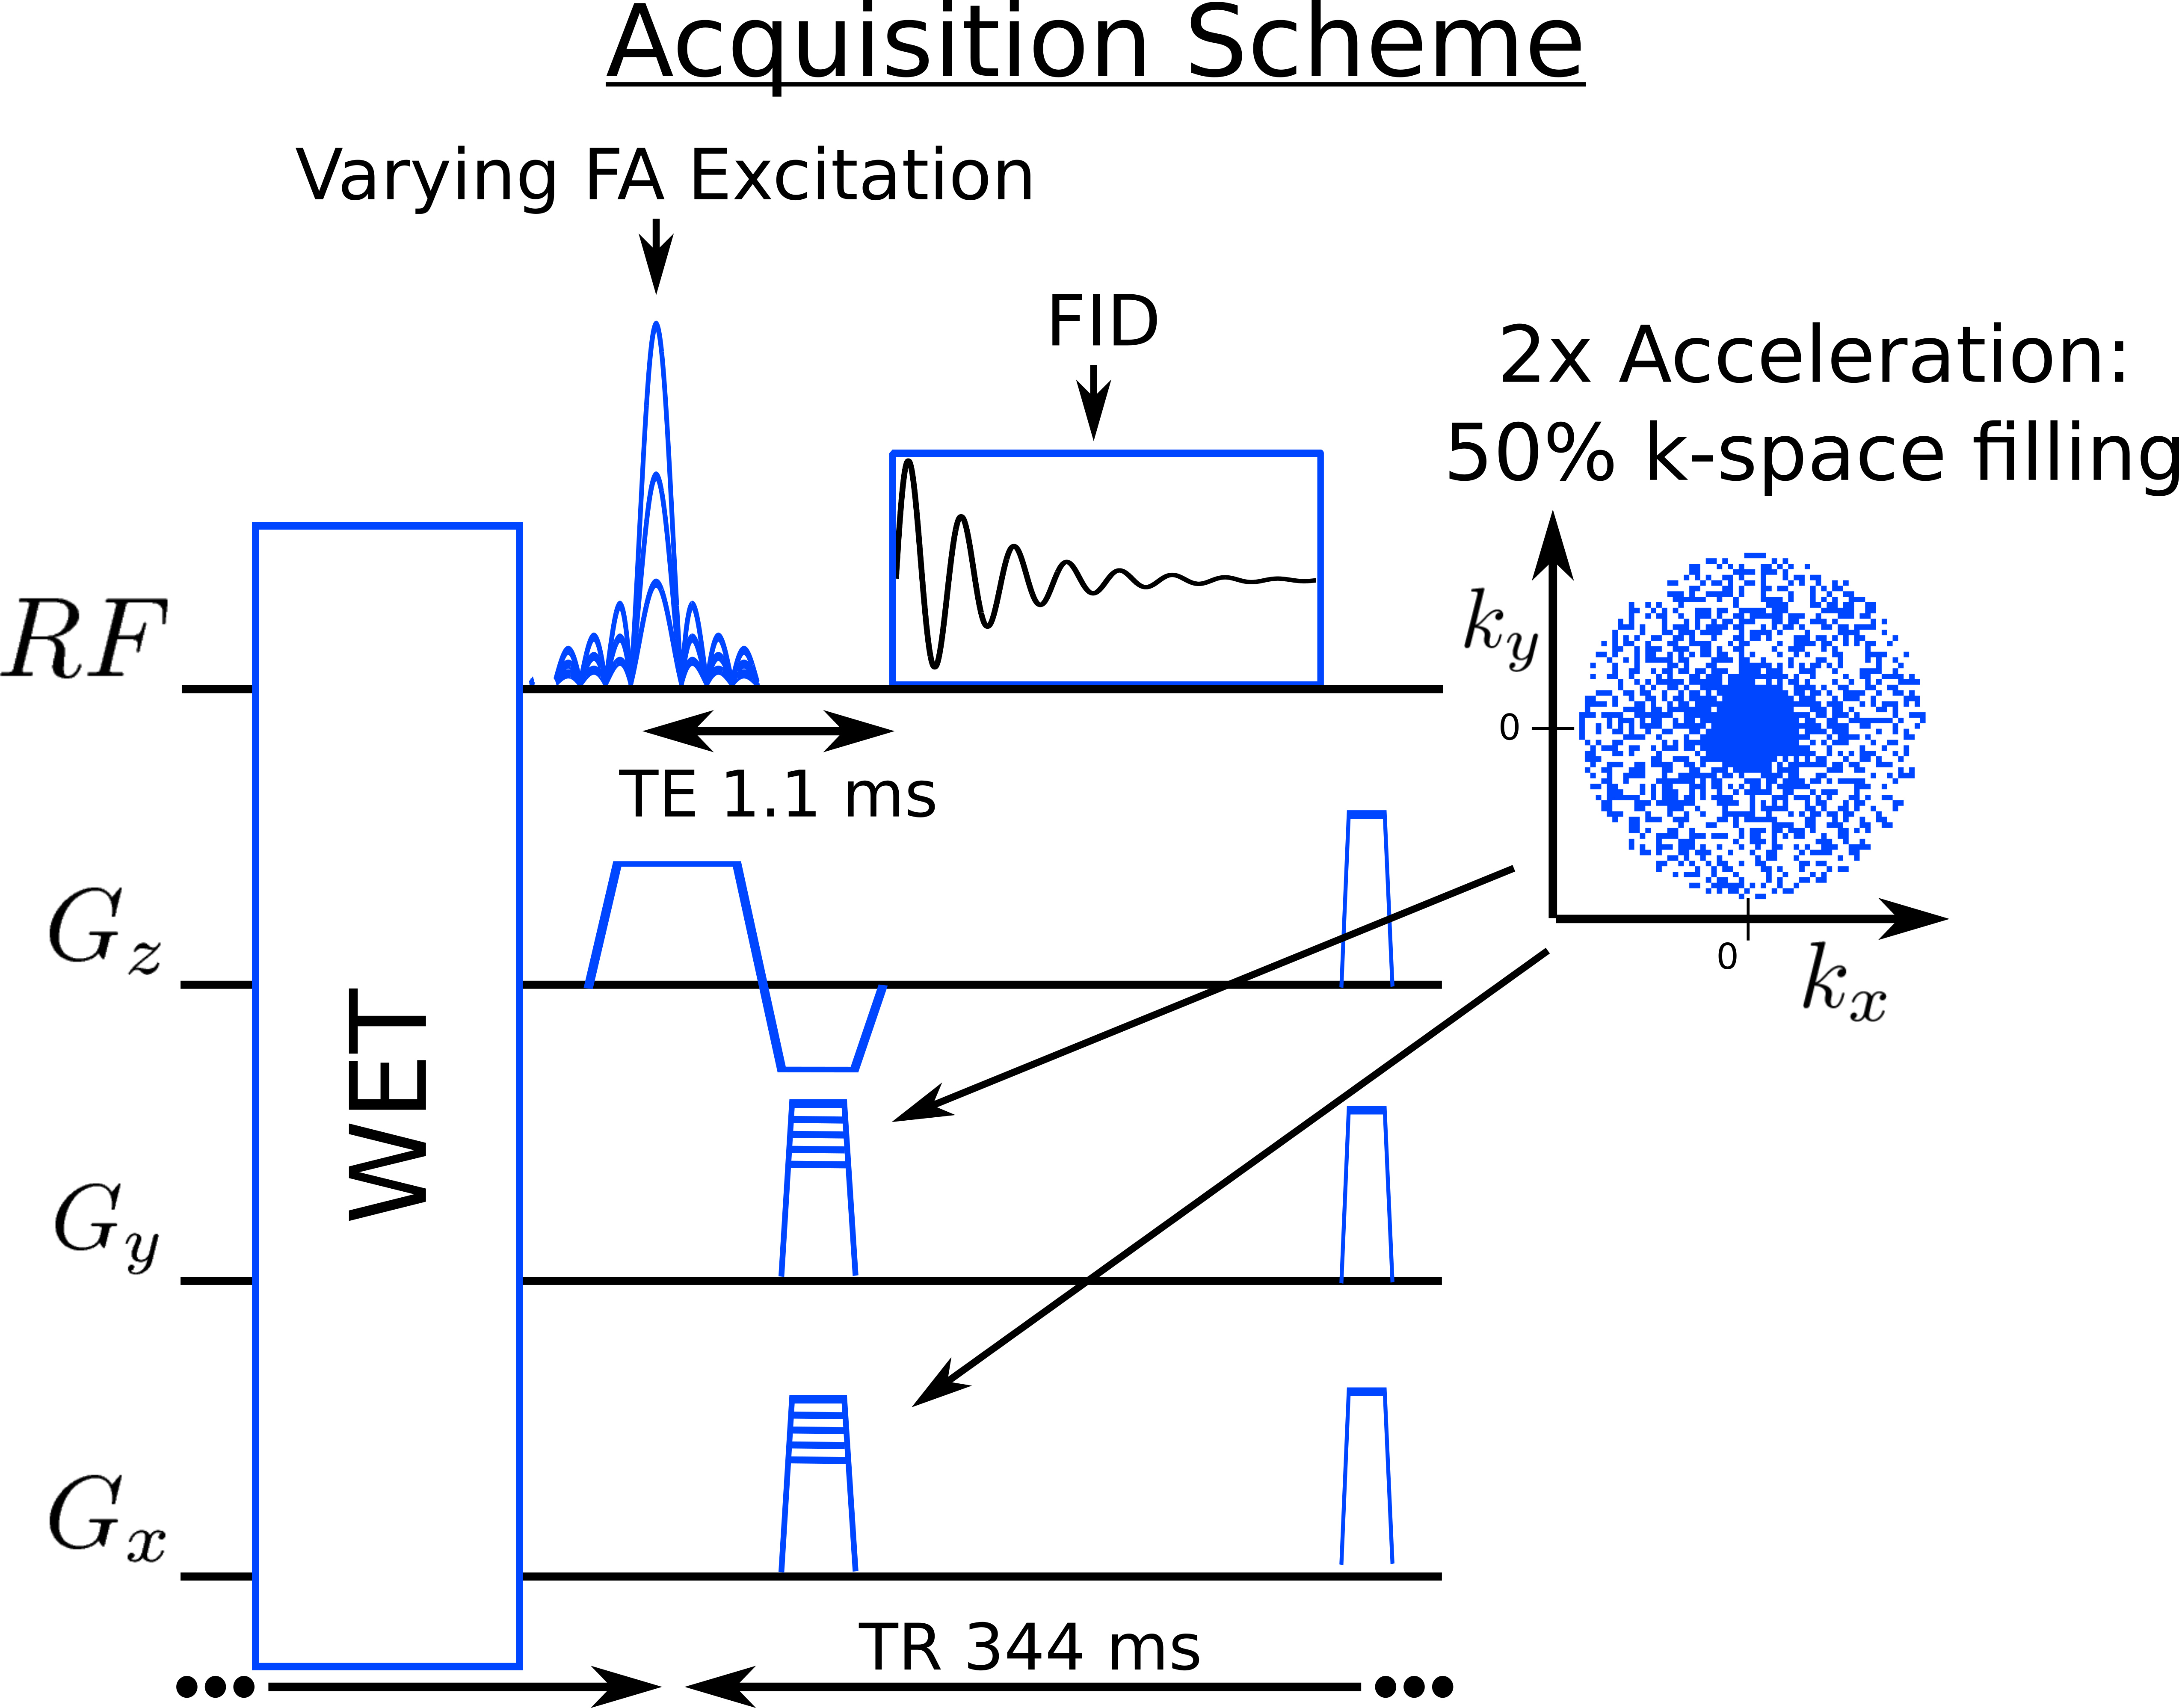
2D-FID-MRSI sequence including WET4
water suppression was implemented (Fig.1). Echo-time was 1.1ms
and the FID signal was acquired with 1024 points at 4kHz leading to a TR of 344ms.
Experiment
Healthy
volunteer brain data were acquired at 3T (Siemens/Erlangen/Germany)
with 64-channel receiver head coil.
Three successive acquisitions of 2D-FID-MRSI with FA = 20, 40 and 60
degree were planned on a 210x180 mm2
FOV with 4 mm in-plane resolution and a 10 mm thick slice. A B1-map
was acquired for FA correction during T1
fitting.
Low-rank approximation
MRSI dataset
are generally assumed to be partially separable8.
This concept has been extended to include multiple FA in the MRSI
dataset and to assume that the whole dataset is partially separable
into a finite number of spatial components and time-FA components.
This low-rank approximation for the reconstructed MRSI dataset $$$\rho^\alpha({\bf r },t)$$$ at
spatial coordinate $$$\bf{r}$$$
at
time $$$t$$$ and FA index $$$\alpha$$$
reads:
$$\rho^\alpha({\bf r},t)=\sum_{c=1}^{N_C}U_c({\bf r})V^\alpha_c(t)$$
Low-Rank
TGV Reconstruction
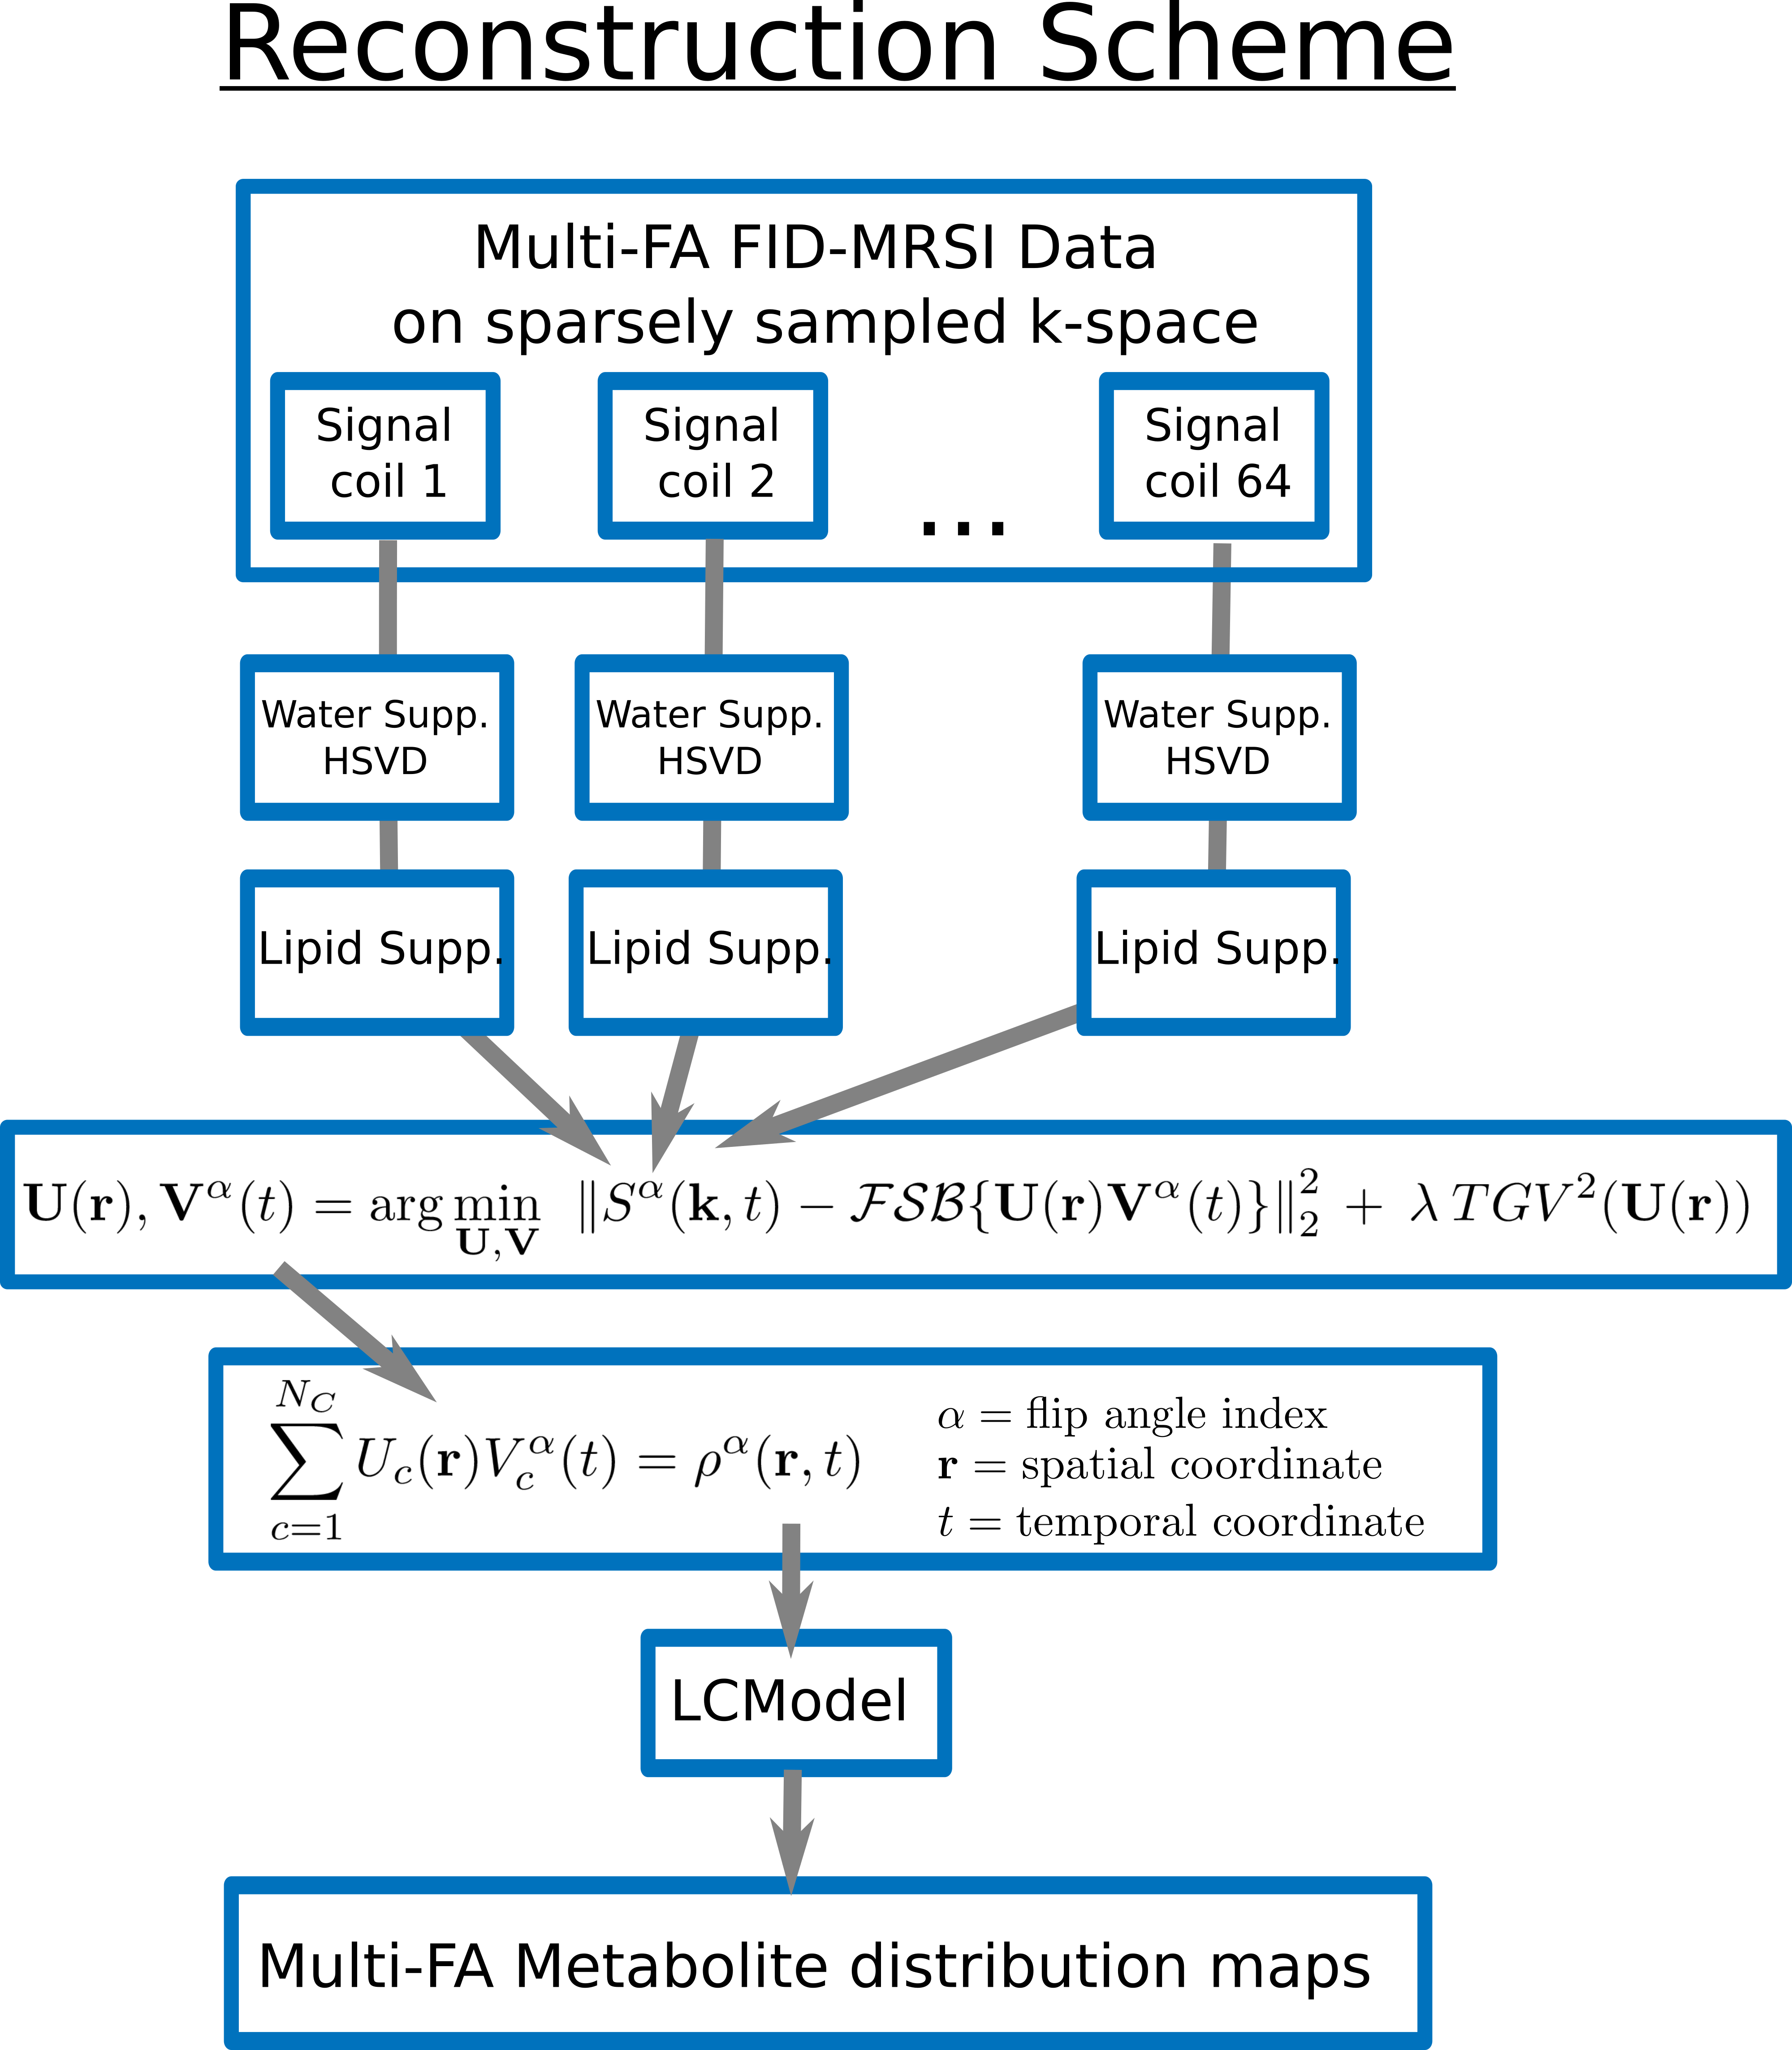
After
removal of the remaining water signal with HSVD5
and the lipid signal
by spectral orthogonality6,7,
MRSI data were reconstructed simultaneously for all FA with a low-rank
TGV model adapted from Kasten et
al.9:
$${\bf U}({\bf r}),{\bf V}^\alpha(t)=\arg\min_{{\bf U},{\bf V}}\:\:\left\| S^\alpha({\bf k},t)-\mathcal{FSB}\{{\bf U}({\bf r}){\bf V}^\alpha(t)\}\right\|^2_2+\:\lambda\:TGV^2({\bf U}({\bf r}))$$
where $$$\mathcal{B}$$$, is the B0 inhomogeneity operator, $$$\mathcal{S}$$$, the coil-sensitivity profiles, $$$\mathcal{F}$$$, the Fourier encoding and $$$\lambda$$$ the regularization parameter (Fig.2). Compressed-sensing acceleration scheme was implemented10 with a sparse and random k-space sampling (Fig.1).
Quantification and T1 fitting
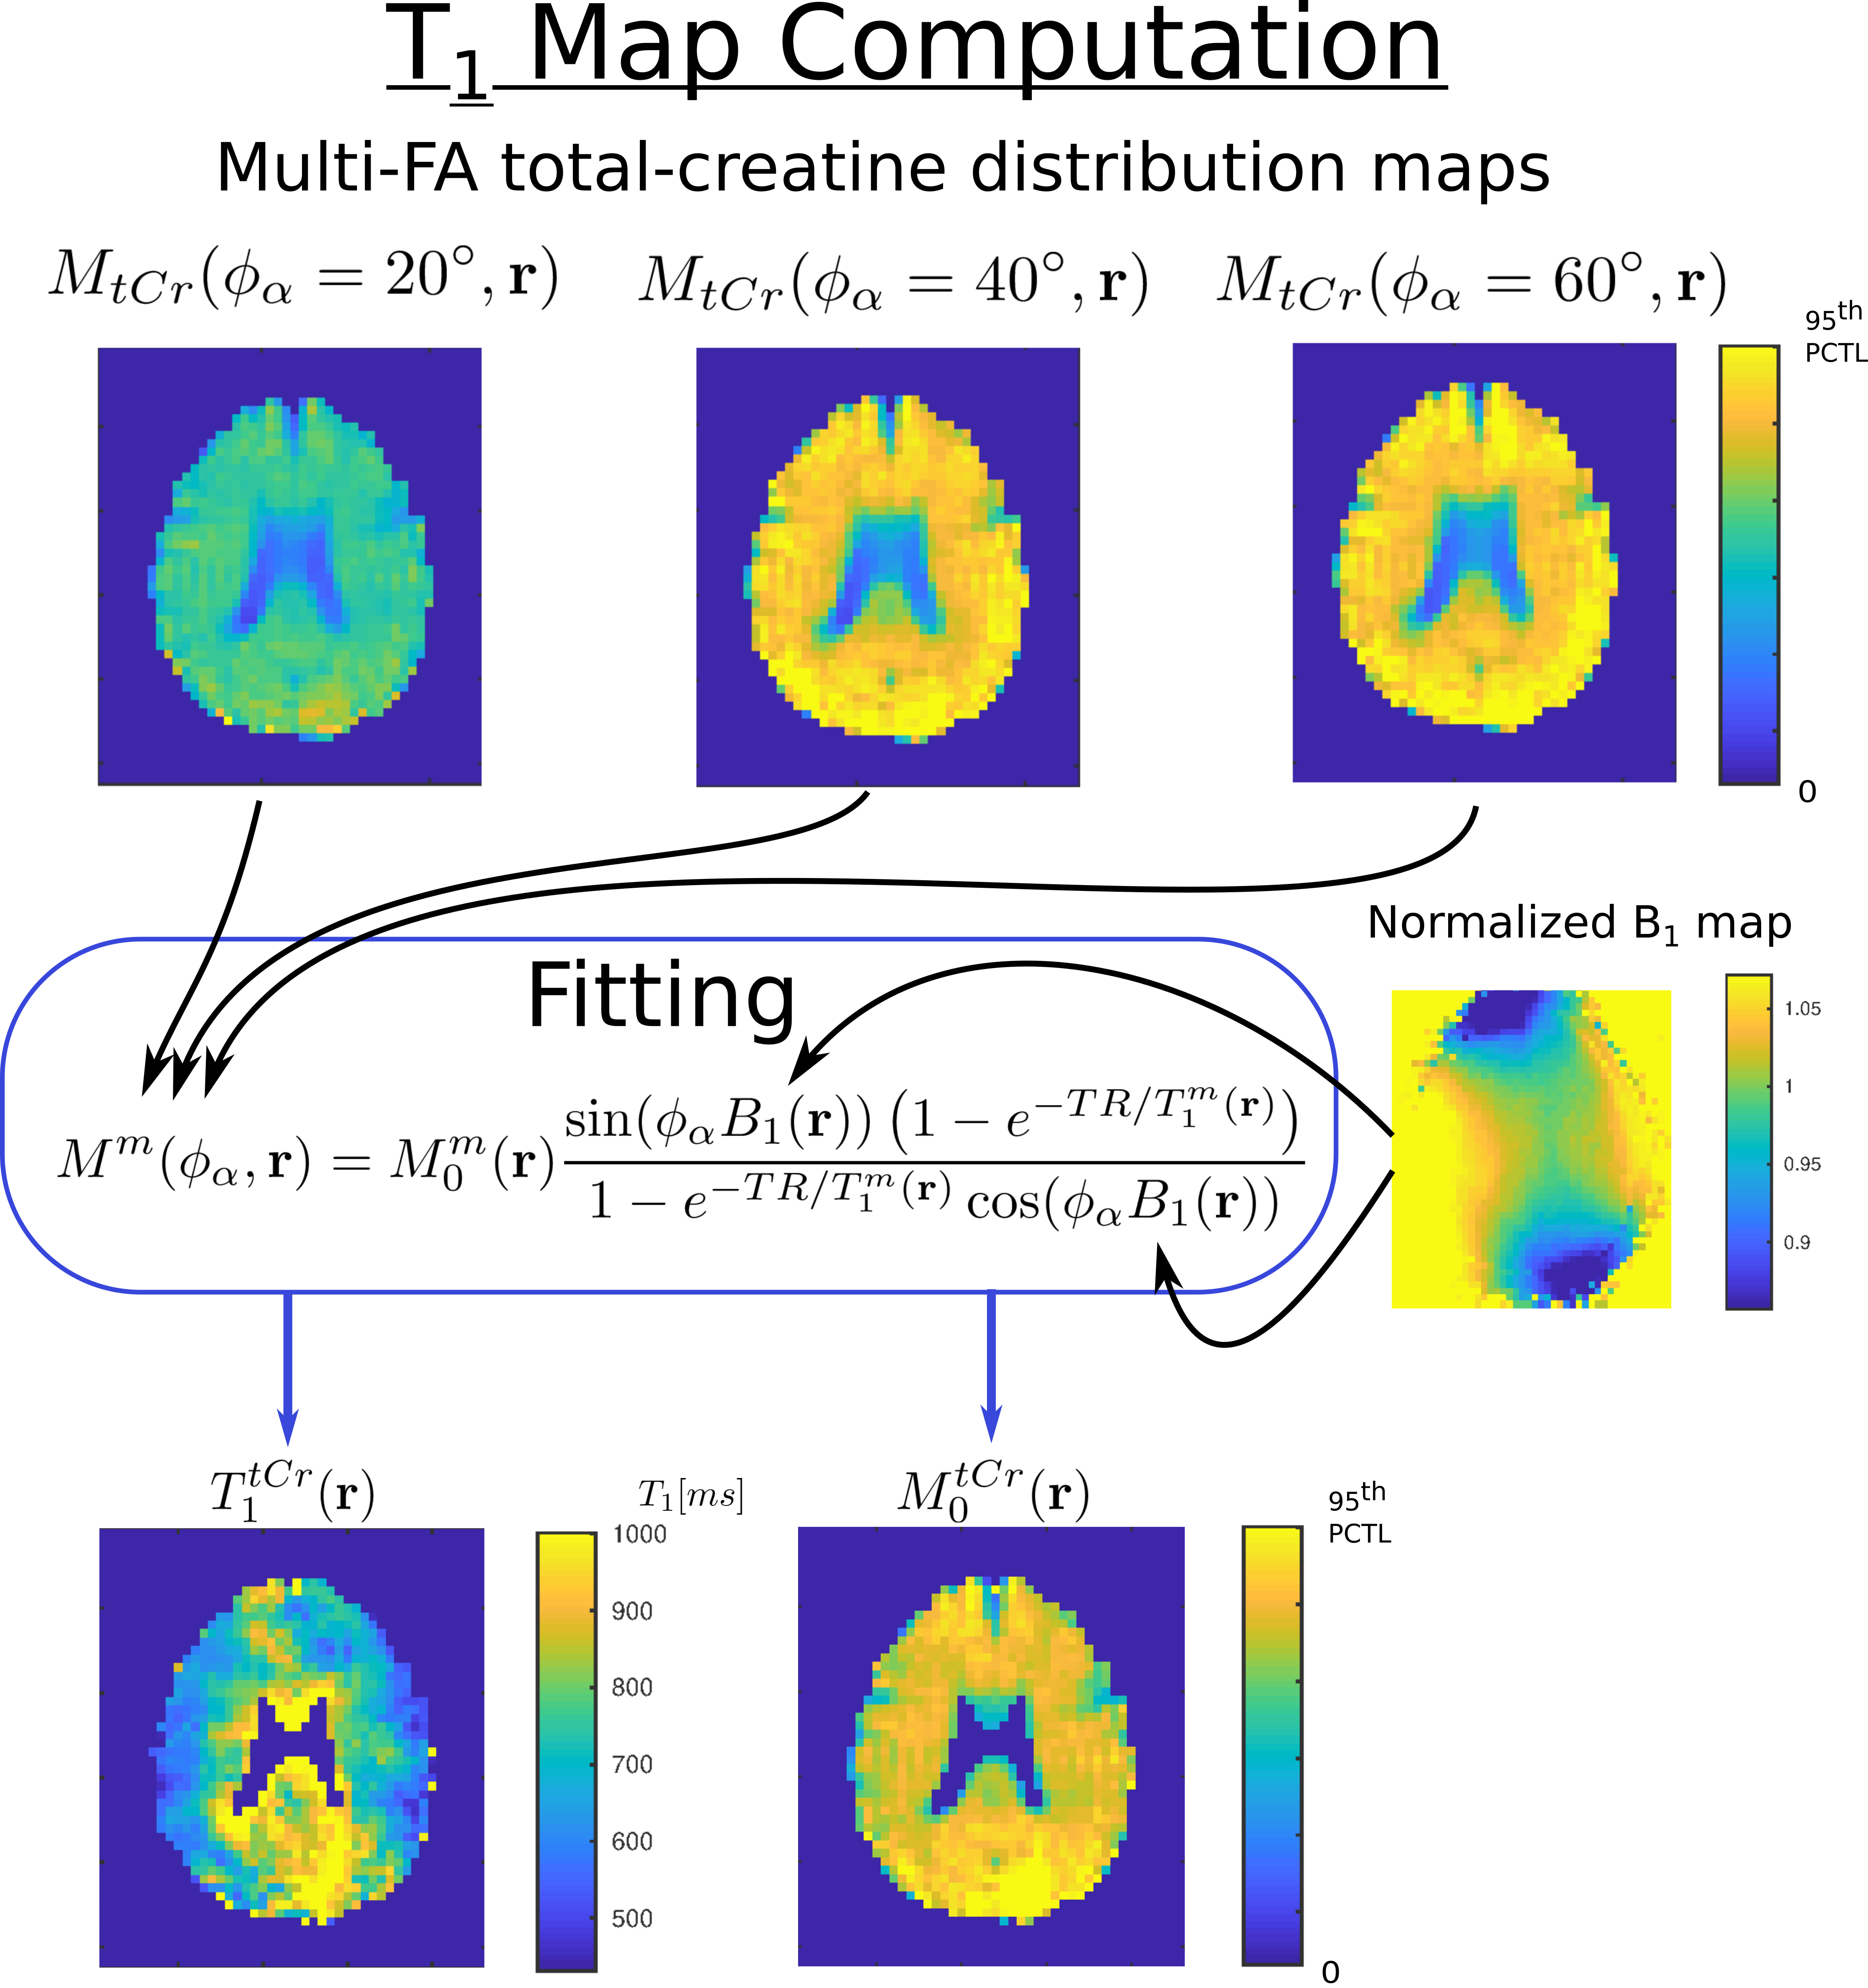
The reconstructed MRSI datasets were quantified using LCModel11 for each FA individually. The resulting concentration map for metabolite $$$m$$$ and FA $$$\phi_\alpha$$$ is assumed to follow the steady-state magnetization signal amplitude12:
$$M^m(\phi_\alpha,{\bf r})=M^{m}_{0}({\bf r})\frac{\sin(\phi_\alpha B_1({\bf r}))\left(1-e^{-TR/T_1^m({\bf r})}\right)}{1-e^{-TR/T_1^m({\bf r})}\cos(\phi_\alpha B_1({\bf r}))}$$
At each voxel, the longitudinal relaxation time, $$$ T_{1}^{m}({\bf r})$$$, and the T1-corrected concentration, $$$ M_{0}^{m}({\bf r})$$$, were estimated with a non-linear least-square fit. FA $$$\phi_\alpha$$$ is corrected for B1 field inhomogeneity by the normalized factor $$$B_1({\bf r})$$$ from the measured B1-map.
Results
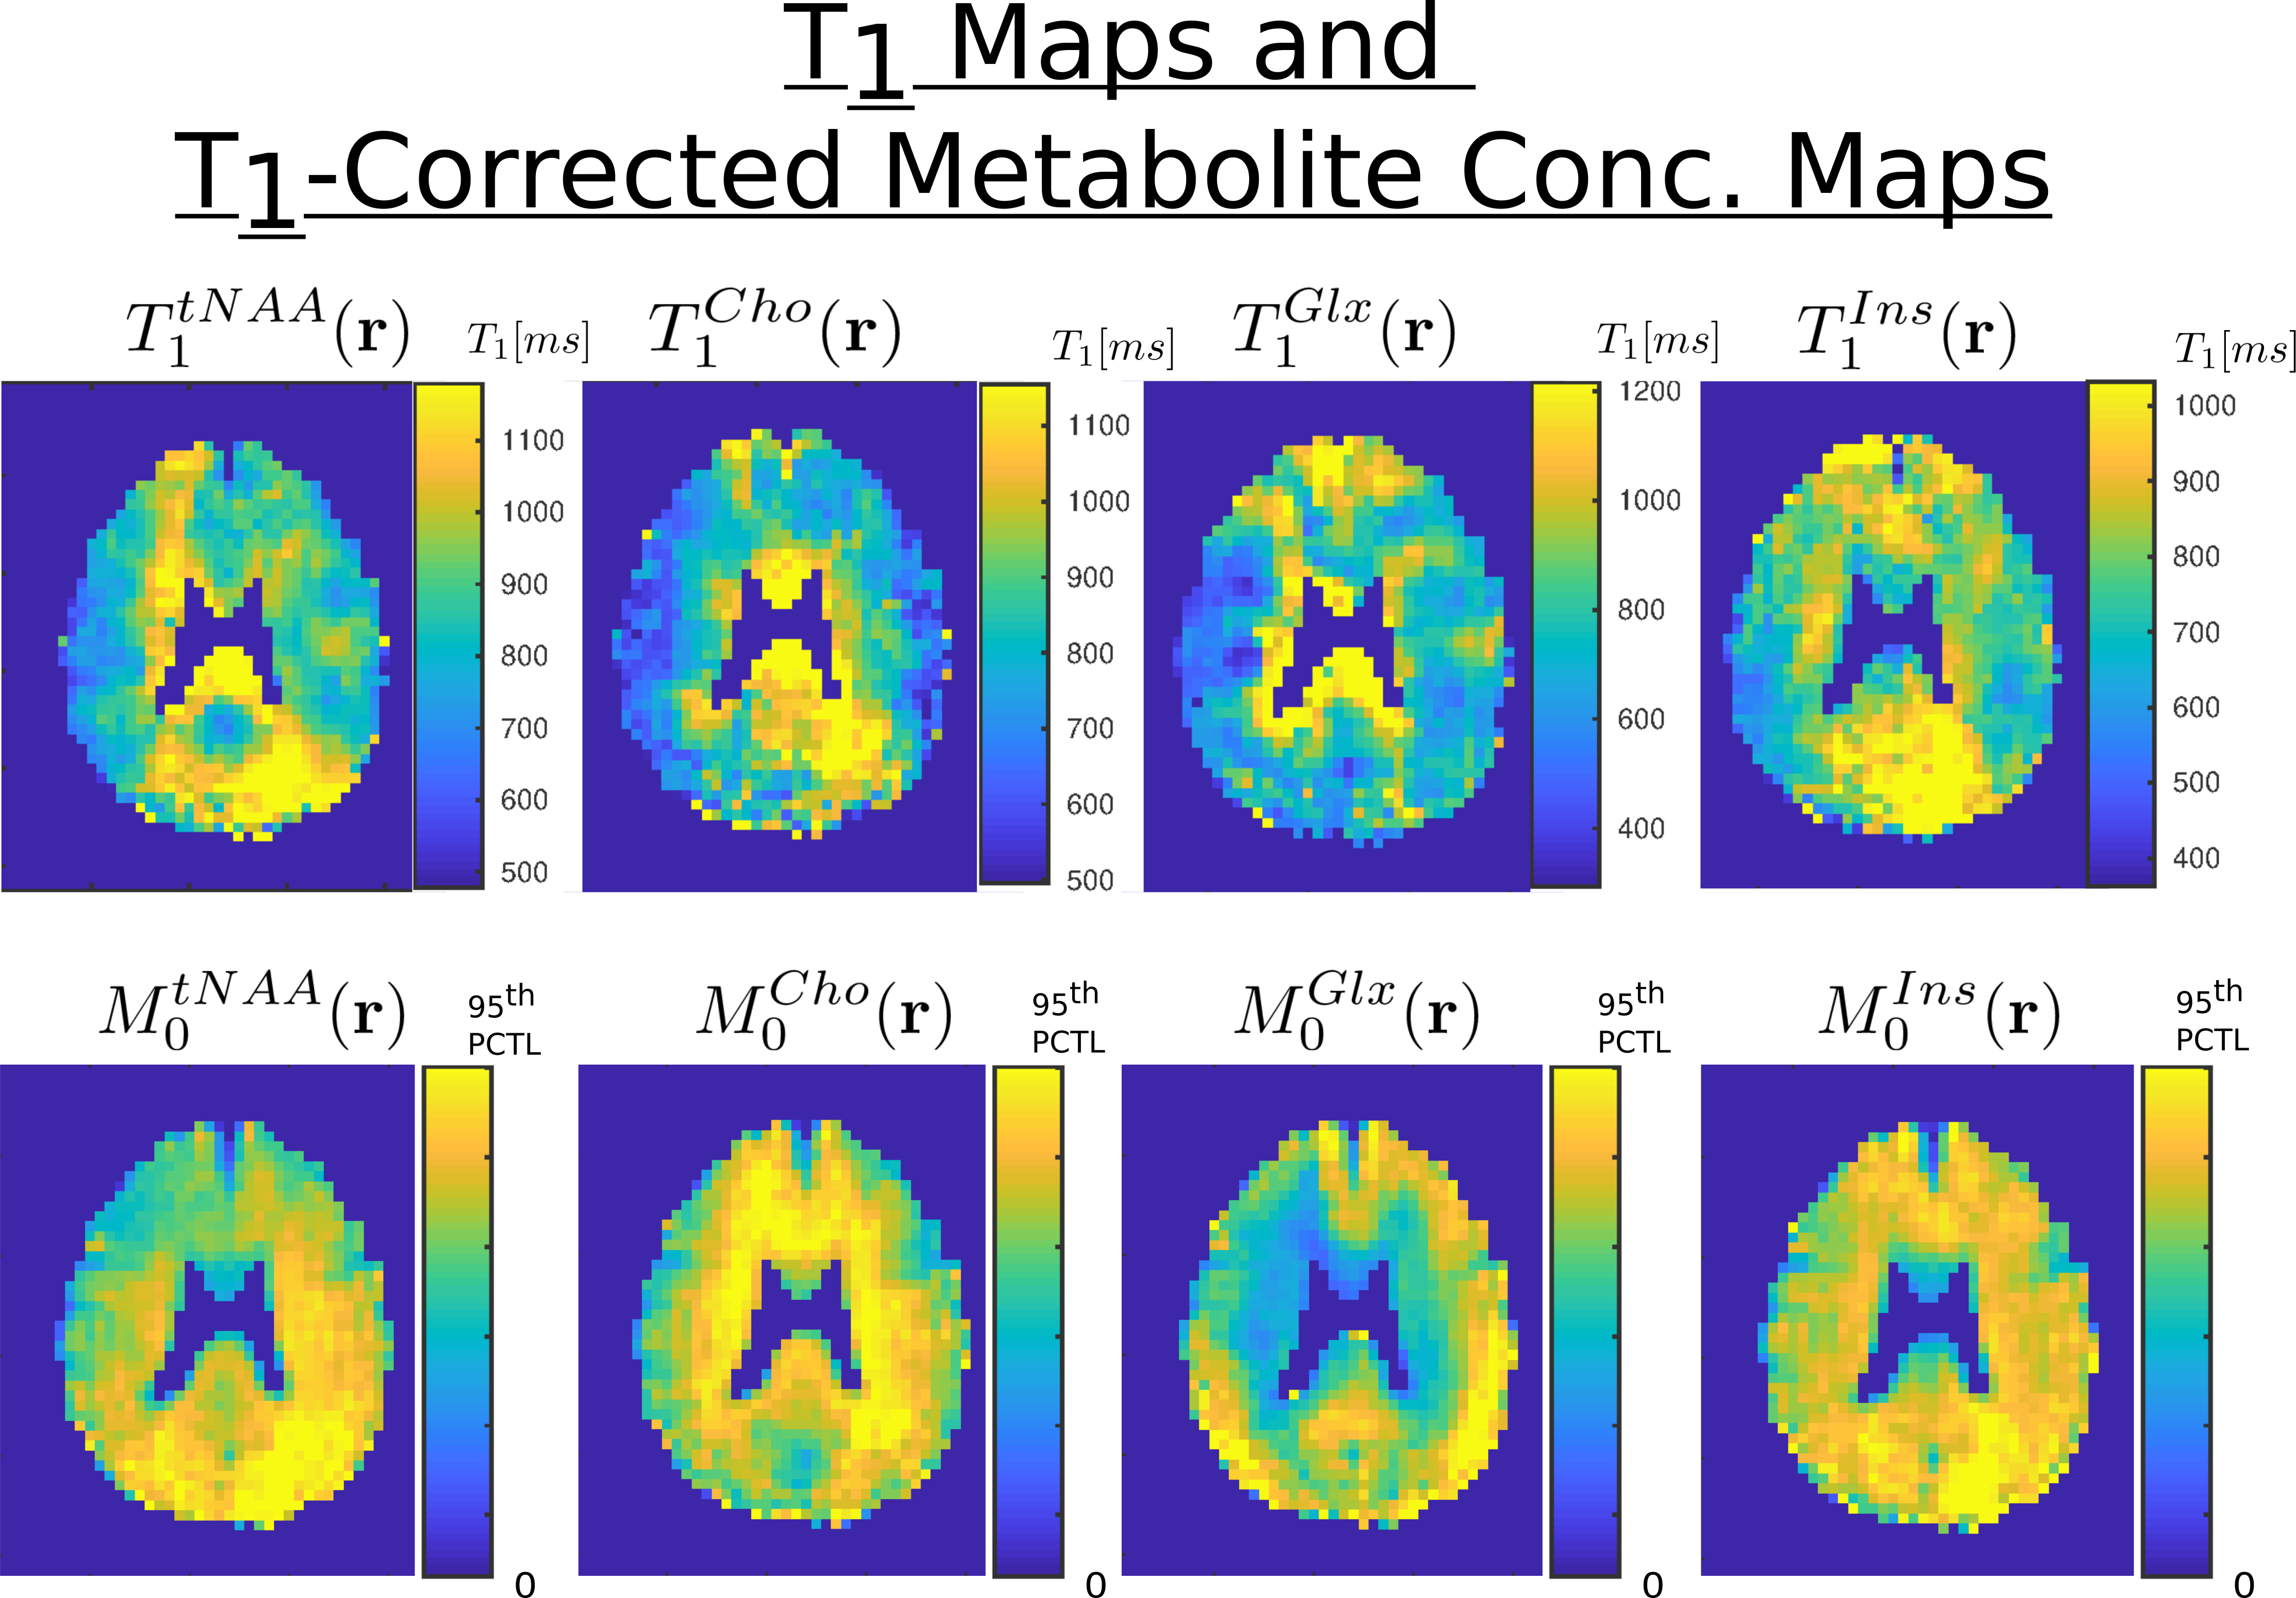
In figure 3, the concentrations maps of total creatine acquired with FA = 20, 40 and 60 degree are shown. The T1 map and T1-corrected concentration map, resulting from the fit with the B1-map correction, are displayed. In figure 4, the T1 maps and T1-corrected concentration maps from metabolite total-NAA, choline, glutamate + glutamine and inositol are presented.Discussion
The results presented in figure 3 and 4 seem to display a white matter to grey matter contrast in the estimated T1 map, particularly present for tCr, Cho and Glx. This difference might stem from a change in metabolite environment. Although the T1 values estimated throughout the brain are promising and in agreement with the results of the literature1,2, further acquisitions with additional and higher FA will be performed to confirm these results. Also, the FA for the acquisition were chosen arbitrary but more analyses will be performed to find the optimal set of FA for the best T1-map determination.Acknowledgements
No acknowledgement found.References
[1] Brief, E. E., Whittall, K. P., Li, D. K. B., & MacKay, A. (2003). ProtonT1 relaxation times of cerebral metabolites differ within and between regions of normal human brain. NMR in Biomedicine, 16(8), 503–509.
[2] Ethofer, T., Mader, I., Seeger, U., Helms, G., Erb, M., Grodd, W., … Klose, U. (2003). Comparison of longitudinal metabolite relaxation times in different regions of the human brain at 1.5 and 3 Tesla. MRM, 50(6), 1296–1301. Figure 1: FID-MRSI sequence with varying flip-angle and sparse random k-space sampling.
[3] Nassirpour, S., Chang, P., Henning, A. (2017). High and ultra-high resolution metabolite mapping of the human brain using 1H FID MRSI at 9.4T. NeuroImage
[4] Ogg, R. J., Kingsley, P. B., & Taylor, J. S. (1994). WET, a T1- and B1-insensitive water-suppression method for in vivo localized 1H NMR spectroscopy. Journal of Magnetic Resonance. Series B.
[5] Barkhuijsen, H., de Beer, R., & van Ormondt, D. (1987). Improved algorithm for noniterative time-domain model fitting to exponentially damped magnetic resonance signals. Journal of Magnetic Resonance (1969), 73(3), 553–557.
[6] Bilgic, B., Gagoski, B., Kok, T. and Adalsteinsson, E. (2013) Magn Reson Med 69, 1501-1511
[7] Klauser, A., Van De Ville, D. ,Lazeyras, F. . Low-Rank TGV Reconstruction of High-Resolution 1H-FID-MRSI of Whole Brain Slices. (2017) ISMRM 25th Annual Meeting, preceeding #5517
[8] Nguyen, H.M., Peng, X., Do, M.N. and Liang, Z. (2013). Denoising MR spectroscopic imaging data with low-rank approximations. IEEE Trans Biomed Eng 60, 78-89.
[9] Kasten, J., Lazeyras, F., & Van De Ville, D. (2013). Data-Driven MRSI Spectral Localization Via Low-Rank Component Analysis. Medical Imaging, IEEE Transactions on, 32(10), 1853–1863.
[10] Liang, D., Liu, B., Wang, J., & Ying, L. (2009). Accelerating SENSE using compressed sensing. Magnetic Resonance in Medicine, 62(6), 1574–84. https://doi.org/10.1002/mrm.22161
[11] Provencher, S.W. (1993). Estimation of metabolite concentrations from localized in vivo proton NMR spectra. Magn Reson Med 30, 672-679.
[12] de Graaf, R. A. (2007). In Vivo NMR Spectroscopy: Principles and Techniques: 2nd Edition. In Vivo NMR Spectroscopy: Principles and Techniques: 2nd Edition.
Figures