2393
High-Throughput Automatic Tumor Detection and Segmentation in Small-Animal MR Imaging of Patient-Derived Tumor Xenografts1Washington University in St. Louis, Saint Louis, MO, United States
Synopsis
Computer aided tumor detection and segmentation of small animal MR images are prone to spurious lesion, false detection, under segmentation, over segmentation, incompatibles of huge number of images for small animal MR imaging. We propose computer aided method using the combination of fast C-means, morphology and single-phase level set to detect and segment tumor lesions from T2 weighted MR images. Proposed method gives over 90% accuracy when applied to homogeneous tumors.
INTRODUCTION
Tumor phenotyping using Magnetic Resonance Imaging (MRI) is typically employed to characterize animal models of human cancers, such as Patient-Derived Tumor Xenografts (PDX). Detection and segmentation of the tumor is an essential step in this endeavor1. While semiautomatic segmentation methods have been employed in human neuroimaging applications, automatic segmentation of small-animal tumors has received less attention. Direct application of semiautomatic segmentation tools from human applications is not practical in preclinical models due to the markedly reduced size of anatomical and structural features2. Nevertheless, given the labor intensive nature of manual segmentation, computer-aided, semiautomatic segmentation of tumors in preclinical models is of high interest, specifically to enable high throughput analysis of large volumes of data.METHODS
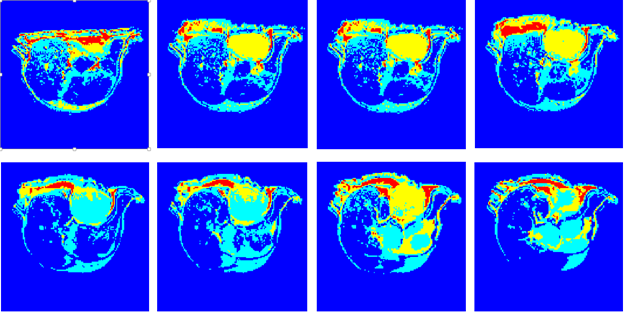
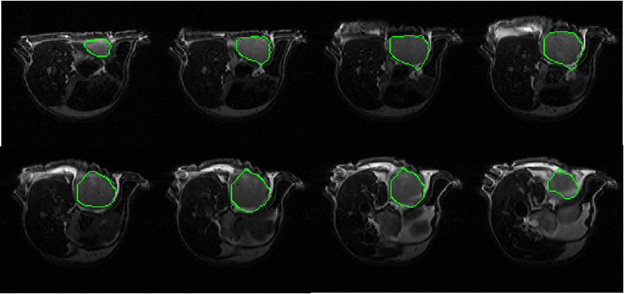
Our core approach to this challenge is based on a combination of unsupervised learning, morphology, and a region-based geometric active contour model. The process can be separated into two principal steps: (i) tumor location finding and (ii) segmentation. A fast C-means algorithm3 is implemented by indexing the number of distance bounds to avoid unnecessary distance computations. Four clusters are generated (Red-4, Yellow-3, Sky-2 and Blue-1) from mouse gray-scale images (3D or 2D multi-slice). A morphological dilation is then applied to disconnect the weakly connected component within the clusters. A half voting scheme is used on the maximum connected component to determine the location of the tumor, and morphological erosion is then used to balance erosion vs. dilation. A mask, generated by selection of the single largest nearest component at the tumor location is used for level set initialization. A region-based, single-phase, level set or geometric active contour is then applied to define the tumor. Level-set method4 represent object boundaries, as the zero level set of an implicit function defined in a higher dimension, and evolve the level-set function according to a partial differential equation (PDE). The evolving PDE of the level-set function is derived by minimizing defined energies on the level set function. The energy functions are derived from image properties such as voxel intensities and inter-voxel intensity gradients. To ensure correct boundary detection, an extreme maxima mask is generated from the third cluster as a stopping condition of the level set. The binary segmented area is then multiplied against the original image to derive the segmented region (tumor).RESULTS
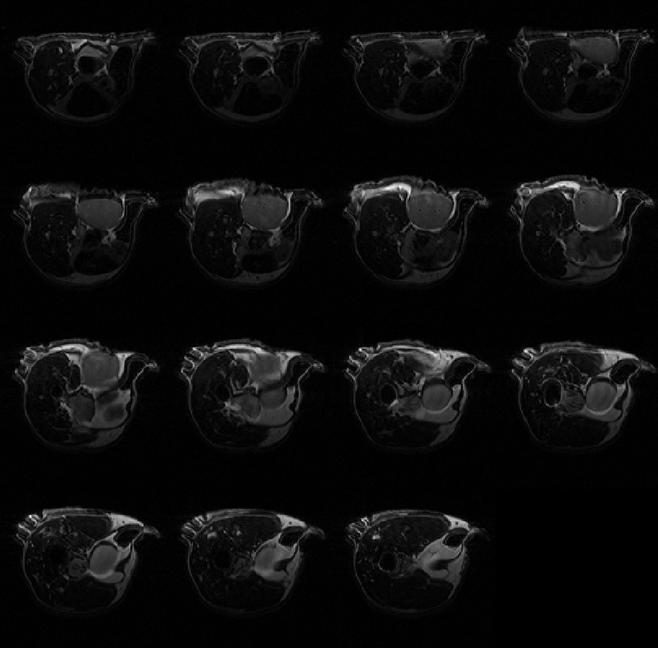
The automatic segmentation algorithm was applied to 2D multi-slice, T2-weighted MR images of mice bearing patient-derived triple negative breast cancer xenographs: 25 slices, 25.6 × 25.6 × 1 mm3, in-plane matrix 128 × 128, TE 60 ms, TR 1.5 s. Figure 1 shows representative MR images in which tumor is present in slices with segmentation start/stop indexes 3 to 10. The output of fast C-means localization and detection clustering is shown in Figure 2. Figure 3 shows the tumor location after applying the voting method. The final segmented tumor lesion is shown in Figure 4 after applying the nearest neighbor cluster as a mask of the level set. The detection and segmentation algorithm correctly segments the relatively homogeneous (re T2W contrast) PDX.DISCUSSION
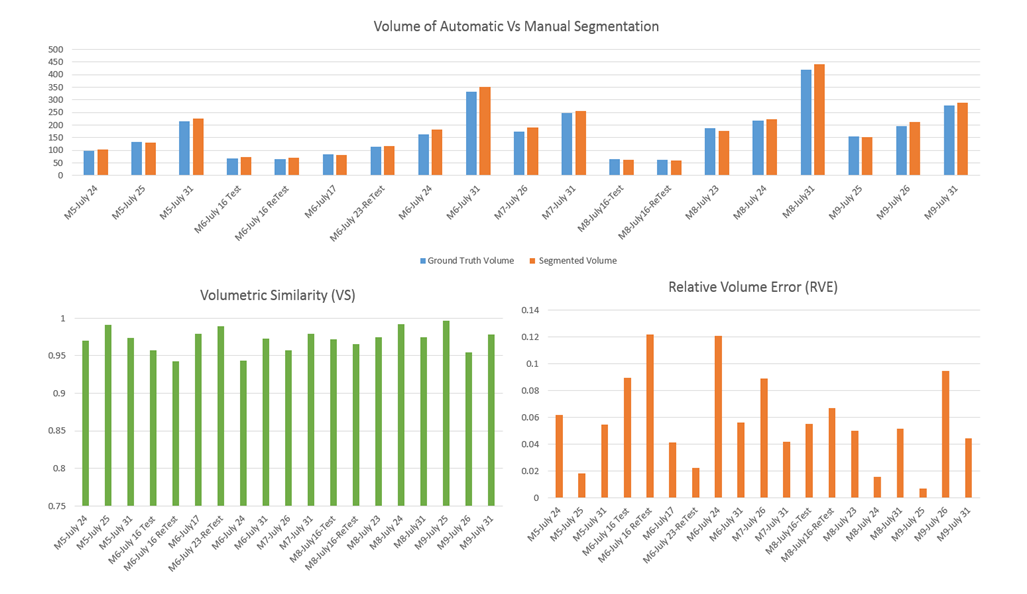
We have tested the accuracy and error of this automated segmentation algorithm using a set of performance metrics5,6 in 19 datasets of the same PDX type against manual segmentation as “ground truth”. Dice Coefficient, Jaccard Index, Precision, Recall, F measure, Sensitivity, Specificity, Accuracy, and G-Mean metrics calculated from individual slices demonstrate more than 90% average accuracy, and less than 5% average relative area error. Performance metrics were also calculated based on manual vs. automatic segmented volume determinations, Figure 5. These results suggest that the problems of spurious lesion generation and over/under segmentation are overcome by the proposed computer-aided method.CONCLUSION
We have implemented an automatic computer-aided tumor detection and segmentation algorithm for small-animal MRI using a combination of fast C-means and level-set algorithms without parameter dependence. The method provides high accuracy and low error for relatively homogeneous (re T2W) PDX. Future work will be targeted at more heterogeneous PDX, e.g., those with enhancing or non-enhancing or necrotic cores.Acknowledgements
Preclinical MRI data were acquired by Xia Ge and John Engelbach. Funding was provided by NCI grant U24 CA209837, Washington University Co-Clinical Imaging Research Resource, and the Small-Animal Cancer Imaging Shared Resource of the Alvin J. Siteman Cancer Center, an NCI-Designated Comprehensive Cancer Center (Cancer Center Support Grant P30 CA91842).References
1. Lee J, Jomier J, Aylward S, et al. Evaluation of Atlas based Mouse Brain Segmentation. Proc SPIE Int Soc Opt Eng. 2009;7259:725943-725949.
2. Nie J, Shen D. Automated segmentation of mouse brain images using multi-atlas multi-ROI deformation and label fusion. Neuroinformatics. 2013;11(1):35-45.
3. Bachem O, Lucic M, Hassani H, et al. Fast and provably good seedings for k-means. NIPS 2016: 1-9.
4. Li C, Su J, Yu L, Wang L, Ze L. A variational level set method image segmentation model with application to intensity inhomogene magnetic resonance imaging. Digit Med 2018;4:5-15
5. Taha AA, Hanbury A. Metrics for evaluating 3D medical image segmentation: analysis, selection, and tool. BMC Med Imaging. 2015;15:29. Published 2015 Aug 12. doi:10.1186/s12880-015-0068-x
6. Xing F, Yang L. Robust Nucleus/Cell Detection and Segmentation in Digital Pathology and Microscopy Images: A Comprehensive Review. IEEE Rev Biomed Eng. 2016;9 234-263.
Figures