2320
Differentiating infiltrative tumor from vasogenic edema in glioblastom using oxygen-enhanced MR imaging1Hefei Cancer Hospital, Hefei Institutes of Physical Science, Chinese Academy of Sciences, Hefei, China
Synopsis
Glioblastoma (GBM) induces both vasogenic edema and extensive tumor cells infiltration, both of which present with similar appearance and not be differentiated on conventional MRI. To distinguish between these infiltrative tumor and vasogenic edema components within the nonenhancing lesion area using novel techniques thus holds great clinical importance. Oxygen-enhanced MRI may directly reflect tissue oxygenation, has shown promising applications in the measurement of hypoxia or radiation-induced necrosis. Therefore, in this study we explored the possibility to differentiate vasogenic edema from infiltrative tumor in patients with GBM using oxygen-enhanced MRI. The results showed significant more negative ΔR1 levels (p < 0.05) were observed in the infiltrative tumor area compared to those in the vasogenic edema and tumor site. Oxygen-enhanced MR imaging has thus the potential to differentiate infiltrative tumor from vasogenic edema in glioblastoma.
INTRODUCTION
It is well-established that glioblastoma (GBM) induces both vasogenic edema and extensive tumor cells infiltration, both of which present with similar appearance and not be differentiated on conventional MRI, e.g., ADC maps. To distinguish between these infiltrative tumor and vasogenic edema within the nonenhancing lesion using novel techniques thus holds great clinical importance 1. Recently noninvasively longitudinal relaxation rate (R1)-based MR methods may directly reflect tissue oxygenation in vivo, has shown promising applications in the measurement of tumor hypoxia 2, 3 or radiation-induced necrosis 4. Therefore, in this study we explored the possibility to differentiate vasogenic edema from infiltrative tumor in patients with GBM using oxygen-enhanced MR imaging.MATERIALS and METHODS
Ethical approval was obtained from the Local Research Ethics Committee. Five patients with single tumor in the brain were recruited and signed informed consents. All MR studies were performed on a 3.0 T Achieva scanner (Philips Healthcare, Best, The Netherlands) using an eight-channel SENSE head coil. Axial T1-weighted (T1w) images before and after contrast agent injection (Gadovist, Bayer Health Care) were acquired using fast field echo (FFE): TR/TE = 242/4.6 ms, field of view (FOV) =230 mm × 230 mm, reconstruction matrix size = 512 × 512, slice thickness = 5 mm. Perfusion examination was performed with a postcontrast dynamic susceptibility contrast enhancement EPI sequence (TR/TE = 1400/80 ms, FOV = 230 mm × 230 mm, matrix = 128 × 128, slice thickness = 5 mm) with 9 mL of gadobutrol (1.0 mmol/mL, Gadovist) flush administered via a power injector at a rate of 5 mL/sec. The whole perfusion imaging lasted 1 min 26 s. DWI was performed using a transverse single-shot EPI diffusion-weighted sequence: TR/TE = 2800/86 ms, slice thickness = 5 mm, FOV = 230 mm × 230 mm, reconstruction matrix size 256 × 256, diffusion sensitive gradient b = 1000 s/mm2 in the three orthogonal directions. R1 maps were acquired during baseline air breathing using T1 FFE with variable flip angles (three flip angles from 7 to 37), FOV = 230 mm × 230 mm, in-plane resolution 1.88 mm, slice thickness = 5 mm. Subjects breathed room air to provide baseline data, then 100% oxygen (5 L/min) was delivered through a facemask for three minutes to ensure stability in blood oxygenation. R1 and ΔR1 (R1 on O2 breathing minus R1 on air breathing) maps were obtained as described previously 3. Dynamic susceptibility contrast-enhanced data were processed offline and rCBV were measured using Philips post-processing workspace. To quantify ADC and ΔR1 changes, each MR dataset was analyzed using ImageJ. Statistical comparisons made between the groups were carried out by two tailed Student’s unpaired t tests.RESULTS
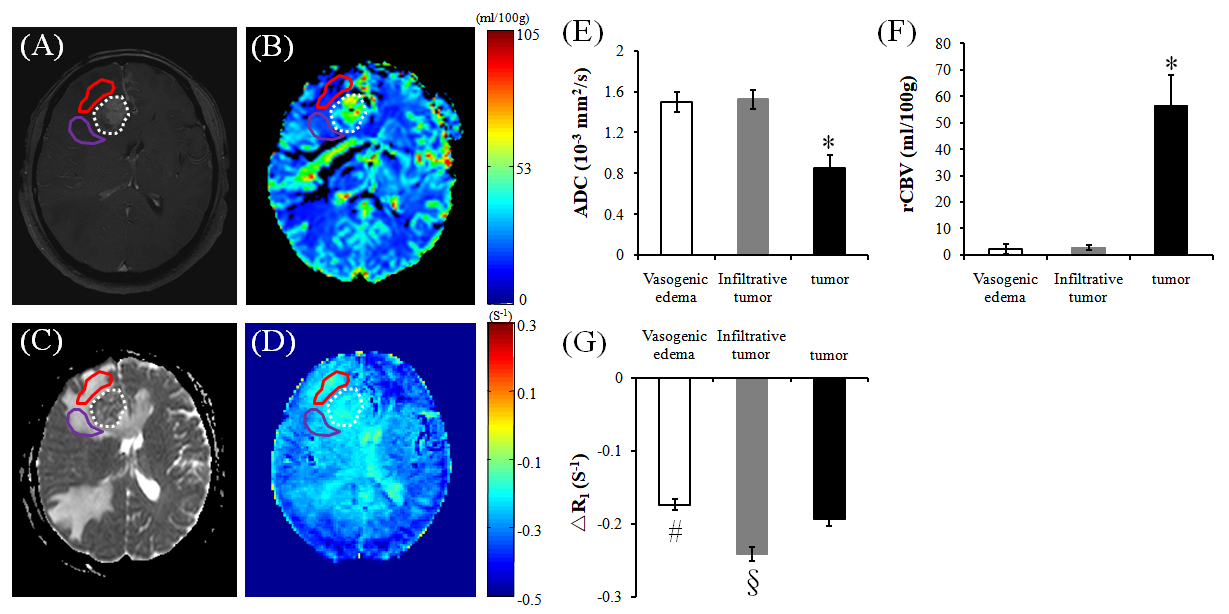
Fig.1 shows that tumor site appears high signal (contrast agent enhanced) in post-Gadolinium T1-weighted image, and peritumoral area appear high signal in the ADC map and low signal in the rCBV map. Significant larger ADC values and smaller rCBV levels (p < 0.05) were observed both in the vasogenic edema and infiltrative tumor area compared to those in the tumor site. Significant more negative ΔR1 levels (p < 0.05) were also observed in the infiltrative tumor area compared to those in the vasogenic edema and tumor site (-0.242±0.010 VS -0.174±0.008 and -0.194±0.009, respectively).DISCUSSION
The negative ΔR1 in the tumor site outlined both in the oxygen enhanced image and post-Gadolinium image suggestive of hypoxia, which may be associated with increased oxygen consumption due to cellular proliferation indicated by relative smaller ADC values although there were higher rCBV levels in those regions 5. Within the peritumoral area, the areas with more negative ΔR1 in this study may indicate tumor infiltration in those regions compared to that with less negative ΔR1 while they all had similar imaging patterns, i.e., high signal in ADC map or low signal in rCBV map, which agrees well with previous studies that more negative ΔR1 were observed in the tumor than those in radiation-induced necrosis 4. In conclusion, oxygen-enhanced MR imaging has thus the potential to differentiate infiltrative tumor from vasogenic edema in glioblastoma.Acknowledgements
This work was supported by the National Natural Science Foundation of China (http://www.nsfc.gov.cn/) grant 81201068 and 81871085.References
1. Artzi M, Liberman G, Blumenthal DT, et al. Differentiation Between Vasogenic Edema and Infiltrative Tumor in Patients With High-Grade Gliomas Using Texture Patch-Based Analysis. J Magn Reson Imag 2018;48:729–736.
2. Linnik IV, Scott ML, Holliday KF, et al. Noninvasive tumor hypoxia measurement using magnetic resonance imaging in murine U87 glioma xenografts and in patients with glioblastoma. Magn Reson Med. 2014;71(5):1854-62.
3. Qian JC, Yu X, Li BB, et al. In vivo Monitoring of Oxygen Levels in Human Brain Tumor Between Fractionated Radiotherapy Using Oxygen-enhanced MR Imaging. Curr Med Imaging Rev. 2018; (In Press).
4. Beeman SC, Shui YB, Perez-Torres CJ, et al. O2 -sensitive MRI distinguishes brain tumor versus radiation necrosis in murine models.Magn Reson Med. 2016;75(6):2442-7.
5. Boonzaier NR, Larkin TJ, Matys T. Multiparametric MR Imaging of Diffusion and Perfusion in Contrast-enhancing and Nonenhancing Components in Patients with Glioblastoma. Radiology. 2017;284(1):180-190
Figures