2319
Interrogations of Human Lung Cancer Metabolomics Measured from Intact Tissue Magnetic Resonance Spectroscopy with Mass Spectrometry ImagingStephen J Eyles1, Mari Mino-Kenudson2, Igor A Kaltashov1, Richard W Vachet1, Yiying Zhang3, Kristen Sikora1, Cedric Bobst1, David C Christiani4, and Leo L Cheng5
1University of Massachusetts Amherst, Amherst, MA, United States, 2MGH/Harvard Medical School, Combridge, MA, United States, 3MGH/Harvard Medical School, Charlestown, MA, United States, 4Harvard School of Public Health, Boston, MA, United States, 5Radiology and Pathlogy, MGH/Harvard Medical School, Charlestown, MA, United States
Synopsis
Current radiology can detect small lung cancer (LuCa) lesions. However, their high costs coupled with their unproven efficacies as screening tools have prevented their use in annual screening protocols to detect LuCa at early and clinically asymptomatic stages. A simple and non-invasive screening technique, preferably a blood test, is needed to control the disease. Here we present results from mass spectrometry imaging that can produce localized “microscopic” maps of cancer metabolomic distributions revealed by high-resolution magic angle spinning magnetic resonance spectroscopy (HRMAS MRS), and can further assist establish blood serum LuCa biomarkers from analyses of human LuCa tissue-serum paired samples.
INTRODUCTION
Currently, advanced radiological examinations, such as CT, can detect small lung cancer (LuCa) lesions. For both high-risk populations and the general public, however, these technologies’ extremely high cost and unproven efficacy prevent their use in annual screening protocols aimed at detecting early, asymptomatic LuCa. A simple, non-invasive LuCa screening technique, preferably a blood test, is needed to detect and control the disease. As reported on the last year’s meeting, our laboratory has engaged in the discovery and interrogation of LuCa metabolomic markers by applying intact tissue MRS analyses on paired LuCa tissue and serum samples obtained from LuCa patients. Although tissues thus measured are in ~mg scales, they are “macroscopic” as considered by pathology and contain mixtures of cellular features. Following identifications of potential LuCa metabolomic candidates from tissue and serum MRS and utilizing the capability of mass spectrometry imaging (MSI) in mapping of MRS-revealed tissue metabolites onto a pathology image at nearly a single-cell scale. We measured MSI and mass spectrometry (MS) for tissue and serum samples, respectively, to interpret these metabolomic markers according to LuCa pathologies.METHODS
The initial feasibility study group of MSI of tissues and MS of sera from our MRS studied tissue-serum pairs included six LuCa patients of both squamous cell carcinoma and adenocarcinoma (SCC=3, 2F, 1M, Age=75.2±4.5; Adeno=3, 2F, 1M, Age=66.3±6.3), as well as sera from three controls (2F, 1M, age=62.7±13.0). Tissue samples were embedded in Agarose Tablets (Precisionary Instrument, Boston, MA) and frozen sectioned into 12 mm thickness and mounted on indium tin oxide-coated microscope slides. Two ionizing matrices used for Matrix-Assisted Laser Desorption/Ionization (MALDI) MSI, 2,5-dihydroxybenzoic acid (DHB) and alpha-cyano-4-hydroxycinnamic acid (CHCA) were tested as coating matrices. Tissue MSI were measured on an ultrafleXtreme (Bruker Daltonics, Billerica, MA) MALDI-TOF/TOF mass spectrometer. Serum MS were measured on a SolariX 7T (Bruker Daltonics, Billerica, MA) hybrid quadrupole/ FT ICR mass spectrometer with a 7.0 Tesla actively shielded magnet equipped with electrospray ionization sources and an integrated HPLC system.RESULTS
It has been widely acknowledged that the commonly used frozen section medium, OCT, produces interfering signals when used in the preparation of tissue sections for MALDI MSI. After testing a number of cutting media, the Agarose Tablets were concluded as the most approprate medium for MALDI imaging of cellular metabolites. Our tests also determined that comparing with DHB, CHCA coating matrix is more suitable for our study , that will be presented below. Previously, our MRS metabolomic analyses of LuCa tissue-serum pairs identified a group of cellular metabolites as potential markers, as shown in Table 1. Here, we interrogate these markers further with tissue MSI and serum MS. Examples of our resulting MALDI MSI are shown in Fig. 1. Data in this figure illustrate that LuCa and necrosis identified by histology in Case A (M, 72yo, SCC, Stage I) presented increased metabolic intensities for both glutamine (Gln) and phosphocholine (PChol), which were not seen with necrosis alone (B, F, 72yo, Adeno, Stage I). Of note, the interpretation of PChol increase requires caution, as an increase in collagen can also result in the PChol increase as seen in (C, F, 60yo, SCC, Stage I). However, in that case, the increase in Gln is almost absent. This observation further emphasizes the importance of conducting metabolomic evaluations, rather than merely observing individual metabolites. Comparing serum measurements with MRS and MS also presented corroborative results for these analyzed nine cases. Fig. 2. presents an example of a linear correlation observed between concentrations of glycerylphosphorylcholine (GPC) measured from MS, and of a spectral region that includes both PChol and GPC from MRS. The linear realtionship appears to indicate that the analyzed MRS spectral region is primarily contributed by GPC.DISCUSSION
Our preliminary study presented here demonstrates feasibility of combining MSI and MS with MRS analyses of human LuCa metabolomics with tissue and serum samples. These results further emphasize the need of using a metabolomic approach, i.e. a holistic approach, in discovering and integrating metabolic markers, rather than evaluating only single metabolites. While the above presented data are extremely encouraging, further analyses of other metabolite markers presented in Table 1, have been and are still being evaluated in our laboratories. Furthermore, additional tissue-serum pairs from more diverse patient populations are in the process of MSI and MS analyses.CONCLUSION
Used in tandem with MRS, MSI can produce localized “microscopic” maps of cancer metabolomic distributions revealed by HRMAS MRS. The combination of these two approaches has the potential to elevate cancer metabolomic research to a new, advanced platform.Acknowledgements
Research reported in this publication was supported by the National Cancer Institute of the National Institutes of Health under award numbers R01CA115746 and R21CA162959 (Cheng) and U01CA209414 (Christiani). We gratefully acknowledge the support of the Massachusetts General Hospital Athinoula A. Martinos Center for Biomedical Imaging.References
No reference found.Figures
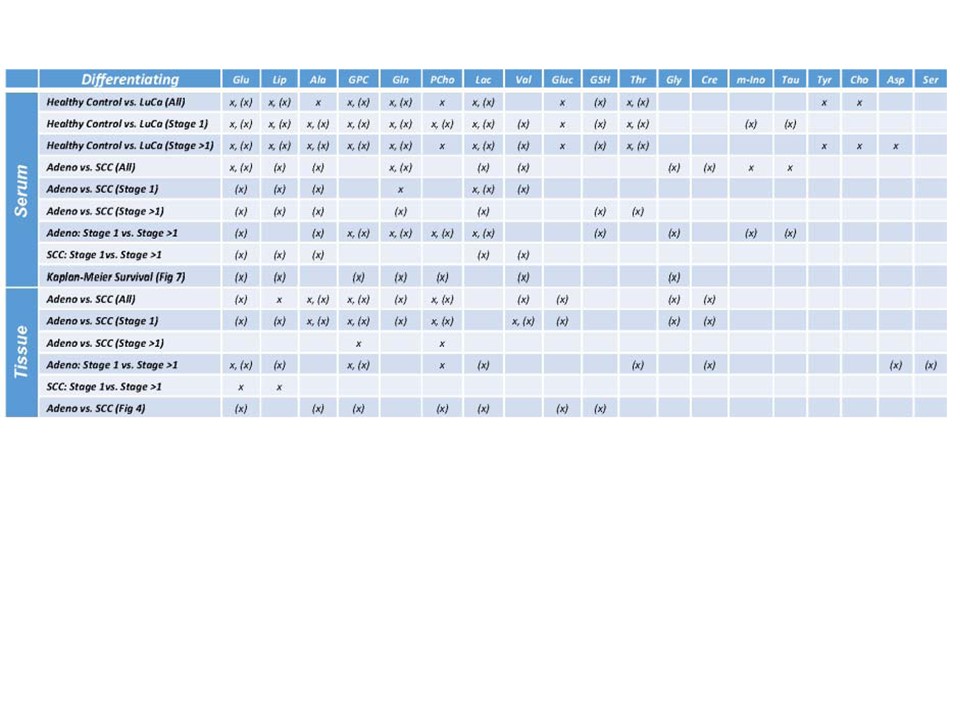
Table 1. Human LuCa Serum and Tissue MRS Metabolic, with x, and Metabolomic, with (x), Candidates.
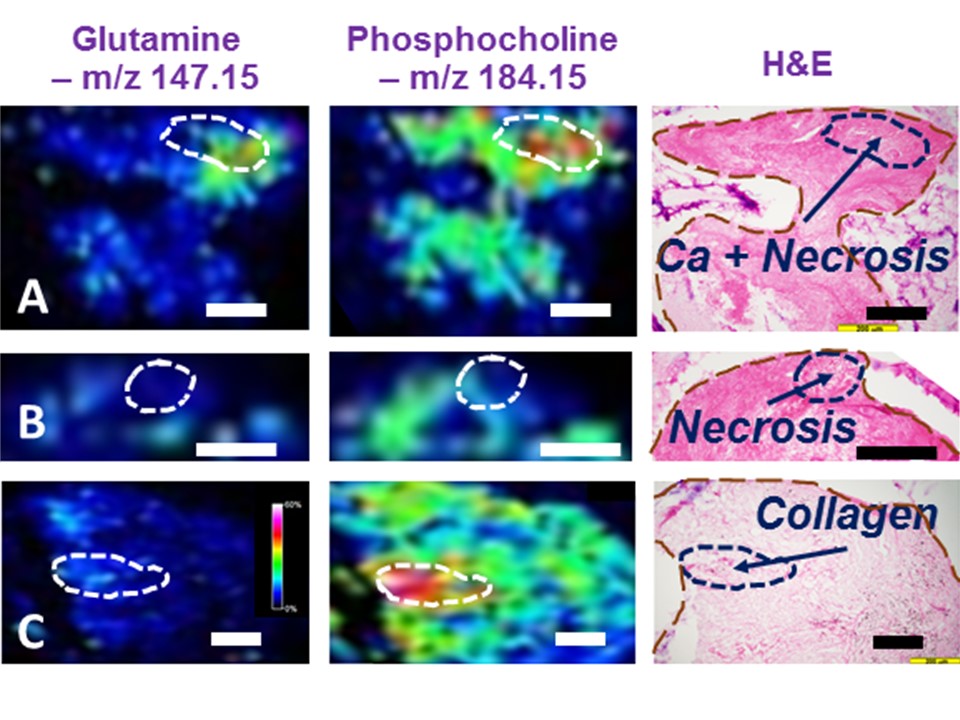
Fig.1.
MSI of human LuCa metabolomic maps. (A) SCC, Stage I, M, 72.2y.o. (B)
Adeno, I, F, 71.8, and (C) SCC, I, F, 59.6. Black and white bars denote 200μm.
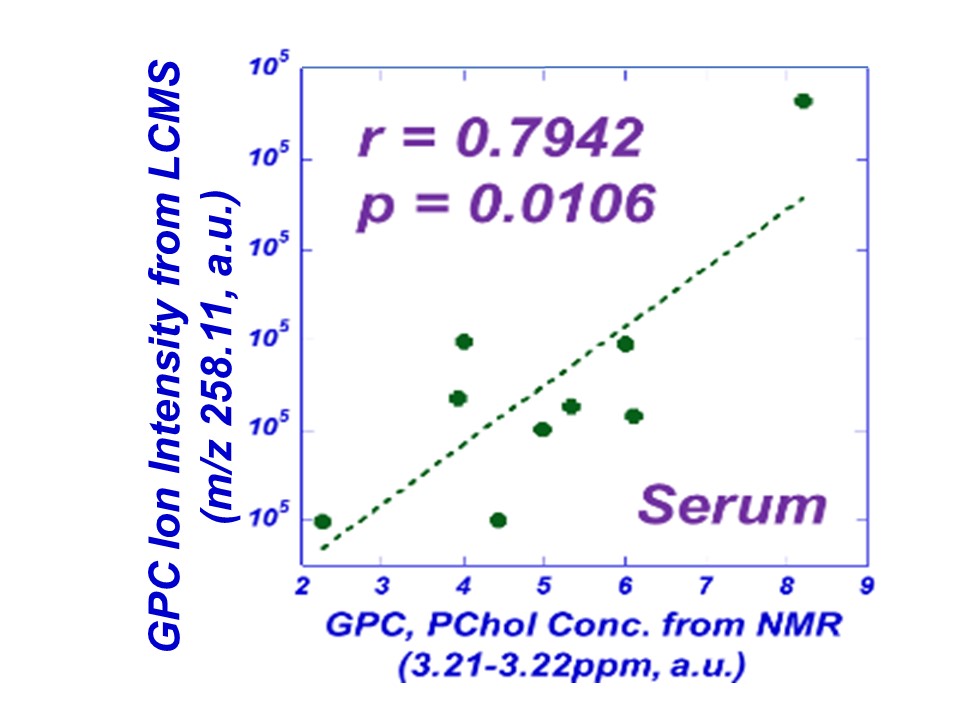
Fig.
2. Correlations between MSI and MRS measured metabolite concentrations.