2232
Quantification of edited magnetic resonance spectroscopy: a comparative phantom based study of analysis methods1CUBRIC, Cardiff university, CARDIFF, United Kingdom, 2School of Computer Science and Informatics, Cardiff University, Cardiff, United Kingdom, 3Physics, Swansea University, Swansea, United Kingdom, 4Centre for Nanohealth & Clinical Imaging Unit, Institute for Life Science, Swansea University, Swansea, United Kingdom
Synopsis
A calibrated series of MRS phantoms is used to compare the performance of common spectroscopy analysis tools in the quantification of GABA-edited spectroscopy data. Varied GABA concentration, and simulated spectra provide a ground truth with which to compare.
Introduction
Quantification of metabolites and neurotransmitters has a wide range of applications in neuroscience. Gamma-Aminobutyric acid (GABA) is the primary inhibitory neurotransmitter in the central nervous system, maintaining the excitation–inhibition balance1. Its prominent role in both neurotransmission and metabolism has led to extensive study, and a plethora of potential applications for its detection. These include: schizophrenia2,3, epilepsy4,5, diabetes6, autism spectrum disorders7, anxiety disorders8,9, and depression10. However, quantifying GABA is challenging: it exists in the brain in mMolar concentrations, and relatively stronger signals, such as NAA, and creatine, will overlap with, and obscure the GABA signal. Spectral editing techniques such as MEGA-PRESS11 simplify the spectrum significantly, but the decomposition of this spectrum remains a non-trivial task. Several software packages have been developed to address this problem, but differences between model basis sets, fitting algorithms and pre-processing of the data gives rise to discrepancy in the reported concentrations. The goal of this study is to assess the robustness of GABA quantification using a calibrated phantom study. While phantoms have inevitable limitations, the establishment of a “ground truth” concentration allows a far more meaningful comparison of results.Methods
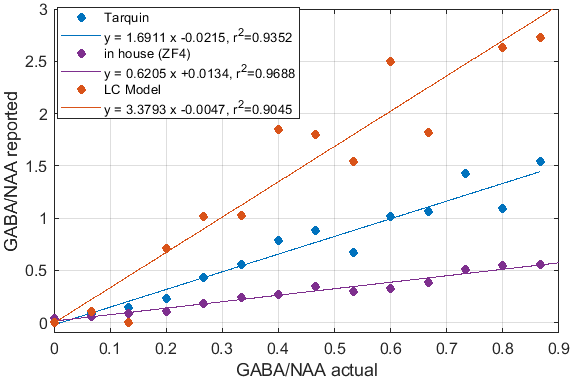
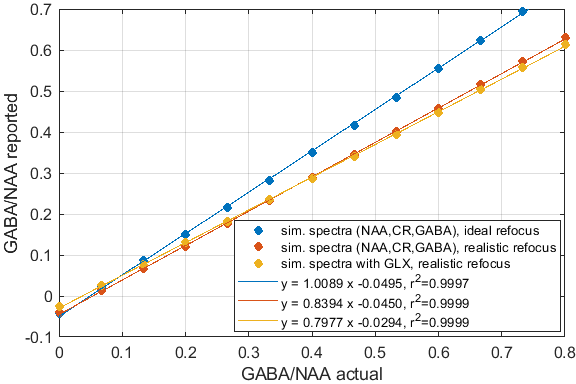
Several series of phantom data sets were created. The first involved pH adjusted liquid metabolite solutions at room temperature. Starting with fixed concentrations of NAA and Creatine, the amount of GABA in the solutions was incrementally increased. Other series were performed similarly but with additional metabolites such as glutamine and glutamate, increasing the complexity of the spectra. Finally, a series of gel phantoms with varying concentrations of several key metabolites NAA, Cre, Glu, Gln and GABA were prepared. Each phantom was scanned on a 3T Siemens Magnetom using the Siemens MEGAPRESS protocol. A 20x20x20mm voxel was selected at isocentre. The sequence parameters were: TR=2000ms, TE=68ms, 160 averages and a 1250Hz receive bandwidth was used acquire 2048 complex data points. The spectra acquired were analysed with in-house software and several commonly available quantification tools including TARQUIN12,13, JMRUI14,15, LCModel16,17, VeSPA18, and GANNET19. As a specific figure of merit the ratio of GABA to NAA was calculated, plotted against the actual concentration ratios for the phantom data series and linear fits were performed. The quantification routines were also tested against simulated spectra generated using FID-A20, and in-house code.Results
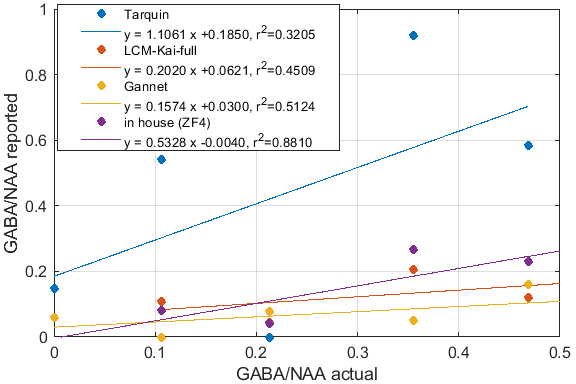
Significant differences in the GABA/NAA ratios reported by different tools were observed. In addition to differences in the values reported for individual spectra, there were also differences in the linearity of the reported vs actual GABA/NAA ratios and quality-of-fit. LCM results showed a tendency to underestimate the relative concentrations of GABA, while Tarquin tended overestimate it. Gannet also tended to underestimate GABA, and more significantly than LCM. All of the quantification tools performed significantly better for pH adjusted liquid metabolite solutions than for tissue-mimicking gel phantoms. Tests on simulated spectra suggest that the underestimation of GABA may be the result of imperfect editing of GABA over the entire voxel volume for realistic editing and refocusing pulses. For spectra generated using realistic editing pulses but ideal refocusing pulses, the quantification was extremely accurate, but when more realistic refocusing pulses were used, GABA/NAA ratios were underestimated by at least 20% on average, which is slightly better than the experimental results for both our in house software and LCM results, which suggest underestimation of at least 30-40%Discussion
Significant differences in the concentration ratios reported by different tools when supplied with identical input spectra, and significant discrepancies between reported ratios and actual ratios suggest that more work is necessary to ensure accurate and robust quantification. The tools investigated differ in many ways ranging from differences in the basis sets used, to differences pre-processing and fitting algorithms. More work is needed to elucidate the origins of the differences. From our in house analysis, we found that extensive pre-processing was often detrimental, and that the most accurate and robust results were achieved with a simple numerical peak-area-integration algorithm and minimal pre-processing. The numerical integration outperformed model-based peak fitting routines in terms of consistency and accuracy of the results. Simulations suggest that the observed underestimation of GABA is likely attributable to non-uniform editing efficiency, which may be reduced by newer sequences such as MEGA-sLASER.Conclusion
More work is required to elucidate the origin of differences observed. Larger phantom studies using different hardware and sequence implementations are desirable as well as systematic comparison of quantification results obtained for in-vivo spectra.Acknowledgements
No acknowledgement found.References
[1] D. A. McCormick, “GABA as an inhibitory neurotransmitter in humancerebral cortex,” Journal of Neurophysiology, vol. 62, pp. 1018–1027,nov 1989.
[2] T. Hashimoto, D. W. Volk, S. M. Eggan, K. Mirnics, J. N. Pierri, Z. Sun,A. R. Sampson, and D. A. Lewis, “Gene Expression Deficits in a Subclassof GABA Neurons in the Prefrontal Cortex of Subjects with Schizophre-nia,” The Journal of Neuroscience, vol. 23, pp. 6315–6326, jul 2003.
[3] M. D. Simpson, P. Slater, J. F. Deakin, M. C. Royston, and W. J. Skan,“Reduced GABA uptake sites in the temporal lobe in schizophrenia,”Neuroscience Letters, vol. 107, pp. 211–215, dec 1989.
[4] S. Baulac, G. Huberfeld, I. Gourfinkel-An, G. Mitropoulou, A. Beranger,J. F. Prud’homme, M. Baulac, A. Brice, R. Bruzzone, and E. LeGuern,“First genetic evidence of GABAAreceptor dysfunction in epilepsy: Amutation in the γ2-subunit gene,” Nature Genetics, vol. 28, pp. 46–48,may 2001.
[5] A. R. Brooks-Kayal, M. D. Shumate, H. Jin, T. Y. Rikhter, and D. A.Coulter, “Selective changes in single cell GABA(A) receptor subunitexpression and function in temporal lobe epilepsy.,” Nature medicine,vol. 4, pp. 1166–1172, oct 1998.1
[6] N. Soltani, H. Qiu, M. Aleksic, Y. Glinka, F. Zhao, R. Liu, Y. Li,N. Zhang, R. Chakrabarti, T. Ng, T. Jin, H. Zhang, W.-Y. Lu, Z.-P.Feng, G. J. Prud’homme, and Q. Wang, “GABA exerts protective andregenerative effects on islet beta cells and reverses diabetes,” Proceedingsof the National Academy of Sciences, vol. 108, no. 28, pp. 11692–11697,2011.
[7] M. K. Brix, L. Ersland, K. Hugdahl, R. Gr ̈ uner, M.-B. Posserud, ̊ A. Hammar, A. R. Craven, R. Noeske, C. J. Evans, H. B. Walker,T. Midtvedt, and M. K. Beyer, “Brain MR spectroscopy in autism spec-trum disorderthe GABA excitatory/inhibitory imbalance theory revis-ited,” Frontiers in Human Neuroscience, vol. 9, no. June, pp. 1–12,2015.
[8] R. B. Lydiard, “The role of GABA in anxiety disorders,” 2003.
[9] C. E. Robertson, E. M. Ratai, and N. Kanwisher, “Reduced GABAergicAction in the Autistic Brain,” Current Biology, vol. 26, pp. 80–85, jan2016.
[10] G. Sanacora, G. F. Mason, D. L. Rothman, K. L. Behar, F. Hyder, O. A.Petroff, R. M. Berman, D. S. Charney, and J. H. Krystal, “Reduced cor-tical γ-aminobutyric acid levels in depressed patients determined by pro-ton magnetic resonance spectroscopy,” Archives of General Psychiatry,vol. 56, pp. 1043–1047, nov 1999.
[11] M. Mescher, H. Merkle, J. Kirsch, M. Garwood, and R. Gruetter, “Si-multaneous in vivo spectral editing and water suppression,” NMR inBiomedicine, vol. 11, no. 6, pp. 266–272, 1998.
[12] G. Reynolds, M. Wilson, A. Peet, and T. N. Arvanitis, “An algorithmfor the automated quantitation of metabolites in in vitro NMR signals,”Magnetic Resonance in Medicine, vol. 56, no. 6, pp. 1211–1219, 2006.
[13] M. Wilson, G. Reynolds, R. A. Kauppinen, T. N. Arvanitis, and A. C.Peet, “A constrained least-squares approach to the automated quanti-tation of in vivo 1 H magnetic resonance spectroscopy data,” MagneticResonance in Medicine, vol. 65, pp. 1–12, jan 2011.
[14] A. Naressi, C. Couturier, J. M. Devos, M. Janssen, C. Mangeat, R. DeBeer, and D. Graveron-Demilly, “Java-based graphical user interfacefor the MRUI quantitation package,” Magnetic Resonance Materials inPhysics, Biology and Medicine, vol. 12, no. 2-3, pp. 141–152, 2001.2
[15] D. Stefan, F. D. Cesare, A. Andrasescu, E. Popa, A. Lazariev,E. Vescovo, O. Strbak, S. Williams, Z. Starˇcuk, M. Cabanas, D. Van Or-mondt, and D. Graveron-Demilly, “Quantitation of magnetic resonancespectroscopy signals: The jMRUI software package,” Measurement Sci-ence and Technology, vol. 20, no. 10, 2009.
[16] S. W. Provencher, “Estimation of metabolite concentrations from local-ized in vivo proton NMR spectra,” Magnetic Resonance in Medicine,vol. 30, pp. 672–679, dec 1993.
[17] S. W. Provencher, “Automatic quantitation of localized in vivo1H spec-tra with LCModel,” NMR in Biomedicine, vol. 14, pp. 260–264, jun2001.
[18] B. Soher, D. Semanchuk, D. Todd, J. Steinberg, and K. Young, “VeSPA:Integrated applications for RF pulse design, spectral simulation andMRS data analysis,” Proceedings of the 19th Annual Meeting ISMRM,vol. 19, no. 19, p. 1410, 2011.
[19] R. Edden, N. A. J. Puts, A. D. Harris, P. B. Barker, and C. J.Evans, “Gannet: A batch-processing tool for the quantitative analysisof gamma-aminobutyric acid-edited MR spectroscopy spectra,” Journalof Magnetic Resonance Imaging, vol. 40, no. 6, 2014.
[20] R. Simpson, G. A. Devenyi, P. Jezzard, T. J. Hennessy, and J. Near,“Advanced Processing and Simulation of MRS Data Using the FID Ap-pliance ( FID-A ) An Open Source , MATLAB-Based Toolkit,” MagneticResonance in Medicine, vol. 33, pp. 23–33, jan 2017.
Figures
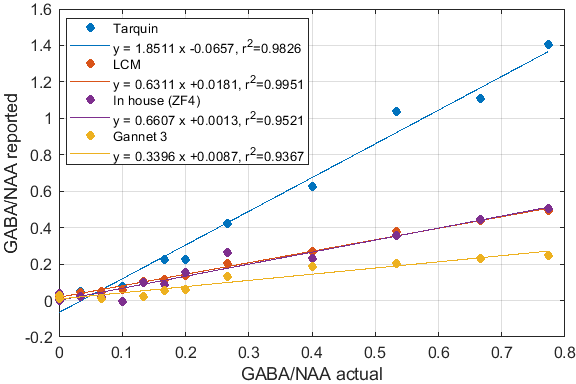
Fig.1: Reported GABA/NAA concentration ratios and linear fits for different tools for a series of liquid metabolite solutions with fixed concentration of NAA (15mM) and CR (8mM) and increasing concentrations of GABA (0--11.6mM). A slope greater than 1 indicates systematic overestimation for Tarquin, while a slope less than 1 indicates underestimation, which appears to be dominant for all other tools. All tools achieve reasonable quality-of-fit with $r^2$ values ranging from 0.93 (Gannet) to 0.99 (LCM).