2178
Multi-Echo Flow-encoded Rosette (MELROSE) enables velocity and T2* assessment of both extravascular tissue and intravascular blood for motion robust, quantitative cardiovascular blood flow and oxygenation mapping1Radiology, Stanford University, Palo Alto, CA, United States, 2Stanford University, Palo Alto, CA, United States, 3Electrical Engineering, California Institute of Technology, Pasadena, CA, United States
Synopsis
Cardiac catheterization is an invasive albeit common procedure performed in children with congenital heart disease for intrathoracic oxygen saturation assessment, exposing patients to anesthesia and risk of infection and complication. Prior MRI based intrathoracic oximetry methods have been limited due to partial volume contamination of the blood pool with surrounding tissue and motion corruption. Recently, subtractive MRI oximetry methods have demonstrated reliability and robustness but are limited to Cartesian strategies in the brain[1, 2]. In this work we use a subtractive, velocity encoded, non-Cartesian rosette trajectory for quantitative, motion robust, extra and intravascular flow and T2* mapping entitled Multi Echo fLowencoded ROSEtte (MELROSE). We validate flow and T2* values in a flow phantom and present preliminary results in a healthy subject.
Background
Cardiac catheterization is an invasive albeit common procedure performed in children with congenital heart disease for intrathoracic oxygen saturation assessment, exposing patients to anesthesia and risk of infection and complication. Prior MRI based intrathoracic oximetry methods have been limited due to partial volume contamination of the blood pool with surrounding tissue and motion corruption. Recently, subtractive MRI oximetry methods have demonstrated reliability and robustness but are limited to Cartesian strategies in the brain[1, 2]. In this work we use a subtractive, velocity encoded, non-Cartesian rosette trajectory for quantitative, motion robust, extra and intravascular flow and T2* mapping entitled Multi Echo fLowencoded ROSEtte (MELROSE). We validate flow and T2* values in a flow phantom and present preliminary results in a healthy subject.Theory
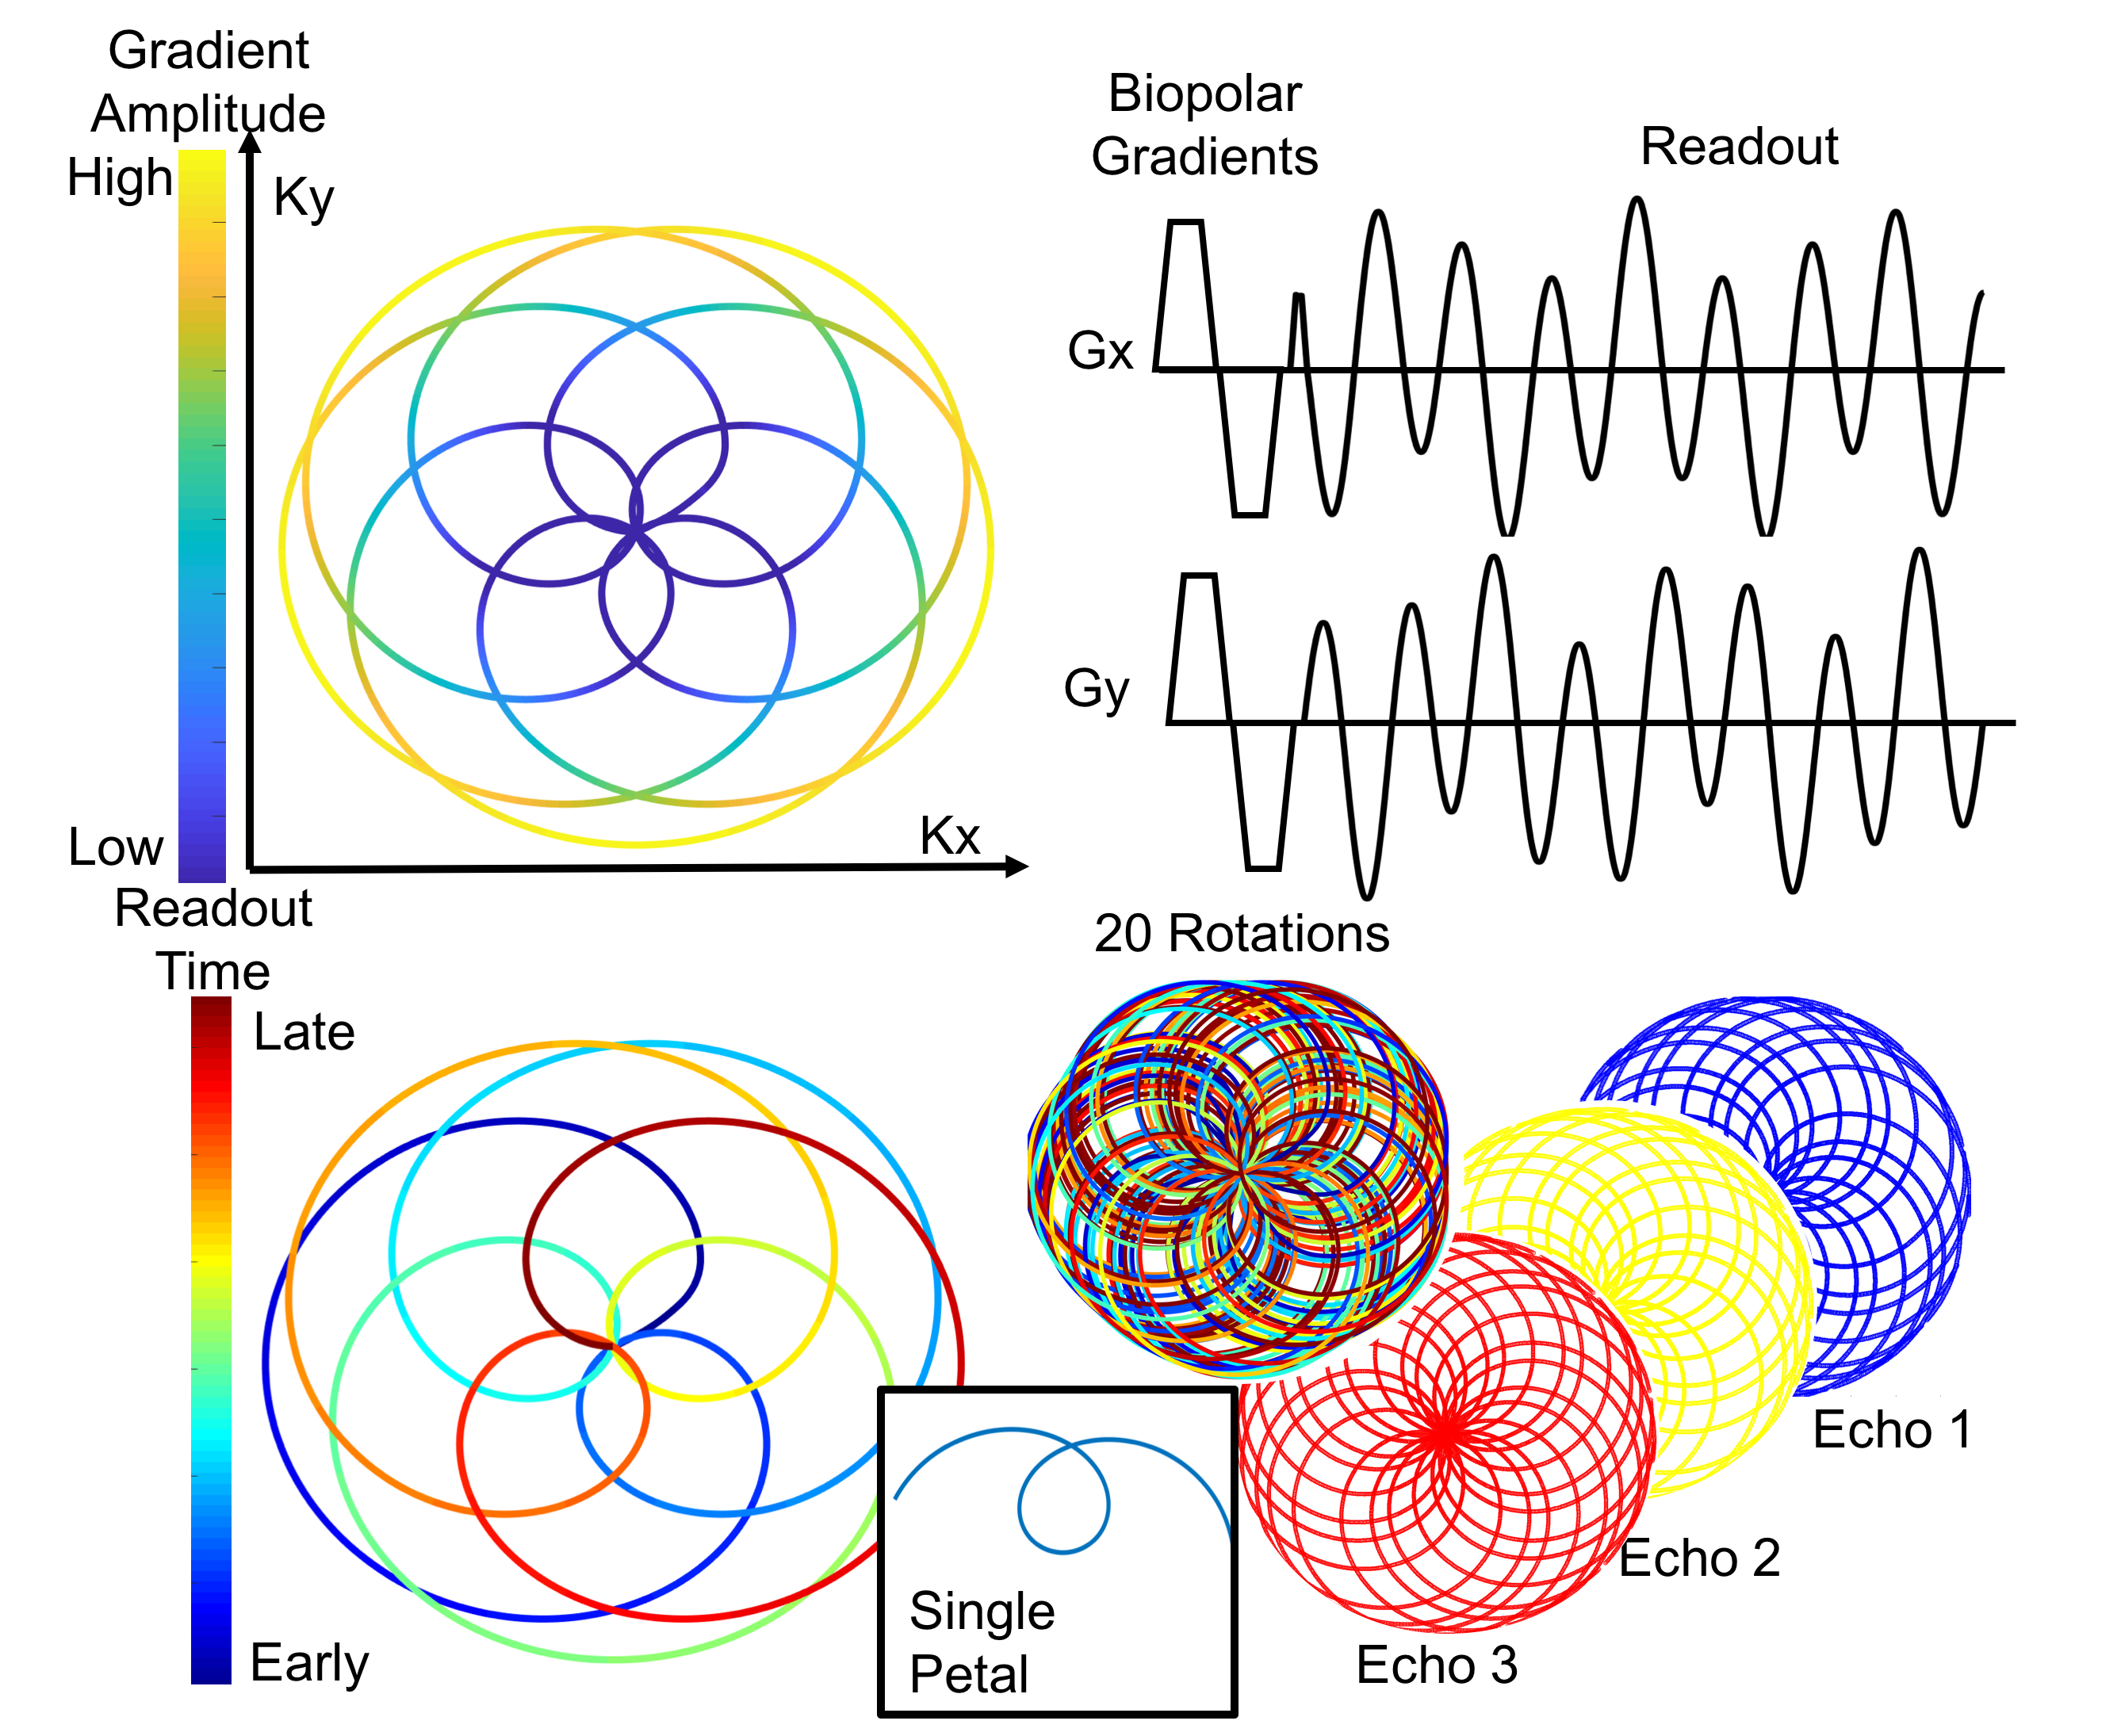
Rosette trajectories are flower-like k-space traversal patterns first described by Noll[3]. Rosette trajectories have several advantages over spiral and radial sequences, including higher average gradients and improved incoherence for compressed sensing application[4] yet remain largely unused. In this work, we use a novel rosette shape parameterization, q [5] (Figure 1).
Each repetition time, a “flower” is acquired, representing a highly undersampled k-space acquisition. By performing a multi-shot sequence and incrementing successive flowers by the golden angle (137.5°) a fully sampled data set can be acquired (Figure 1). Recombination of individual petals, or samples between temporally adjacent center crossings, allows for multi-echo reconstructions (Figure 1).
Methods
All scans were performed on a GE 750W with a 20 channel cardiac array.
A MELROSE sequence with bipolar, tetrahedral, velocity encoding gradients of 100 cm/s, q= 2.2, FA = 15, 1mm resolution and TR 20ms, maximum slew rate of 75 mT/m/ms, maximum gradient amplitude of 40mT/m, 350 shots(rotations) and 8mm slice thickness was used for phantom studies. The first 700 samples was used for an minimal echo time of 1.6ms and a window of 700 samples around successive center crossings produced echoes of 4.9, 7.7, 10.9 and 13.9ms for multi-echo images.
A MELROSE sequence with similar sequence parameters except for thru plane velocity encoding, 150 shots(rotations) and maximum slew rate of 150 mT/m/ms was used for in vivo studies.
A ferumoxytol doped water, gravity feed flow phantom was constructed. MELROSE assessment of velocity was compared to a Cartesian phase contrast sequence, whereas flow and T2* quantification was compared to timed collection and static gradient echo recalled multi-echo, respectively. Exponential fitting was performed on both the magnitude and phase difference images using in house MATLAB scripts.
In Vivo: With IRB approval and informed consent, a 28 y/o male volunteer was imaged.
Results
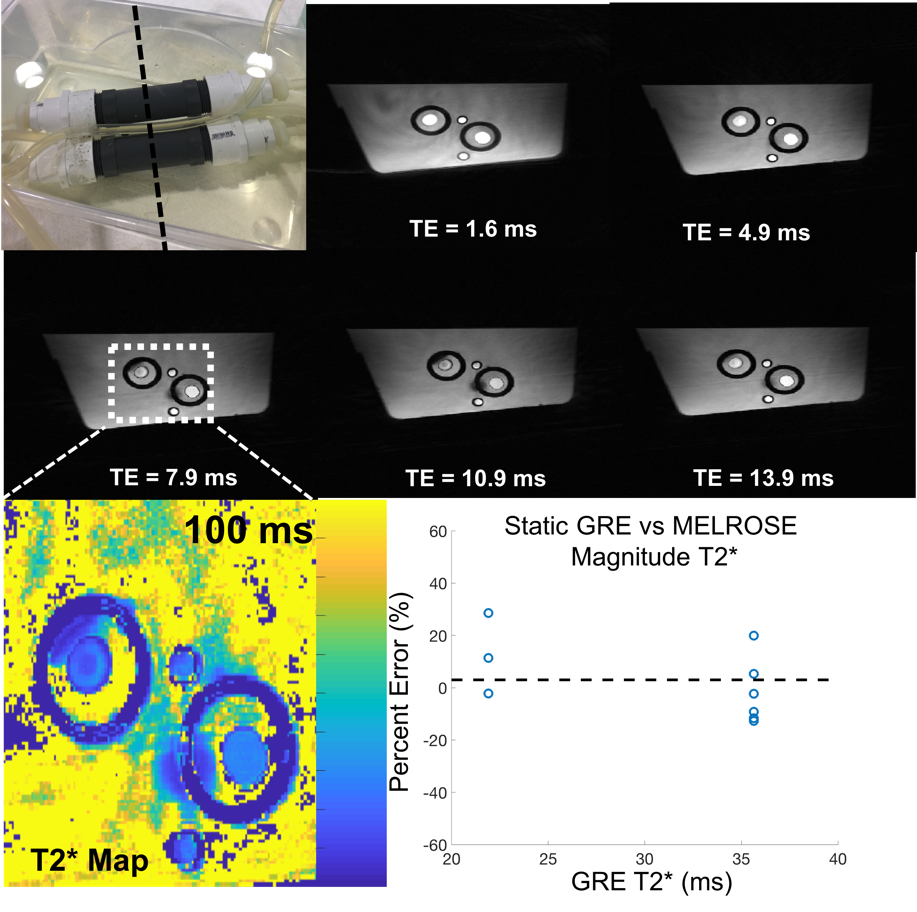
Without flow, the phantom T2* was measured at two ferumoxyotol concentrations with a gold standard GRE sequence, 35.6±1.8 ms and 21.9 ±1.0 ms. While flowing, the phantom T2* was also assessed using the MELROSE magnitude images (Figure 2) with an average error between GRE and MELROSE of 0.6%±13.3%.
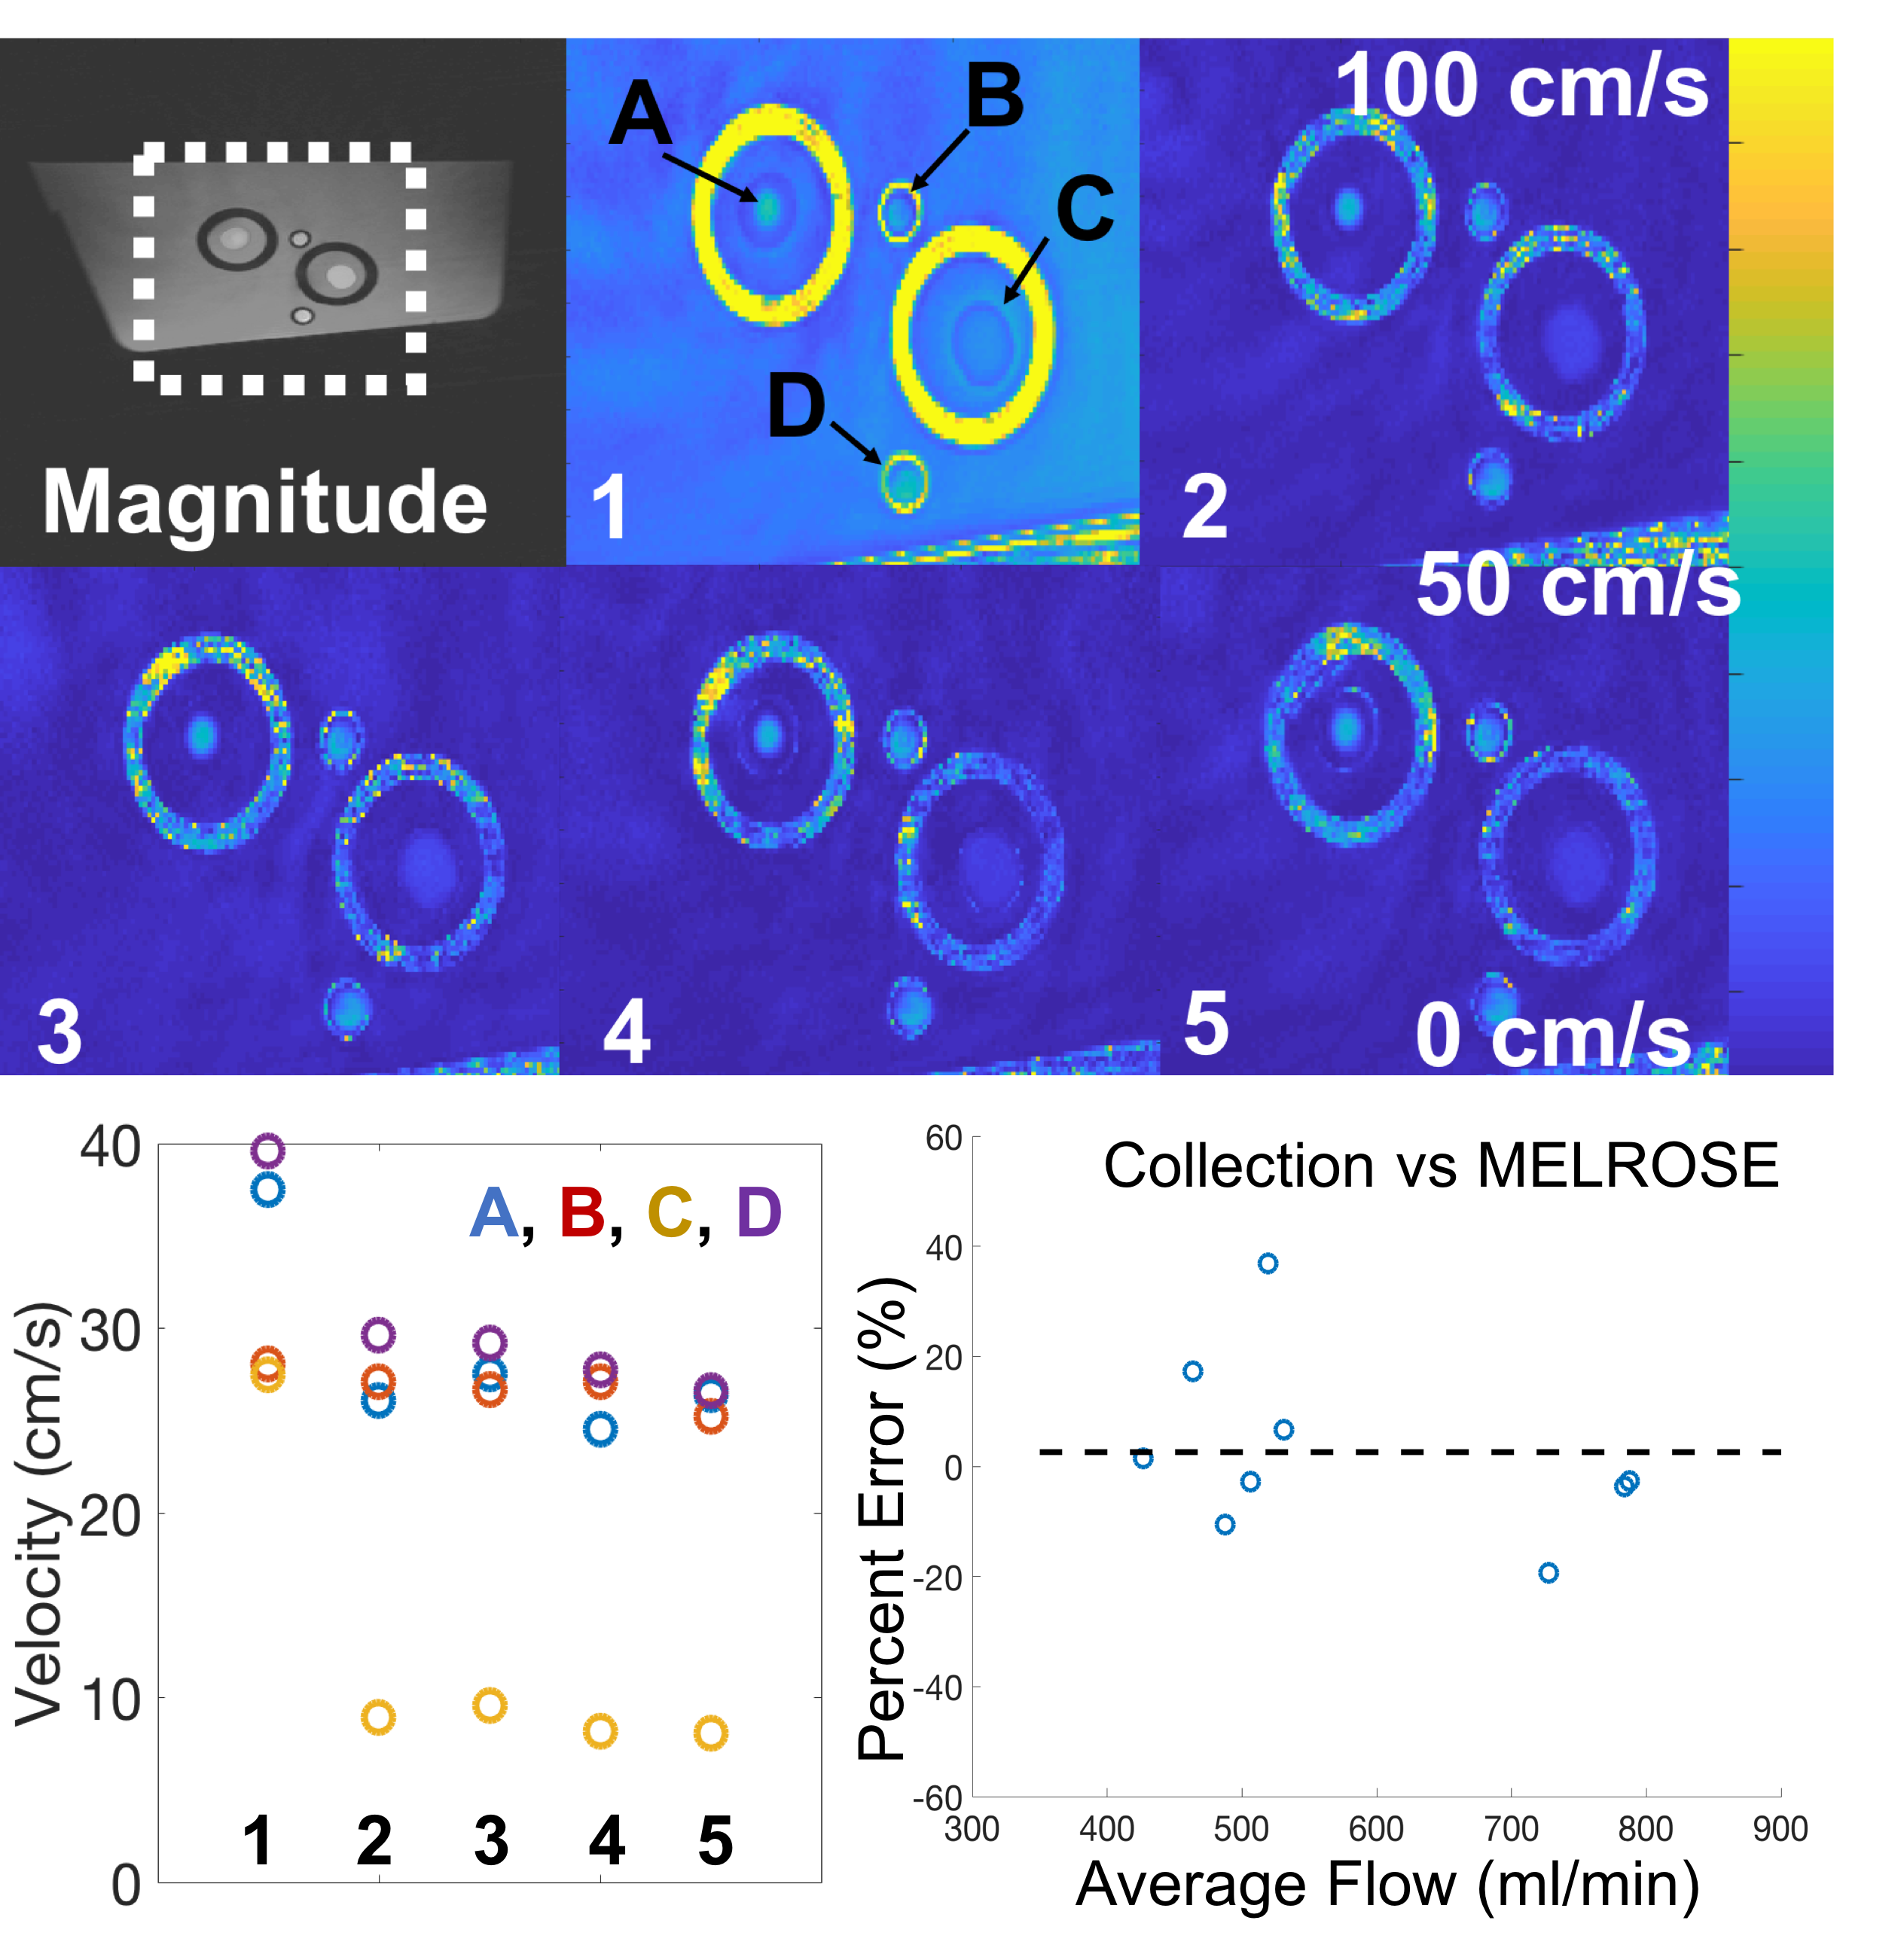
The varying lumen size of the phantom produced a wide range of velocities (Figure 3). Each MELROSE echo was used for velocity estimation. Due to the large bipolar gradients, an eddy current induced linear phase is observed during the minimal echo time causing an overestimation of velocity. The subsequent echoes showed agreement in velocity values (Figure 3). These velocity estimates were comparable to a Cartesian phase contrast sequence. (45.3±12.6, 26.4±11.3 and 9.21 ±1.9 cm/s Cartesian and 47.8±18.6, 27.7±12.0 and 8.48 ±2.6 cm/s using MELROSE). Independent, timed collection also had good agreement with MELROSE flow estimates, with an average error of 3.9% ± 17.4%(Figure 3).
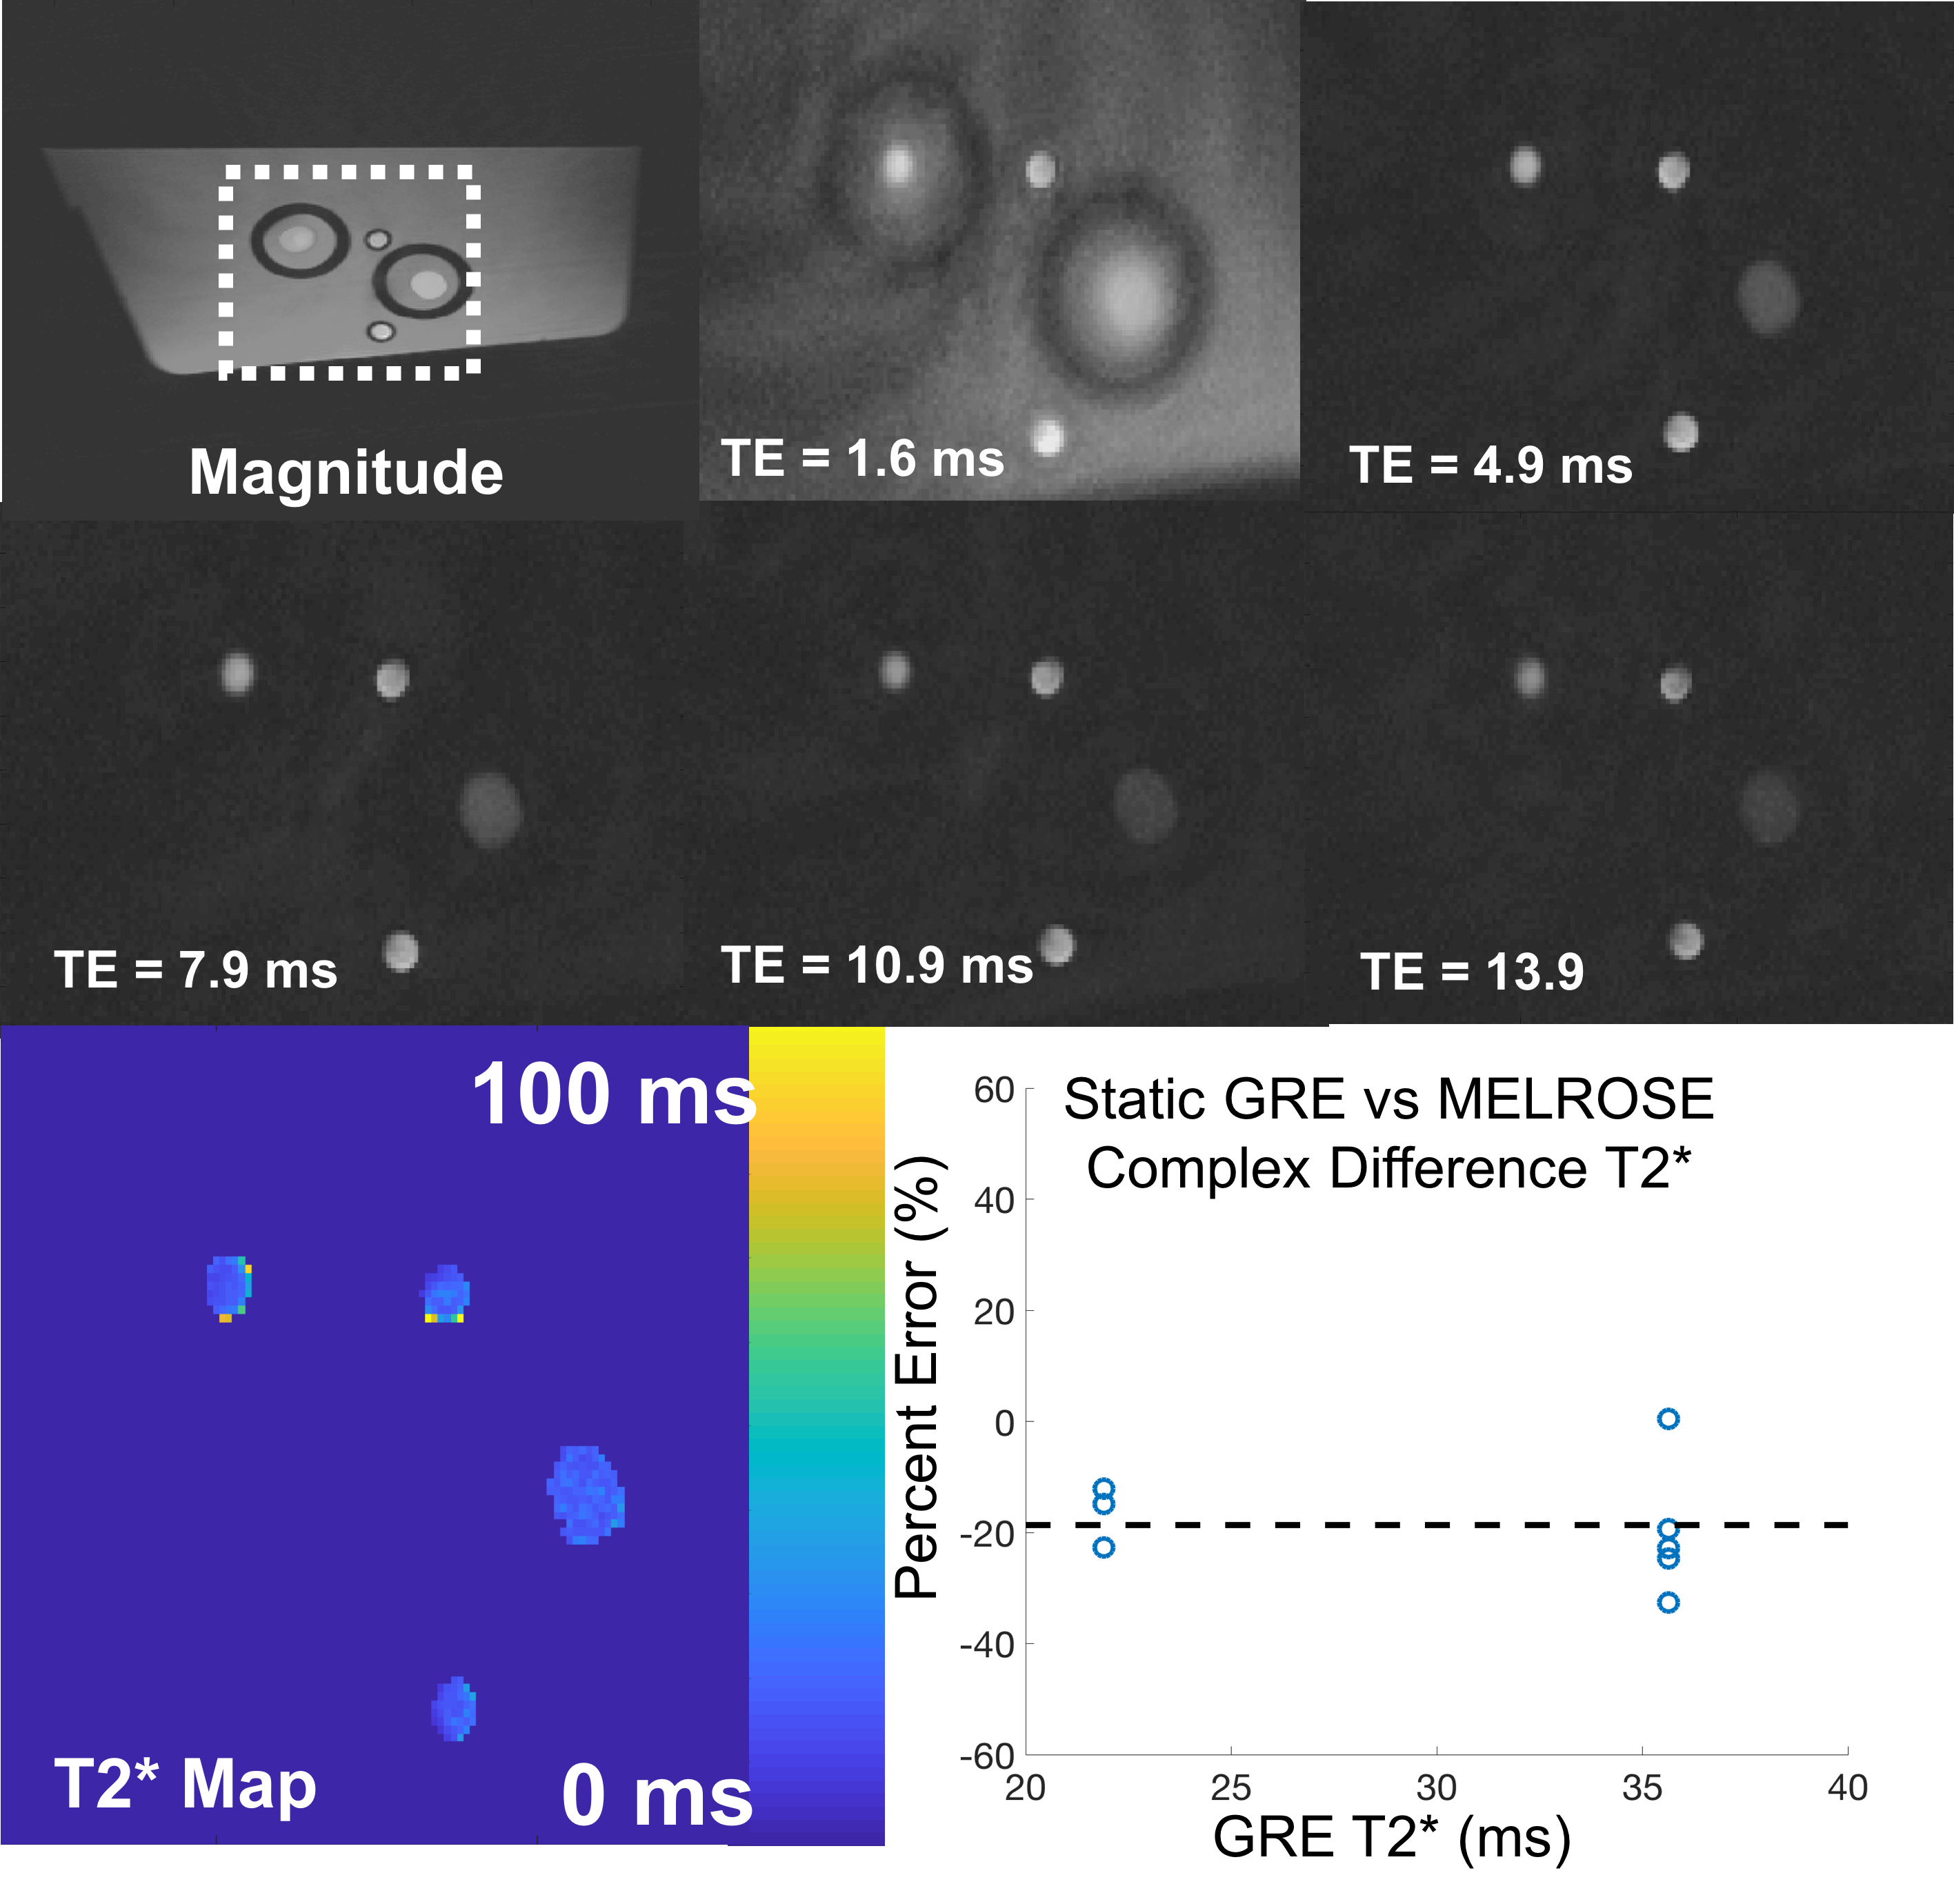
The magnitude of complex difference signal of the flow encode signal was also used to calculate an isolated flowing T2* (Figure 4). In this case, the MELROSE derived, flowing T2* underestimated the static GRE T2* by -21.5 ± 9.5%.
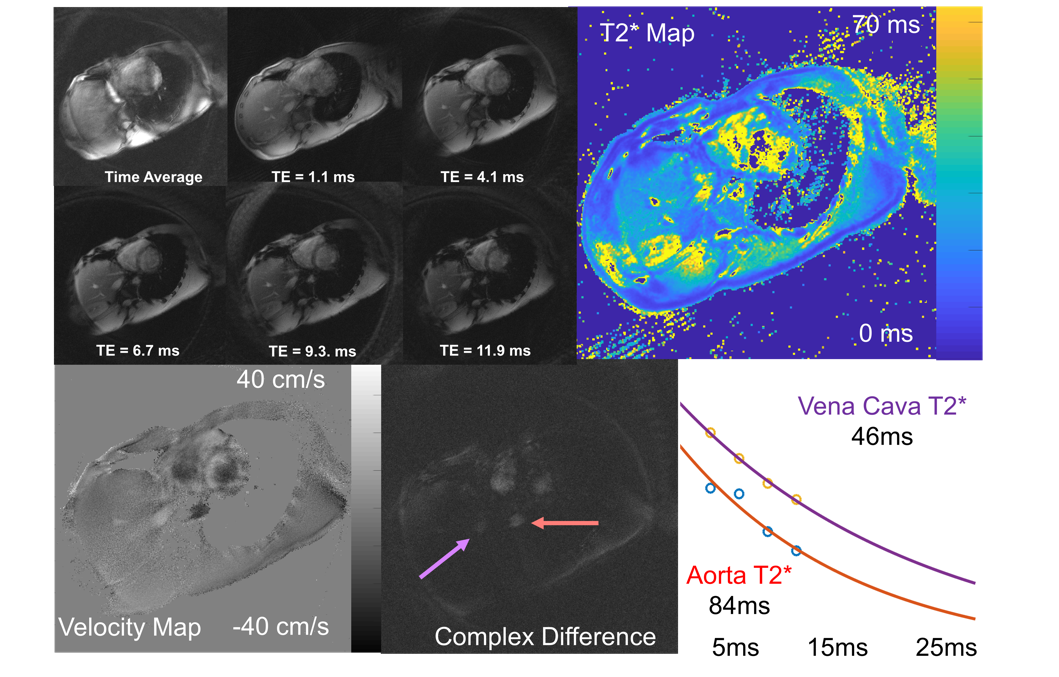
In the healthy subject, MELROSE was capable of deriving a tissue T2*, velocity and blood T2* parametric map (Figure 5). Region of interest and exponential fitting produced blood T2* estimates of the descending aorta and inferior vena cava in the appropriate range.
Discussion
Quantitative flow and T2* estimates were in good agreement using gold standard phase contrast, timed collection and MELROSE in a constant flow phantom. However, the complex difference signal did underestimate the gold standard T2* estimates. These phantom data and preliminary results in a healthy volunteer demonstrate feasibility for time resolved blood flow and T2* estimates in healthy subjects with applications for noninvasive flow and oxygenation assessment in children with congenital heart disease as surrogate to cardiac catheterization.Acknowledgements
Acknowledgements: NIH R01EB009690, R01 EB026136, R01DK117354. Research support from GE Healthcare. Adam Bush is Stanford Cardiovascular Institute Fellow NHLBI 5T32EB009035 (Multi-Disciplinary Training Program in Cardiovascular Imaging at Stanford)References
1] H. Lu and Y. Ge, "Quantitative evaluation of oxygenation in venous vessels using T2-Relaxation-Under-Spin-Tagging MRI," (in eng), Magn Reson Med, vol. 60, no. 2, pp. 357-63, Aug 2008. [
2] D. Mao, Y. Li, P. Liu, S. L. Peng, J. J. Pillai, and H. Lu, "Three-dimensional mapping of brain venous oxygenation using R2* oximetry," (in eng), Magn Reson Med, Jun 06 2017.
[3] D. C. Noll, "Multishot rosette trajectories for spectrally selective MR imaging," (in eng), IEEE Trans Med Imaging, vol. 16, no. 4, pp. 372-7, Aug 1997.
[4] Y. Li, R. Yang, C. Zhang, J. Zhang, S. Jia, and Z. Zhou, "Analysis of generalized rosette trajectory for compressed sensing MRI," (in eng), Med Phys, vol. 42, no. 9, pp. 5530-44, Sep 2015.
[5] . A Bush, C Sandino, S Ramachandran, D Zeng, J Cheng, M Alley, S Vasanawala. " Contiguous Rosette Echoes iN Single Highly Accelerated Acquisition (CRENSHAA) for Motion Robust and Resolved T2* Mapping ", ISMRM 2019 Abstract# 1964
Figures