1974
Analysis of Velocity Component Distribution and Cardiac Phase in Aortic Dissection False Lumen 3D Printed Models Using In Vitro 4D Flow MRI1Department of Radiology, University of Wisconsin - Madison, Madison, WI, United States, 2Department of Medical Physics, University of Wisconsin-Madison, Madison, WI, United States, 3Department of Mechanical Engineering, University of Wisconsin-Madison, Madison, WI, United States
Synopsis
False lumen hemodynamics is an important factor in aortic dissection progression. As a methodology to further characterize false lumen velocities, two patient-specific 3D printed models underwent 4D Flow MRI, from which histograms of velocity components were generated at several locations along the lumen. Two VENC settings were used and the data was grouped in diastole and systole. Histograms of normal and tangential components serve as descriptors of flow regimes and offer the possibility to correlate with thrombus formation and clinical progression. VENC is important especially for the assessment of tangential components.
Purpose
To analyze 3D printed aortic dissection false lumen velocity component distribution per cardiac phase, acquired with 4D Flow MRI using two VENCs.Introduction
Aortic dissection (AD) results in a false lumen, leading to complications including aneurysm growth, rupture, end-organ malperfusion and hypertension.1 Several studies highlight the importance of false lumen status - patent, partially, or completely thrombosed - as a disease progression factor;2 few studies have analyzed underlying hemodynamics. AD 4D Flow MRI is complex due to the wide velocity range and the propensity for chaotic flow regimes. Previous studies3,4 have acquired data with a VENC common for aorta imaging, but not necessarily for false lumen assessment, where low velocities often predominate. In this study, we analyze velocity component distributions during each cardiac phase within the false lumen of two 3D printed aortic dissection models at two VENC settings.Methods
Following IRB-approved and HIPAA-compliant protocols, magnetic resonance angiography (MRA) and computed tomography angiography (CTA) data from two patients (55 year-old female, MRA, and 40 year-old male, CTA) with acute descending thoracic AD were used to generate models for 3D printing.
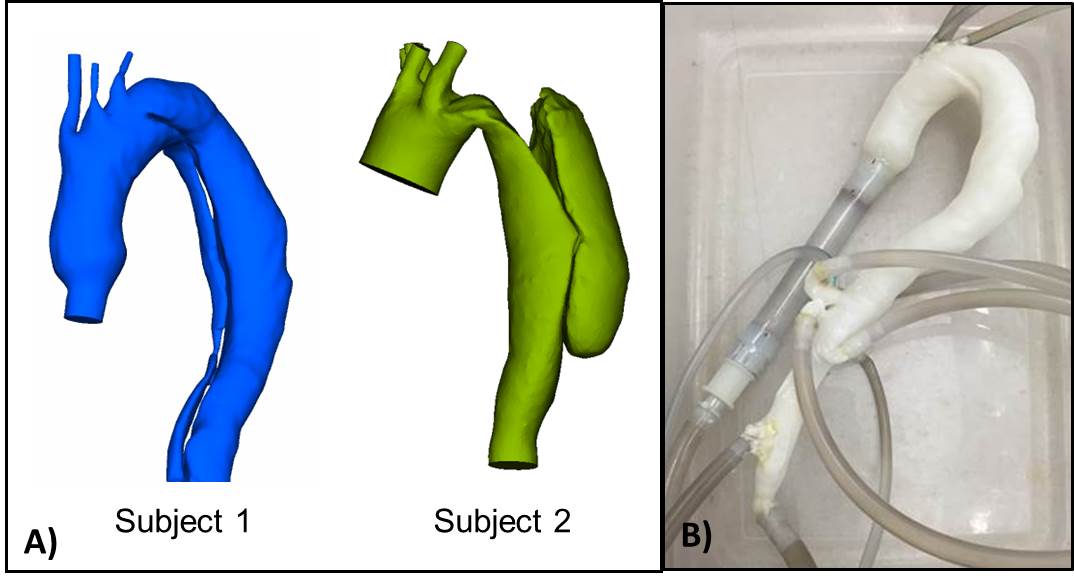
Patient-Specific Models: In vitro anatomical models were segmented from CTA images (Mimics, Materialise; Leuven, Belgium). Surfaces were corrected and smoothed (3-matic, Materialise) (Figure 1A); the geometries were hollowed and tubing connections were added at inlets (ascending aorta) and outlets (descending aorta and main arteries). The two geometries were exported in STL format for selective laser sintering 3D printing to scale.
In Vitro MRI: Each physical model (Figure 1B) was connected to a pulsatile pump (BDC PD-1100, BDC Laboratories, Wheat Ridge, CO) that circulated water at 4 L/min as the maximum input flow of a physiological flow waveform (35% systole, 60 bpm). In vitro 4D Flow MRI5 was performed on a 1.5T scanner (MR750, GE Healthcare, Waukesha, WI) with parameters: 320 x 320 x 320 mm FOV, 1.25 mm isotropic spatial resolution, TR/TE = 6.72/2.82 ms, FA = 8, scan time 10 minutes. For each model, two VENCs were used: 70 and 150 cm/s.
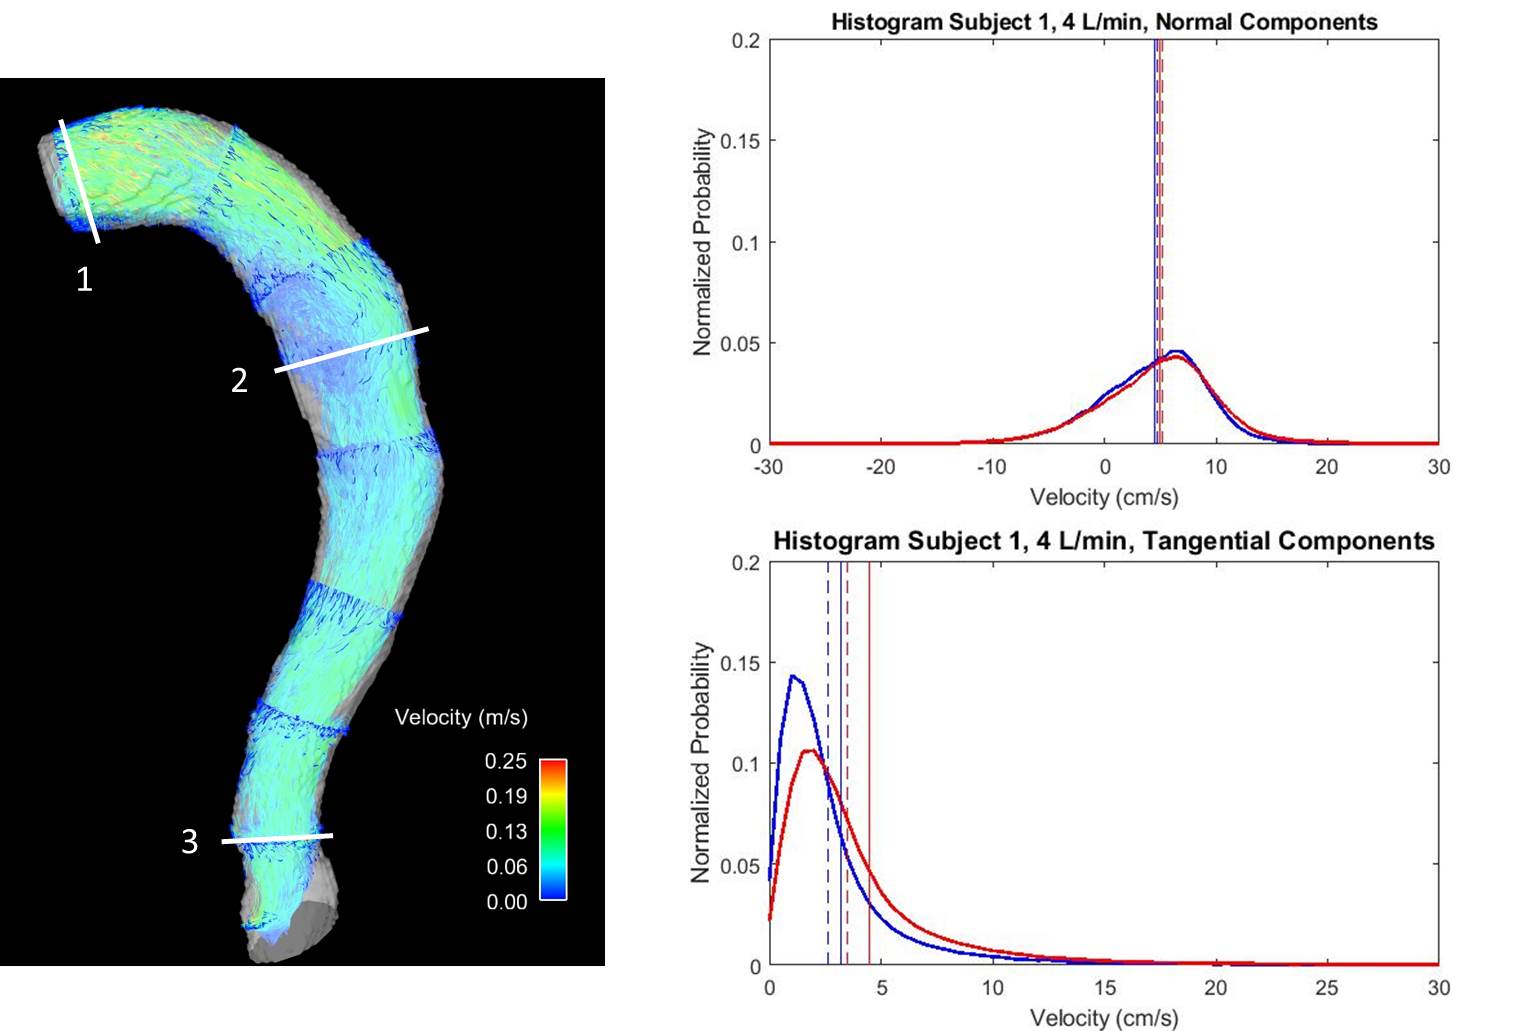
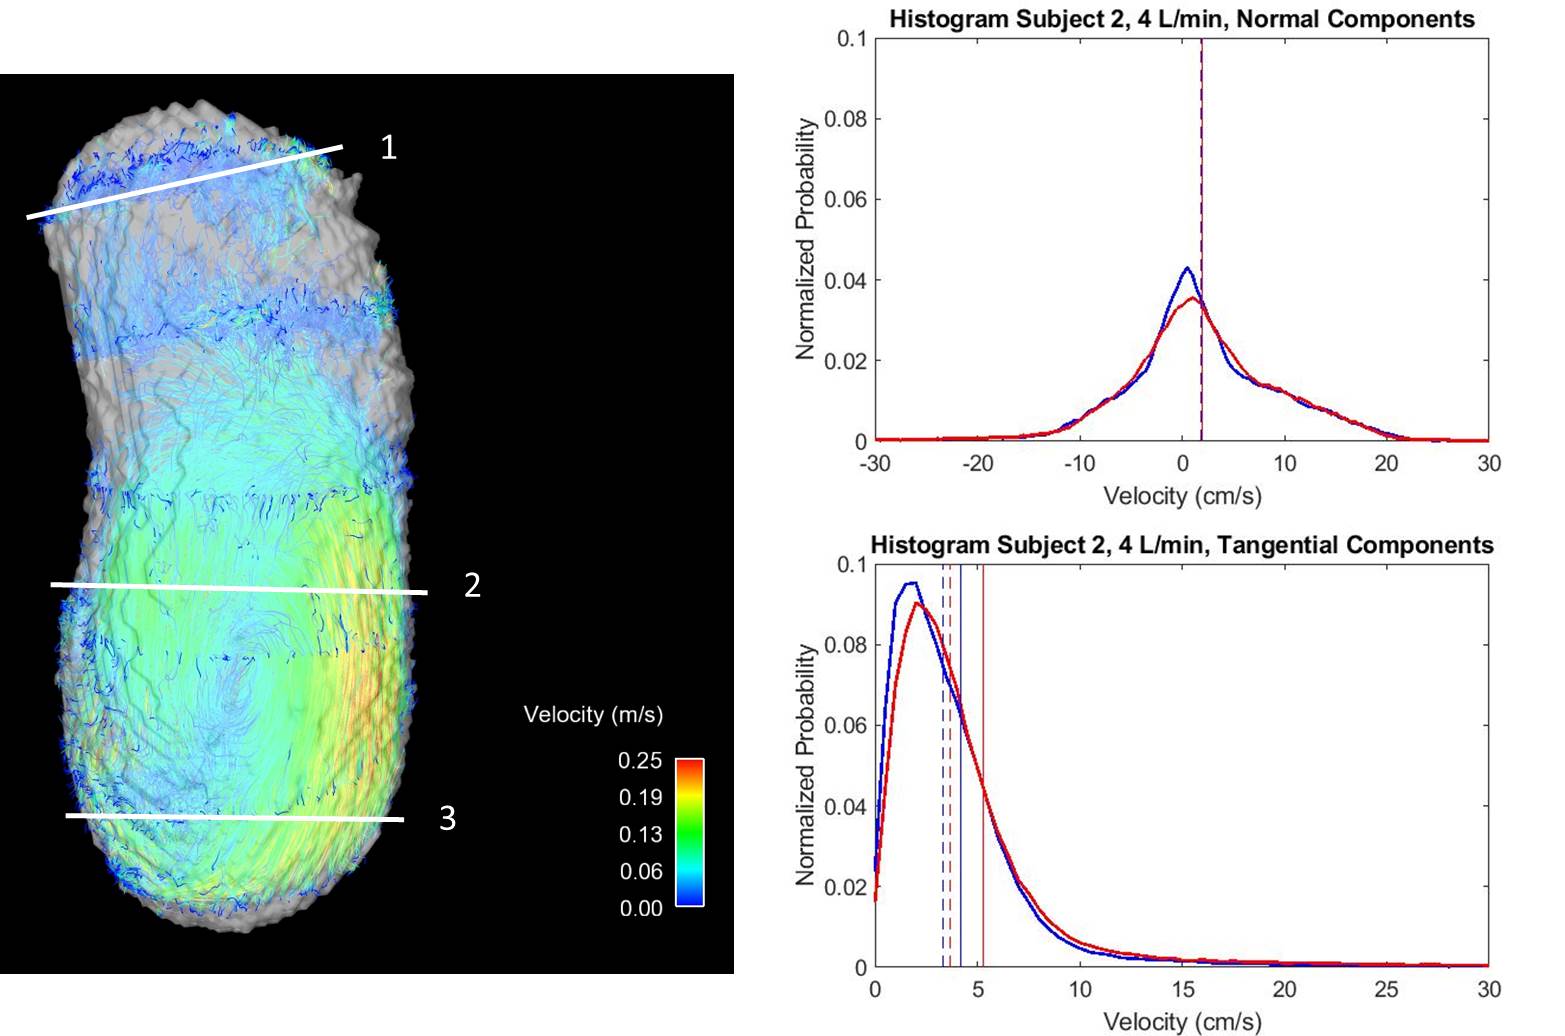
Velocity Distribution: The false lumen of each 3D printed model was segmented from magnitude images (Mimics). The resulting mask defined the velocity analysis domain (EnSight, CEI Inc.; Apex, NC). Several perpendicular planes were placed along the lumen, for which three-directional velocities were exported. Plane data was imported into a custom-developed Matlab tool. Histograms of normal and tangential velocity components for each cardiac phase were computed for each plane. An average histogram of all the planes was calculated for each VENC. Three individual planes were also analyzed.
Results
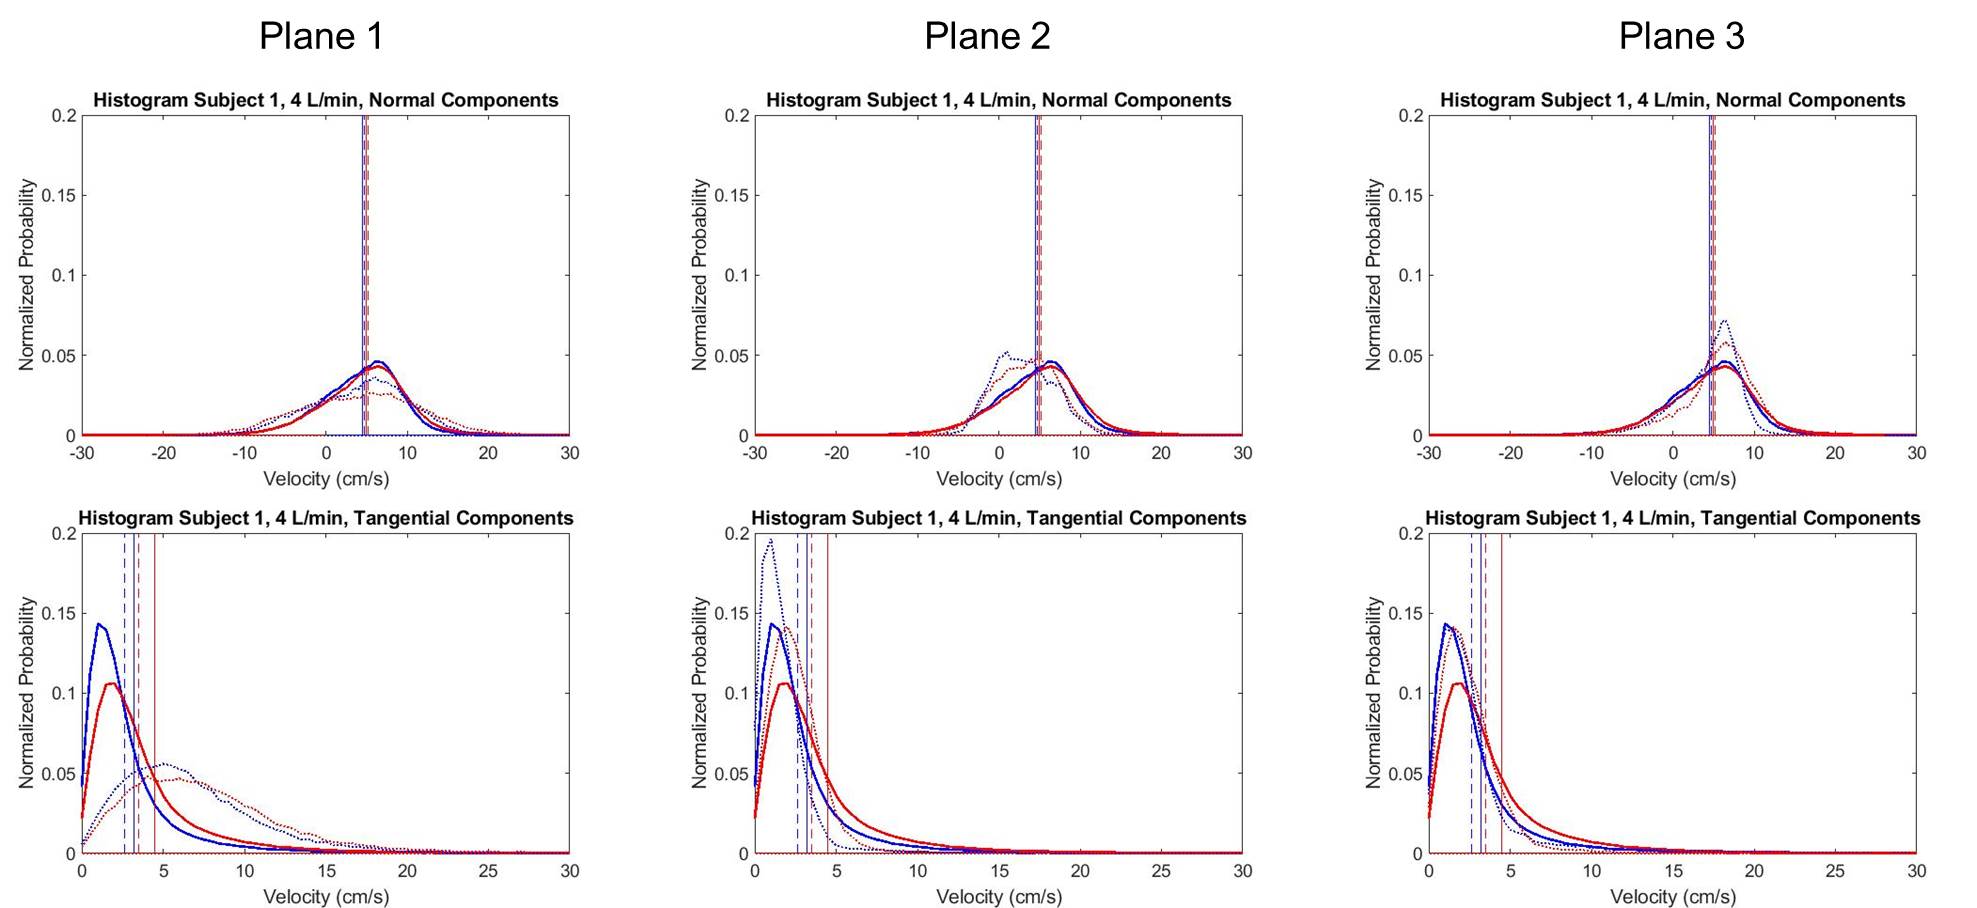
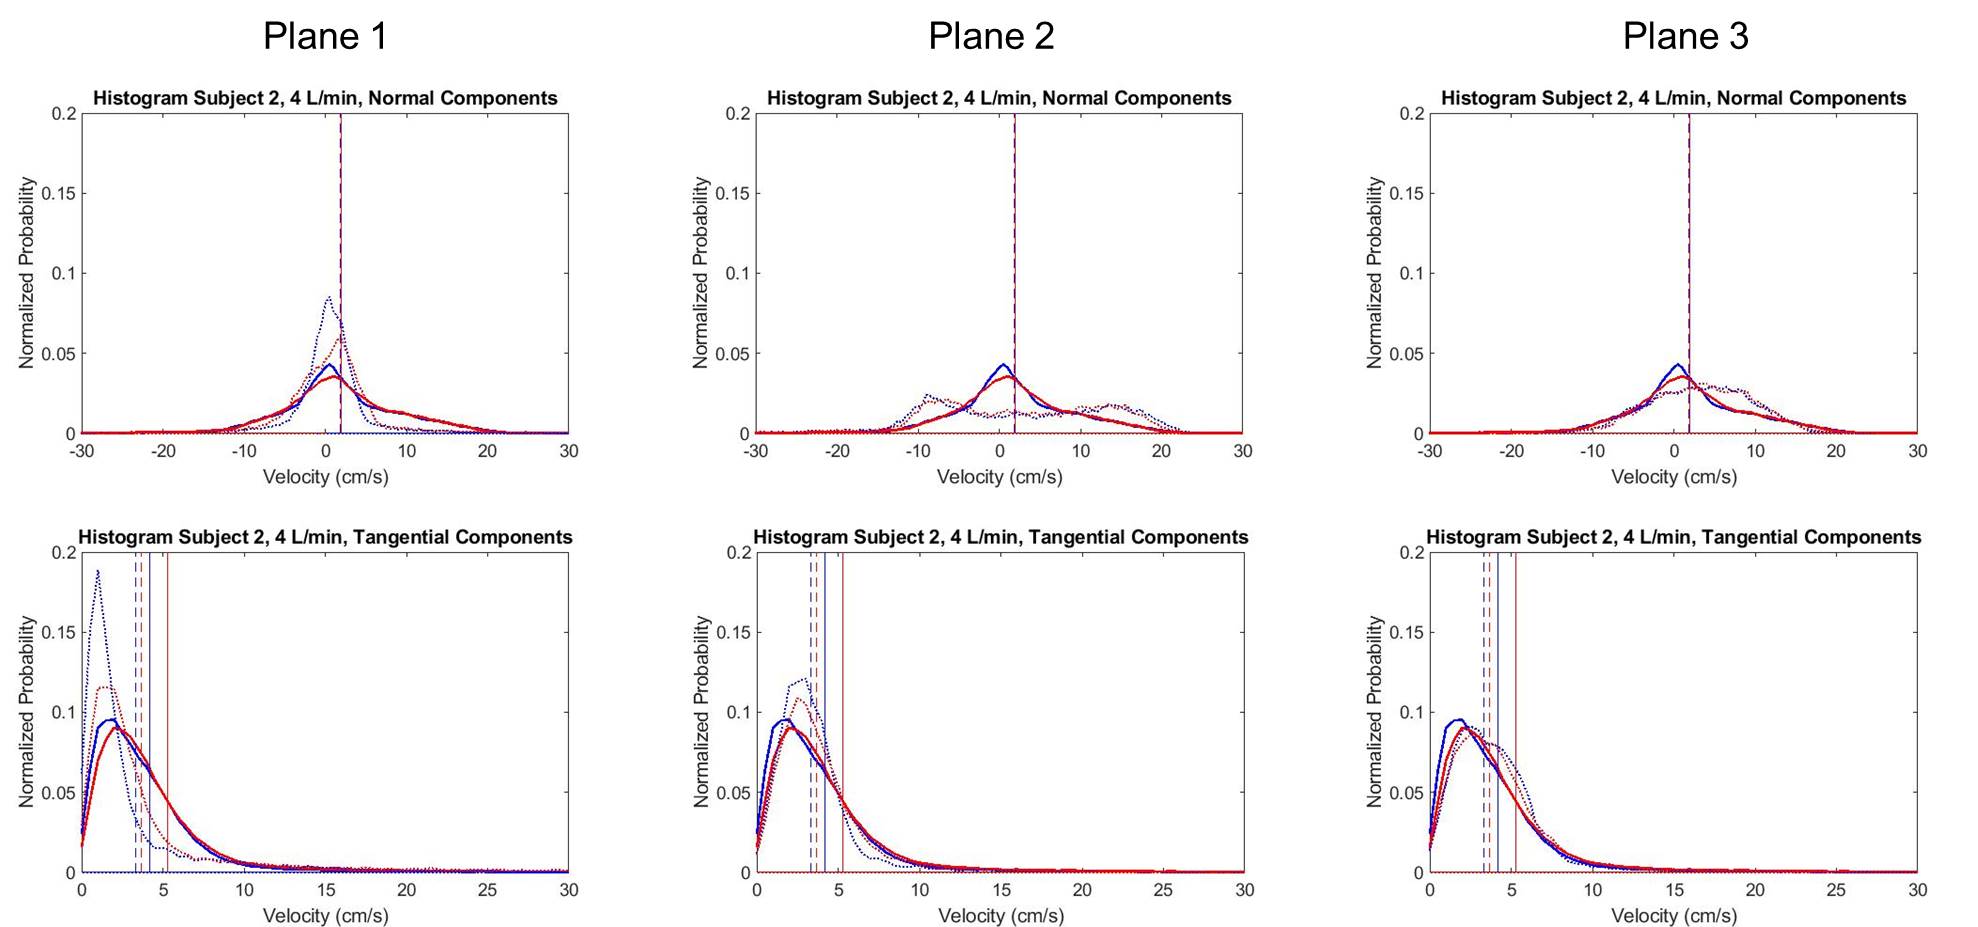
Velocity streamlines in Figures 2-3 demonstrate low velocities and small eddies, as well as average histograms for systole. In general, low VENC scans incorporate lower velocities when compared to high VENC scans, more so on tangential components. The average percent difference of mode, mean and median is 21.2%, 16.7% and 13.8%, respectively, when comparing low to high VENC data. In terms of cardiac phase, the average percent difference of mode, mean and median when comparing systole versus diastole, was 15.4%, 19.6% and 18.6%, respectively. Figures 4-5 show velocity distributions at sample planes.Discussion
Different false lumen velocity aspects can be inferred from resulting histograms (Figures 4-5). Model 1: Positive values (cephalocaudal direction) on the normal component average histograms, might indicate primarily forward flow. Plane analysis shows equally relevant normal and tangential components from angled velocity vectors (Plane 1); predominant low magnitude tangential and normal components, represent recirculation (Plane 2); high magnitudes of normal components show mainly forward flow (Plane 3). Model 2: In average, normal components revolve around zero along with positive and negative velocities, indicating important recirculation. Plane 1, with low velocity, shows low magnitude of both normal and tangential components; the double peaks in opposite directions in the normal component histogram, along with low tangential velocities, shows markedly recirculating flow (Plane 2); Plane 3 shows high normal and tangential velocities, as still part of the recirculating pattern. The small effect of cardiac phase is suspected to be due to the absence of an aortic valve.Conclusions
AD false lumen velocity magnitude and directionality information can be extracted from 4D Flow MRI data. Assessment of normal and tangential component histograms along the lumen might be a valuable tool for false lumen hemodynamics characterization, bringing insight into thrombus formation and disease progression. Venc selection is important in false lumen flow assessment, especially of tangential components, and might have implications on further hemodynamic studies.Acknowledgements
David Rutkowski (UW Mechanical Engineering); UW Radiology R&D 2015; GE Healthcare.References
1. Khan IA, Nair, CK. Clinical, diagnostic, and management perspectives of aortic dissection. Chest 2002;122:311-328.
2. Tsai TT, Evangelista A, Nienaber CA, et al. Partial thrombosis of the false lumen in patients with acute Type B aortic dissection. N Engl J Med 2007;357:349-59.
3. François CJ, Markl, M, Schiebler, ML, et al. Four-dimensional, flow-sensitive magnetic resonance imaging of blood flow patterns in thoracic aortic dissections. J Thorac Cardiov Sur 2013;145:1359-66.
4. Clough RE, Waltham M, Giese D, et al. A new imaging method for assessment of aortic dissection using four-dimensional phase contrast magnetic resonance imaging. J Vasc Surg 2012; 55:914-923.
5. Gu T, Korosec, FR, Block, WF, et al. PC VIPR: a high-speed 3D phase-contrast method for flow quantification and high-resolution angiography. AJNR Am J Neuroradiol 2005;26:743-749.
Figures