1871
Tumor sphericity as a predictor of response in patients undergoing neoadjuvant chemotherapy treatment for invasive breast cancer1Radiology and Biomedical Imaging, University of California, San Francisco, San Francisco, CA, United States, 2Seoul National University, Bundang Hospital, Seoul, Korea, Republic of, 3Surgery and Radiology, University of California, San Francisco, San Francisco, CA, United States, 4Quantum Leap, San Francisco, CA, United States
Synopsis
In the realm of personalized and precision medicine, quantitative metrics are needed for predicting treatment outcomes during neoadjuvant chemotherapy for breast cancer. We evaluated an automated tumor sphericity measurement as an addition to standard functional tumor volume for prediction of treatment response in a cohort of 220 patients with invasive breast cancer. Tumor sphericity captured some similar information to a visually assessed morphologic pattern score. Pre-treatment sphericity showed comparable prediction of pathologic complete response to pre-treatment volume, and added benefit in a logistic regression model. Sphericity may be useful in combination with tumor size to improve prediction of outcome.
Introduction
Metrics for monitoring response to neoadjuvant chemotherapy (NAC) and for accurate prediction of eventual outcome are needed for moving breast cancer therapies into the realm of precision medicine. Dynamic contrast enhanced (DCE) MRI derived size measures, e.g. longest diameter and functional tumor volume (FTV), have been shown to be predictive in NAC clinical trials (1,2), but do not provide a complete picture. Visually assessed MRI morphologic pattern is promising for providing complementary information to volume (3) but is time-consuming and subject to operator variability. In this retrospective study of patients from the I-SPY 2 TRIAL (Investigation of Serial Studies to Predict Your Therapeutic Response with Imaging and Molecular Analysis 2) we evaluated an automated tumor sphericity metric for capturing phenotype information and for prediction of pathological complete response (pCR).Methods
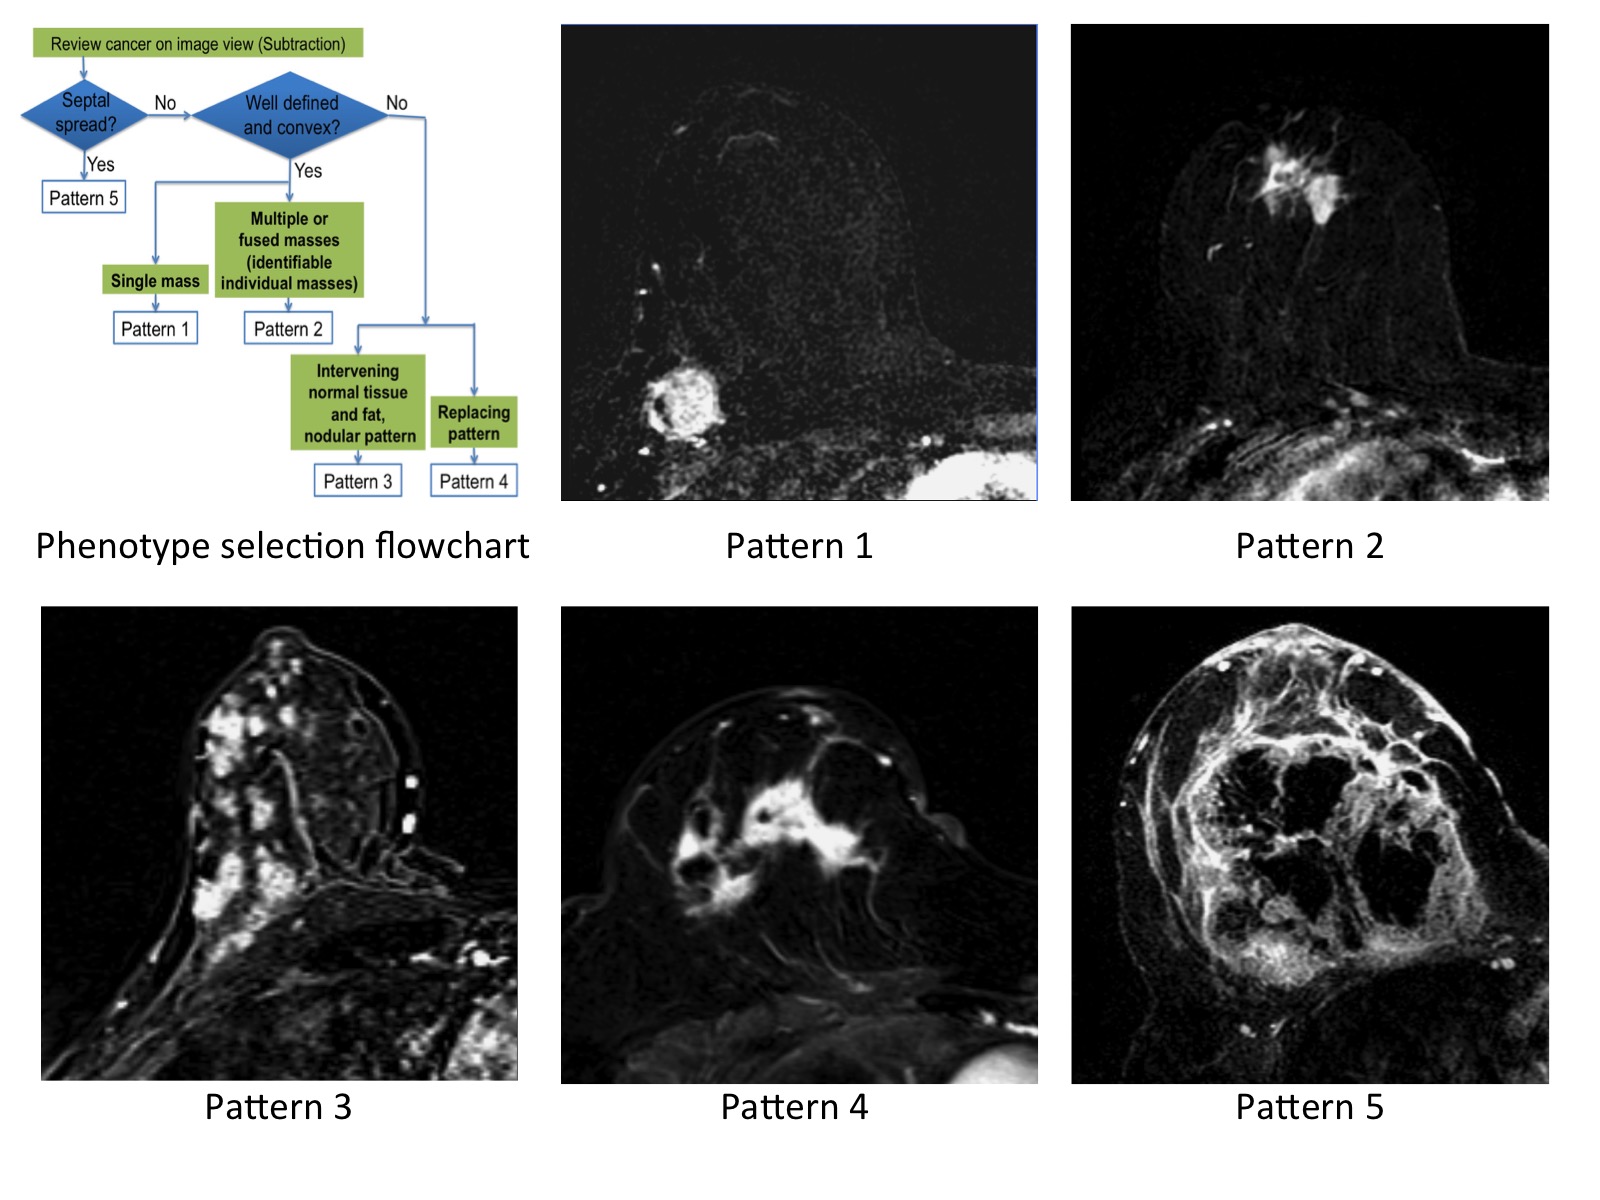
Subjects: 220 women (age 25-70, median=49 years) from completed treatment arms of the IRB approved I-SPY 2 TRIAL. Subjects gave written informed consent prior to enrollment. DCE-MRI studies conducted before neoadjuvant treatment (T0) and after 3 weeks treatment (T1) were evaluated. Axial T1w images were acquired before and after injection of a gadolinium contrast agent. Phase duration was 80s-100s with a minimum of 8 minutes post-injection imaging. MRI morphologic pattern was categorized visually by a radiologist certified to evaluate breast MR images using a 1-5 scale for tumor containment (Figure 1) (3,4).
Quantitative measures were evaluated within an operator-defined rectangular volume of interest (VOI) encompassing the enhancing lesion(s). Early percent enhancement (PE) and signal enhancement ratio (SER) maps were derived using
PE = 100×(S2.5-S0)/S0
SER=(S2.5-S0)/(S7.5-S0)
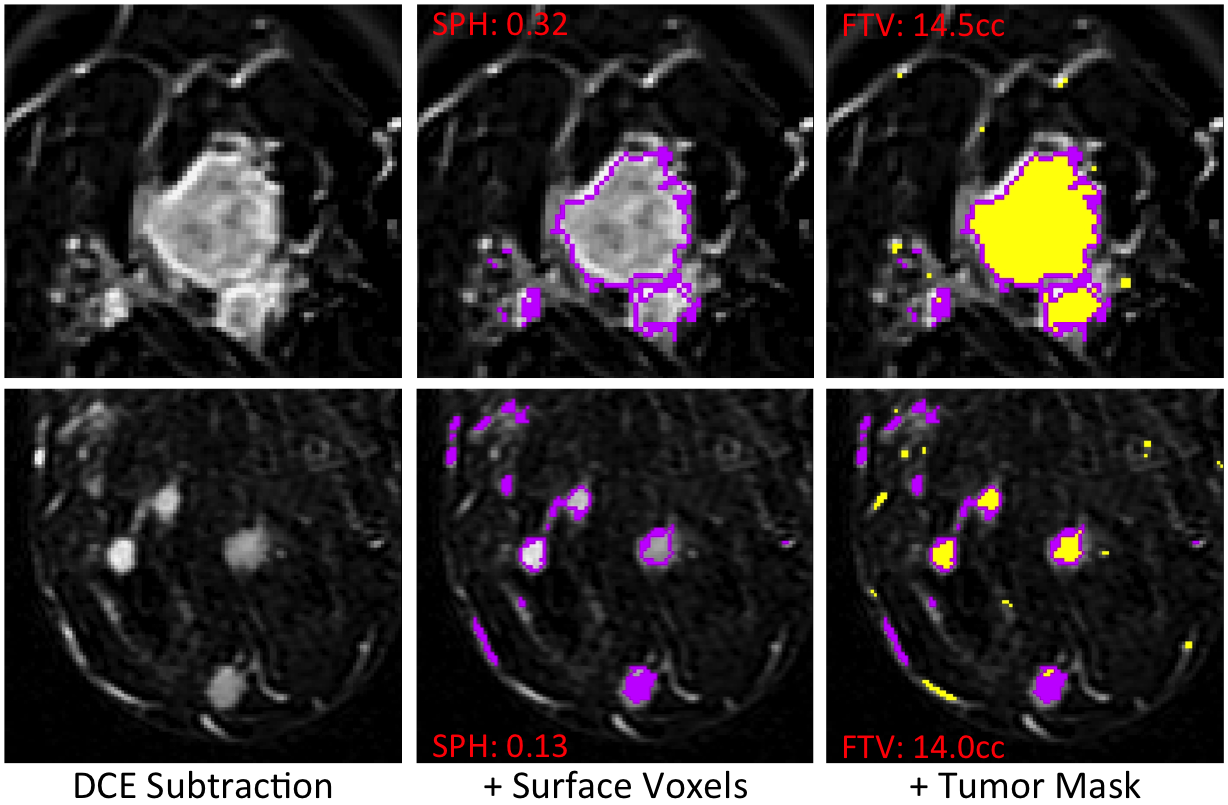
where S0, S2.5 and S7.5 are intensity values from pre-contrast, 2.5 minutes and 7.5 minutes post contrast respectively. FTV was calculated by counting voxels with PE ≥ 70%. Due to skewness of the data, the linearized dimension metric cube root FTV (crFTV) was used for comparisons. 3D connectivity-based cluster analysis was applied to a tumor mask (PE ≥ 70% and SER ≥ 0.9 for plateau and washout enhancement behaviors) and clusters of <6 voxels were eliminated. Surface area (SA) and volume were found for the remaining clusters using a surface meshing analysis. Sphericity (SPH), defined as SA0/SAtumor where SAtumor is the area of the tumor mask and SA0 that of a sphere of the same volume, was calculated to quantify the similarity of the tumor to a sphere (Figure 2). SPH is undefined in cases where the filtered tumor mask contains no voxels. Processing was done using locally written software in IDL (Harris Geospatial, Broomfield, CO).
One-way ANOVA was used to test for differences in means of quantitative measures for different morphologic patterns, p-value less than 0.05 being considered statistically significant. The area under the ROC curve (AUC) was used to evaluate FTV and SPH prediction of pCR (defined as no residual invasive disease in the breast or nodes) determined at surgery after completion of NAC.
Results
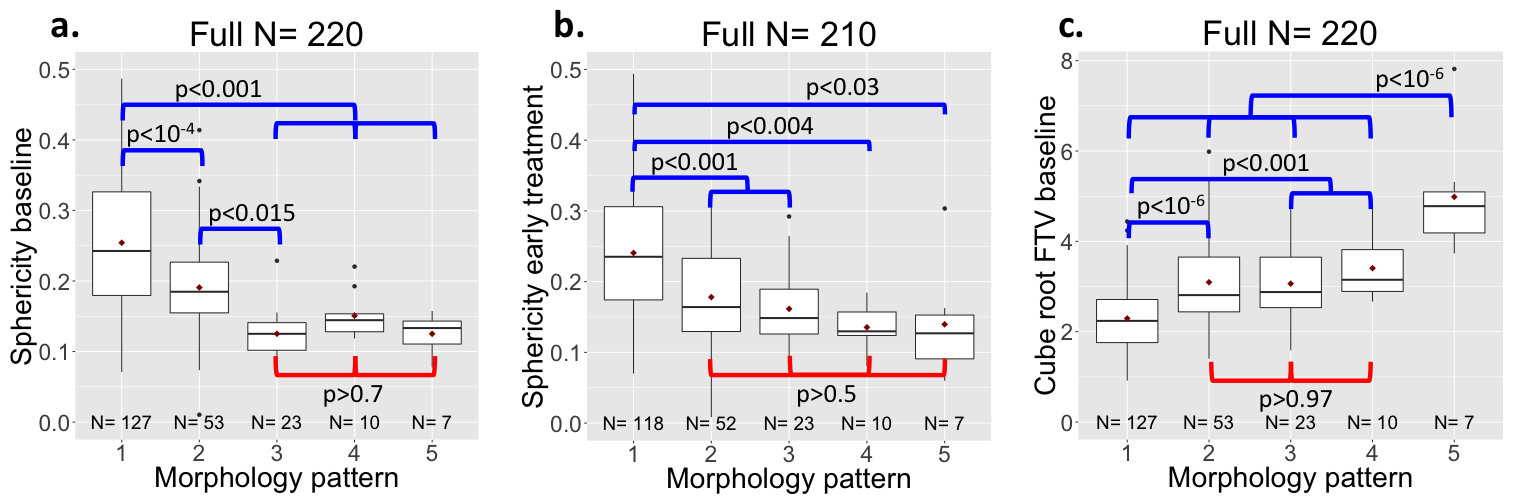
SPH was evaluated in all 220 T0 studies and 210 T1 studies. Exclusions at T1 were for poor quality DCE (N=2), no T1 MRI study (N=5) and SPH undefined (N=3). Figure 3a,b shows the distributions of SPH for the different morphologic patterns. Clear separation was found for the more compact patterns 1,2 and 3, while SPH did not differentiate between the more distributed patterns 3,4 and 5. Similar results were seen for the 2 time points T0 and T1. For comparison, crFTV (Figure 3c) shows no differentiation between patterns 2,3,4 but statistically significant differences were observed for patterns 1 and 5, compared to other patterns.
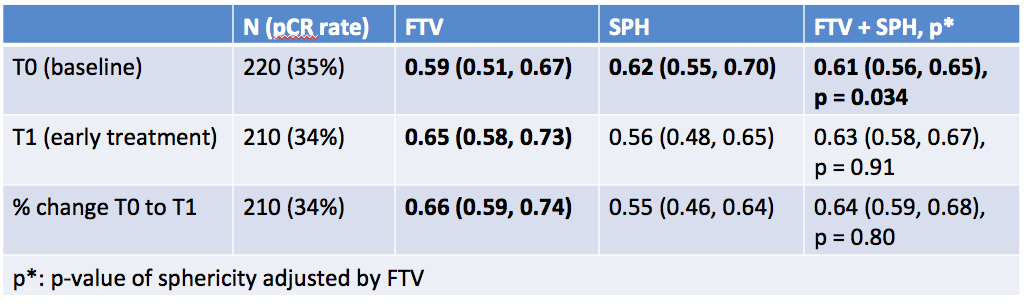
A moderate correlation (R=-.6) was found between SPH and crFTV. This may be due to the underlying dependence on both measures to the volume of the manually defined analysis VOI. Correlation with the cube root of the VOI volume was R= 0.78 for crFTV and R=-0.66 for SPH. AUC estimates for prediction of pCR by crFTV and SPH are given in Figure 4. Estimated AUC for SPHbaseline was 0.62 (95%CI 0.55, 0.70), while SPHearly-treatment and change in SPH were not significant in this cohort. crFTV showed significant AUC for all timepoints.
Conclusions
Sphericity measurements derived from DCE-MR images of breast tumors provide an automated method to capture tumor morphologic pattern. In the setting of response to neoadjuvant chemotherapy, sphericity provides phenotypic information that may be useful in combination with tumor size to improve prediction of outcome. Continuing studies are investigating the relative and combined contributions of tumor volume and sphericity for predicting outcome in receptor-defined breast cancer subtypes.Acknowledgements
This work was supported in part by NIH R01 CA132870 and NIH U01 CA225427References
- Hylton NM, Blume JD, Bernreuter WK, et al. Locally advanced breast cancer: MR imaging for prediction of response to neoadjuvant chemotherapy--results from ACRIN 6657/I-SPY TRIAL. Radiology 2012;263(3):663-672.2.
- Hylton NM, Gatsonis CA, Rosen MA, et al. Neoadjuvant Chemotherapy for Breast Cancer: Functional Tumor Volume by MR Imaging Predicts Recurrence-free Survival-Results from the ACRIN 6657/CALGB 150007 I-SPY 1 TRIAL. Radiology 2016;279(1):44-55.3.
- Esserman L, Kaplan E, Partridge S, et al. MRI phenotype is associated with response to doxorubicin and cyclophosphamide neoadjuvant chemotherapy in stage III breast cancer. Ann Surg Oncol 2001;8(6):549-559.4.
- Mukhtar RA, Yau C, Rosen M, et al. Clinically meaningful tumor reduction rates vary by prechemotherapy MRI phenotype and tumor subtype in the I-SPY 1 TRIAL (CALGB 150007/150012; ACRIN 6657). Ann Surg Oncol 2013;20(12):3823-3830.
Figures