1793
The magnetic resonance elastography of liver for patients with Gaucher disease after enzyme replacement therapy1Beijing Children's Hospital, Capital Medical University, Beijing, China, 2GE Healthcare China, Beijing, China
Synopsis
Gaucher disease (GD) is one of the most prevalent lysosomal storage disorders, which may lead to long term liver complications including fibrosis and cirrhosis. At present, enzyme replacement therapy (ERT) is widely used for GD in clinic.Magnetic resonance elastography (MRE) is the most accurate noninvasive technique for detection and staging of liver fibrosis.No significant difference was detected for GD patients after ERT in this study. It may indicate that enzyme replacement therapy is effective for most patients.
Introduction
Gaucher disease (GD) is one of the most prevalent lysosomal storage disorders, which may lead to long term liver complications including fibrosis and cirrhosis. At present, enzyme replacement therapy (ERT) is widely used for GD in clinic. Magnetic resonance elastography (MRE) is the most accurate noninvasive technique for detection and staging of liver fibrosis. The purpose of this study is using MRE to evaluate the mechanical properties alterations of liver caused by GD, and evaluate the therapeutic effect of ERT for GD.Methods
With the approval of local institutional review board, a total of 37 patients with GD (21 males and 16 females) was included in this study. Ages ranged from 12 years to 35 years old, mean age = 21.38±5.18years. Bone marrow biopsy showed that the activity of glucocerebrosidase in peripheral blood Gaucher's cell, leukocytes or skin fibroblasts was lower than 30% of the normal average [1]. All subjects were imaged on a 3-T MRI system (GE Discovery MR 750). According to the revised GD Diagnostic Evaluation Guidelines[2], the MR examination including cross-sectional T1WI, coronal T2WI with fat suppression, IDEAL-IQ and conventional MRE were conducted for all subjects. IDEAL-IQ data was used to calculate the fat content of liver. MRE data was processed on a vendor offered post-processing workstation. For each patient, the hepatic elastogram is generated from the obtained waveform images. One radiologist measured the liver elastomers. The selection of ROI satisfies the following conditions: (q) placed on liver parenchyma; (2) area≥1000mm2; (3) in visual, the color of ROI in the elastographic region is uniform; (4) the propagation wave in ROI on waveform images has good amplitude and clear direction of propagation without obvious wave interference or attenuation. To investigate whether there is correlation between liver fat deposition and cirrhosis, therefore the correlation between liver elasticity and liver fat content was analyzed by Spearman's Rho. Two independent sample t-test was used to compare the difference between liver elasticity and normal value in Gaucher disease[3].Results
Visually, all subjects were given good amplitude and waveform images. For illustration, results of two typical subjects were shown in Figure 1 and Figure 2. Figure 1 includes amplitude charts, elastic charts and wave charts of a 18 year old patient with GD. The elastic value of this patient is (2.14±0.31) kPa. Wave pattern showing visible waves propagating continuously in the normal liver. Figure 2 includes results of a 31 year old GD patient. The elastic value of the patient is (4.32±0.20) kPa. Wave pattern showing the number of waves in the liver is relatively small. In sum, the average elastic value of liver in 37 patients was (2.58±0.83) Kpa. Based on a previous publication, the normal adult liver elasticity value was (2.35±0.26) Kpa[3]. There was no significant difference between the two groups (P>0.05). In 8 cases (21.6%) with GD, the liver elasticity value was higher than the normal range, and 4 cases (10.8%) was lower. There was no significant correlation between the liver fat content and stiffness for GD patients.Discussion and conclusion
The most intuitive change of type I of Gaucher's disease is the enlargement of liver. MRE is a non-invasive and repeatable technique, which can be used to to assess the presence of liver fibrosis for GD patients. Results showed that the elastic values of liver in 8 patients were higher than those in normal range [3]. However, no significant difference was detected for GD patients after ERT in this study. It may indicate that enzyme replacement therapy is effective for most patients. Although, enzyme replacement therapy is currently the most important treatment, it is only suitable for patients with type I. How ERT works for other types of GD needs further study. In conclusion, MRE can be used to assess liver stiffness for patients with GD and it shows potential in the evaluation of therapeutic effect of ERT for GD patients.Acknowledgements
No acknowledgement found.References
[1] Koppe T, Doneda D, Siebert M.The prognostic value of the serum ferritin in a southern Brazilian cohort of patients with Gaucher disease[J].Genet Mot Biol,2016, 39(3):30—34.
[2] Charrow J,Esplin JA.Gribble TJ,et a1. Gaucher disease: recommendations on diagnosis,evaluation.and monitoring ArchIntern Med.1998.158:1754-1760.
[3] Rustogi R,Horowitz J,Harmath C,et a1.Accuracy of MR elastography and anatomic MR imaging features in the diagnosis of severe hepatic fibrosis and cirrhosis.J Magn Reson Imaging,2012, 35:1356·1364.
Figures
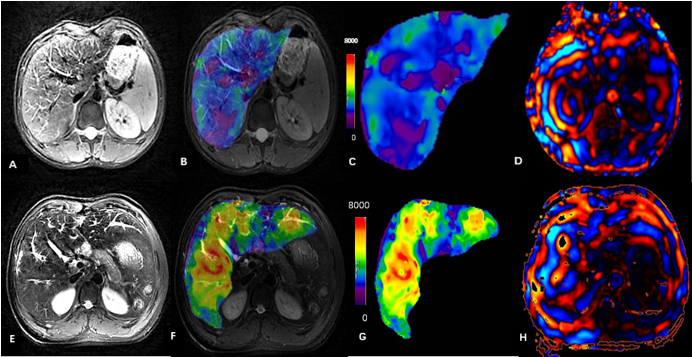
Figure 1 Results of a 18-year-old patients with Gaucher's disease. A is an amplitude map produced by a gradient echo MR elastography (MRE) sequence similar to the T1WI anatomy. The amplitude map is used for the anatomical localization of ROI selection. B and C elastograms, and the liver region is blue-purple. The waveform is obtained by inversion algorithm. The elastic value of the patient is (2.14±0.31) kPa. D is a color wave pattern showing visible waves propagating continuously in the normal liver.
Figure 2 Results of a 31-year-old patients with Gaucher's disease, A is an amplitude map, no obvious abnormalities were found in the liver. B and C are elastograms, and the liver region is yellow-orange. The elastic value of the patient is (4.32±0.20) kPa. Fig. D is a color wave pattern showing the number of waves in the liver is relatively small.