1652
Multi-frequency spin echo- magnetic resonance elastography (SE-MRE) to non-invasively assess kidney allograft injury - preliminary findingsEyesha Hashim1, Prateek Kalra2, Arunark Kolipaka2, Darren Yuen3,4,5, and Anish Kirpalani1,6,7
1Medical Imaging, St. Michael's Hospital, Toronto, ON, Canada, 2The Ohio State University, Columbus, OH, United States, 3Division of Nephrology, Department of Medicine, St. Michael's Hospital, Toronto, ON, Canada, 4|Keenan Research Centre for Biomedical Science, St. Michael's Hospital, Toronto, ON, Canada, 5Division of Nephrology, Department of Medicine, The University of Toronto, Toronto, ON, Canada, 6Medical Imaging, University of Toronto, Toronto, ON, Canada, 7Li Ka Shing Knowledge Institute, St. Michael's Hospital, Toronto, ON, Canada
Synopsis
Chronic allograft injury (CAI) is typically indicated too late with blood work and its cause is determined invasively (e.g. via biopsy). It is thus important to develop non-invasively tools to identify CAI early. We used multi-frequency spin-echo magnetic resonance elastography (SE-MRE) to assess shear modulus as an estimate of CAI in a group of kidney allograft patients with stable but sub-normal graft function. We observed a negative trend approaching significance, between the graft function as determined by estimated glomerular filtration rate and the shear modulus at 90Hz suggesting that SE-MRE can potentially be used for non-invasive assessment of renal injury.
Introduction
Chronic allograft injury (CAI), a collection of reversible (e.g. inflammation) and irreversible (e.g. fibrosis) disorders, limits the lifespan of a kidney allograft1, 2. However, CAI is typically recognized too late with blood work (e.g. estimated Glomerular Filtration Rate, eGFR) and via biopsy. Standard blood work also cannot distinguish between the causes of CAI. The development of non-invasive CAI assessment is thus of significant clinical importance. Fibrosis is a common form of CAI that results in stiffening of the diseased organ3. One way to assess this stiffening is by estimating the mechanical properties (e.g. shear modulus) of the organ with magnetic resonance elastography (MRE), by imaging the tissue under continuous harmonic vibrations4. MRE is clinically used to assess liver fibrosis5. The use of MRE to assess kidney fibrosis is technically challenging because of the small size and heterogeneous anatomy of kidneys which require measuring a shear wave field in three dimensions. We propose to use multi-frequency spin echo (SE) MRE to assess kidney allograft fibrosis in a subgroup of patients showing early signs of CAI. We present our initial findings here.Methods
Following informed consent, we performed MRE on the allografts of 11 patients who had 15 ≤ eGFR ≤ 30 mL/min/1.73 square-m. Three coronal SE-MRE acquisitions, one for each of the three mutually perpendicular directions of motion, were obtained in each subject using a prototype sequence (Siemens Healthineers, Erlangen, DE) on a Siemens Skyra 3.0T system, under breath hold and with a passive driver placed over the allograft. The acquisition parameters were as follows: in-plane resolution= 1.5mm; slice thickness= 5mm; gap between consecutive slices=1mm; FOV= 344mmx380mm; slices per allograft=10; motion frequencies= 60Hz, 90Hz and 110Hz; time-points sampled per cycle of motion=4; TR=2000ms; TE=50ms; acquisition time per acquisition= 22 s. For each allograft, 5 or 6 consecutive slices per frequency were post-processed. After phase-unwrapping and curl calculations, a pixel-by-pixel estimation of the magnitude of the shear modulus was achieved using a local frequency estimation algorithm. A region of interest encompassing the entire kidney parenchyma was drawn manually on each slice and a mean over all the slices was calculated to determine the shear modulus for each kidney. Age, sex, transplant vintage and eGFR data were collected for each subject within one month prior to the MRE.Results
The shear modulus maps in one representative subject are shown in Figure 1. The mean values of shear modulus at driver frequencies of 60Hz, 90Hz, and 110 Hz were 2.0±0.5, 4.3±0.8, 5.1±0.9 kPa, respectively, in our cohort (4 females, mean age=66±7 year, transplant vintage=0.8 to 17 years). The shear modulus for all subjects increased linearly with driver frequency, with the maximum spread of values found for driver frequency of 110Hz (Figures 2 and 3). We found a moderate negative correlation approaching significance between shear modulus at 90Hz and eGFR (p-value=0.07,rho=0.3, Figure 4). In linear regression, shear modulus at 90Hz predicted eGFR with p-value=0.09 approaching significance. Shear moduli at 60Hz and 110Hz did not show any significant relationship with eGFR.Discussion
In our cohort with stable but sub-normal graft function, we found the shear modulus at 90Hz increased with decreasing eGFR. The relationship to allograft function is consistent with our preliminary published data using gradient echo MRE technique6 but opposite to that suggested in other published data7. While perfusion and inflammation also would be expected to contribute to stiffness, one potential explanation of the negative correlation with eGFR is that we did not include patients with eGFR <15 mL/min/1.73square-m and/or those on dialysis, in whom reduced perfusion may play the dominant role in organ stiffness. Despite the small sample size, we noticed a consistent trend in shear modulus across the three driver frequencies. Moreover, our data suggest that in human kidney allografts, waves at a relatively higher frequency such as 90Hz are more suitable for shear modulus measurement. The apparent lack of a significant negative trend between eGFR and shear modulus at 110Hz likely indicates that at this frequency, a comparatively higher amplitude of motion would be more suitable to generate phase data with sufficient signal-to-noise ratio.Conclusion
Our preliminary data suggest that SE-MRE of human kidney allografts at higher frequencies such as 90Hz is a potentially useful technique to assess CAI. However, the presence of potential confounders (inflammation and perfusion) which may also stiffen the graft would require the addition of other measurements (perfusion and other mechanical parameters) to distinguish fibrosis from other causes of kidney stiffening.Acknowledgements
The authors are grateful to Bradley Bolster Jr., and Stephan Kannengiesser at Siemens Healthcare Inc. for technical support with the prototype sequence. The authors are thankful to MRI research technicians, Cindy Hamid and Anthony Sheen for their help with data acquisition and Diego He for his support with post-processing. The authors also wish to express their thanks to their colleagues at the St. Michael's Hospital: Michelle Nash, Lindita Rapi for their help with REB protocols and study set up, Drs. Jeff Zaltzman, Ramesh Prasad for their collaboration in patient recruitment and the Nephrology clinic nurses and staff for help with recruitment.References
1. G. Einecke, B. Sis, J. Reeve, M. Mengel, P. M. Campbell, L. G. Hidalgo, B. Kaplan and P. F. Halloran, American journal of transplantation : official journal of the American Society of Transplantation and the American Society of Transplant Surgeons 9 (11), 2520-2531 (2009). 2. M. Zeisberg and E. G. Neilson, Journal of the American Society of Nephrology : JASN 21 (11), 1819-1834 (2010). 3. J. H. Kristensen, M. A. Karsdal, F. Genovese, S. Johnson, B. Svensson, S. Jacobsen, P. Hagglund and D. J. Leeming, Respiration 88 (6), 487-499 (2014). 4. K. J. Glaser, A. Manduca and R. L. Ehman, J Magn Reson Imaging 36 (4), 757-774 (2012). 5. M. Yin, J. A. Talwalkar, K. J. Glaser, A. Manduca, R. C. Grimm, P. J. Rossman, J. L. Fidler and R. L. Ehman, Clin Gastroenterol Hepatol 5 (10), 1207-1213 e1202 (2007). 6. A. Kirpalani, E. Hashim, G. Leung, J. K. Kim, A. Krizova, S. Jothy, M. Deeb, N. N. Jiang, L. Glick, G. Mnatzakanian and D. A. Yuen, Clin J Am Soc Nephrol (2017). 7. S. R. Marticorena Garcia, T. Fischer, M. Dürr, E. Gültekin, J. Braun, I. Sack and J. Guo, Investigative Radiology Publish Ahead of Print, 1 (2016).Figures
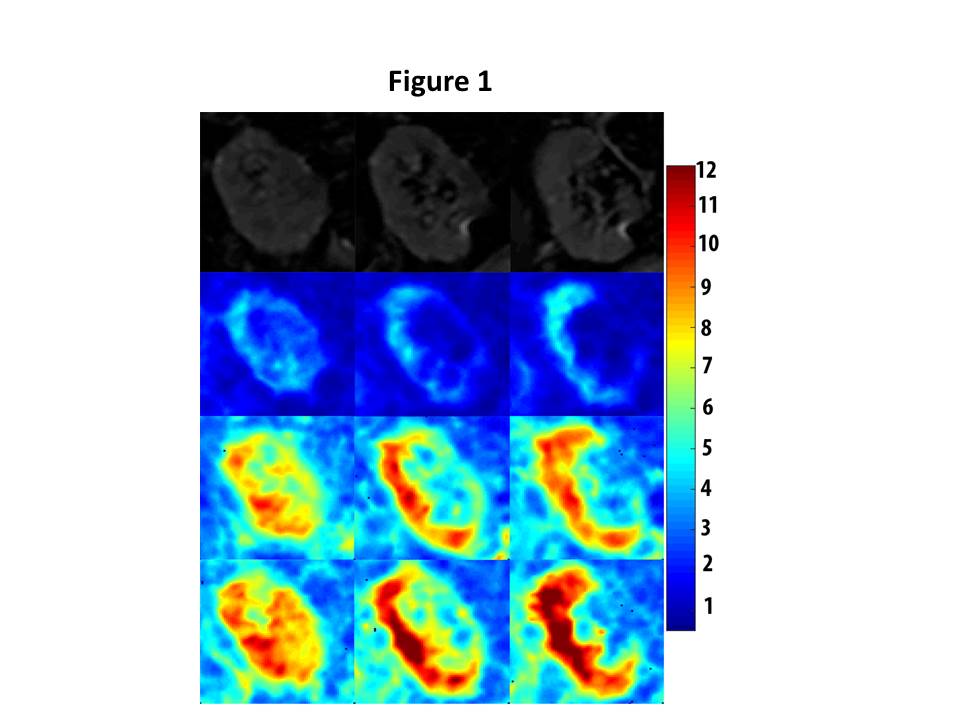
Magnitude (top row) and corresponding shear-modulus magnitude (2nd, 3rd, 4th row) maps in 3 coronal MRE slices in one representative subject. The slices are along anterior to posterior direction, displayed from left to right. The 2nd 3rd and 4th rows display the corresponding shear-modulus magnitude maps at 60 Hz, 90 Hz, and 110 Hz driver frequencies, respectively. Colour bar at far right displays shear-modulus magnitude in kilopascals (kPa) and corresponds to the color maps in the images.
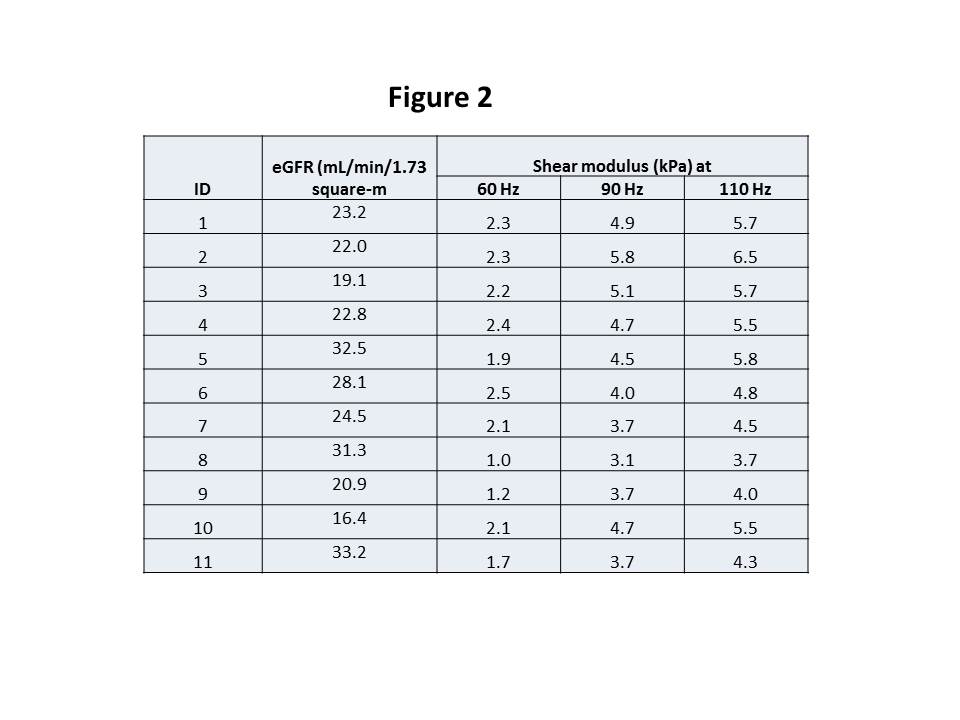
Table showing the shear-modulus
data at driver frequencies of 60, 90 and 110 Hz and the eGFR for the entire
cohort.
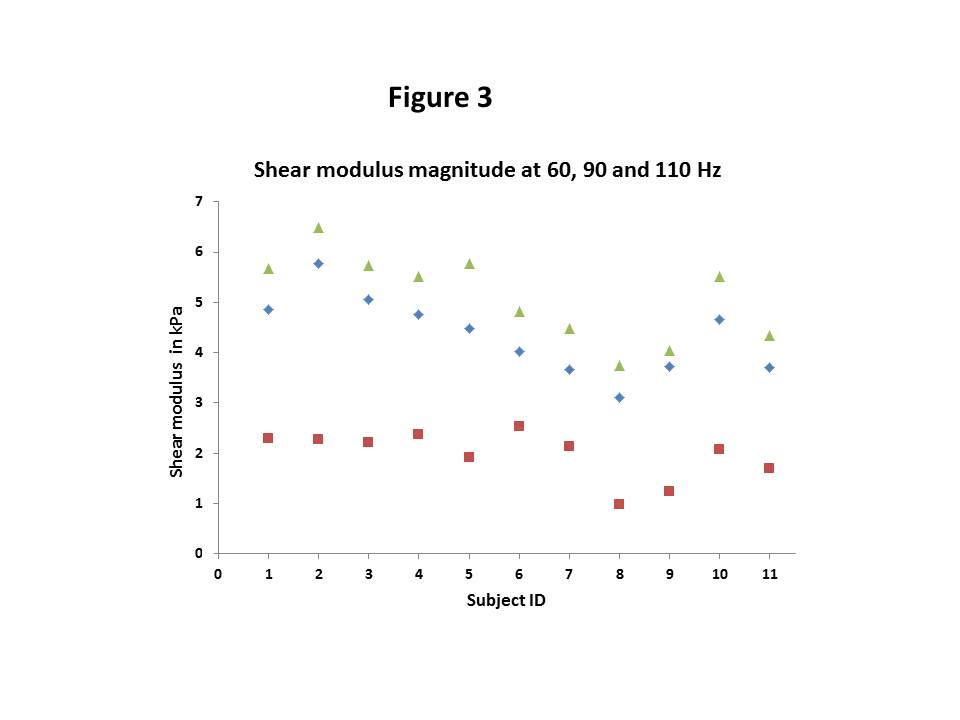
Shear modulus magnitude data at driver frequencies of 60, 90 and 110 Hz across the cohort. The squares represent the data at 60 Hz, the diamonds represent the data at 90 Hz and the triangles show the data at 110 Hz.
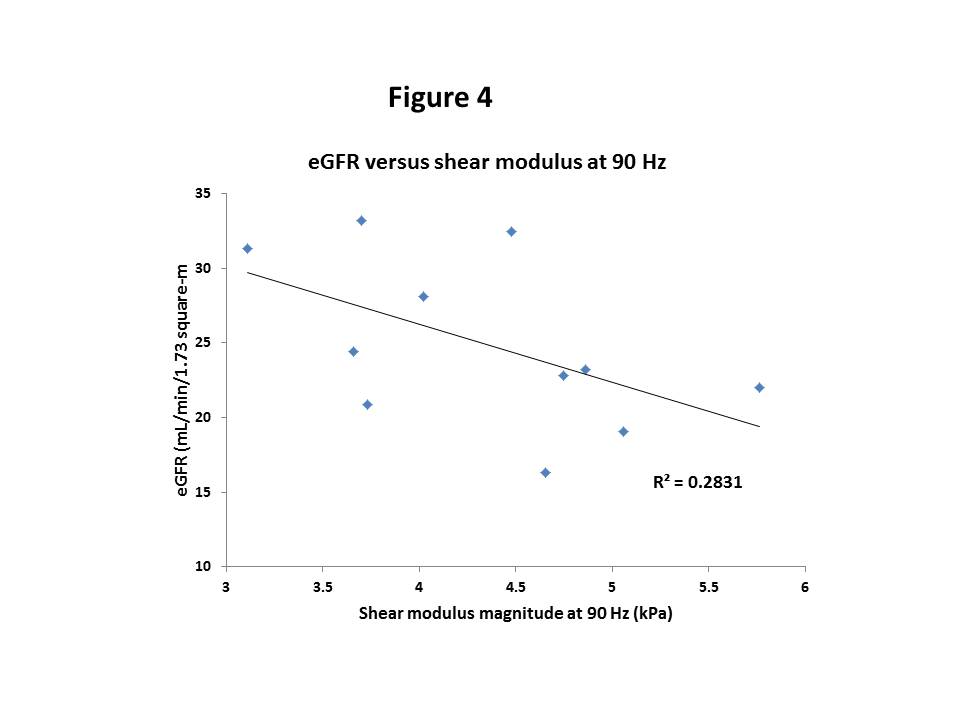
The linear trend of eGFR versus
the shear-modulus magnitude at 90 Hz. The negative correlation between the two
variables is approaching significance (p-value=0.09). The r-squared value
corresponds to the line of best fit shown in the figure. Note that the values
along x-axis start at 3 to allow better visualization of the data.