1648
MRI Quantitative Parameters of Small-Bowel Perfusion for Early Diagnosing and Assessing Activity of Crohn’s Disease: A Preliminary Study1Radiology, First Affiliate Hospital of Fujian Medical University, Fuzhou, Fujian, China
Synopsis
The purpose of this present study is to explore the potential of MR small-bowel perfusion, and to achieve more insights in MRE of CD patients. To this end, the changes of microcirculation of CD are investigated by comparing the quantitative parameters of MR perfusion of inflammatory segments with normal ones and the correlation of the former with CDAI and intestinal wall thickness.
Objective
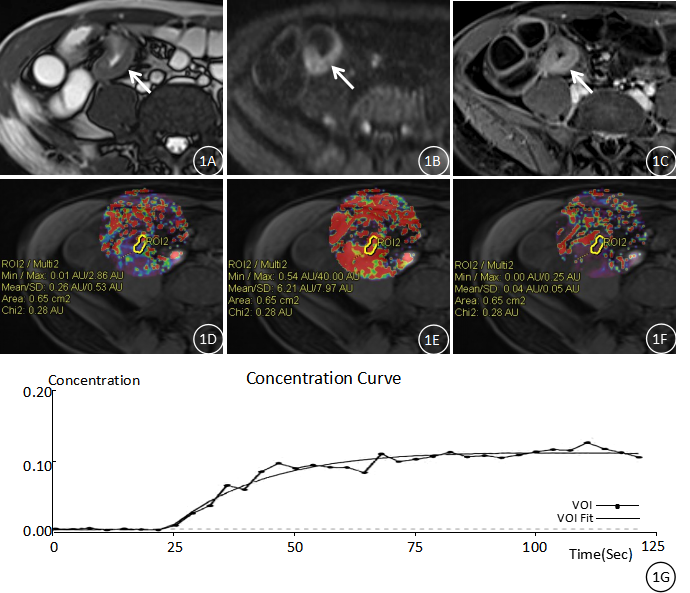
To explore the relationship between MRI quantitative parameters such as the volume transfer constant (Ktrans), the reflux constant (Kep) and the extravascular space volume fraction (Ve) and the change of blood perfusion and permeability of Crohn’s Disease (CD), and evaluate the value of small-bowel perfusion for early diagnosing and assessing activity of CD.Methods
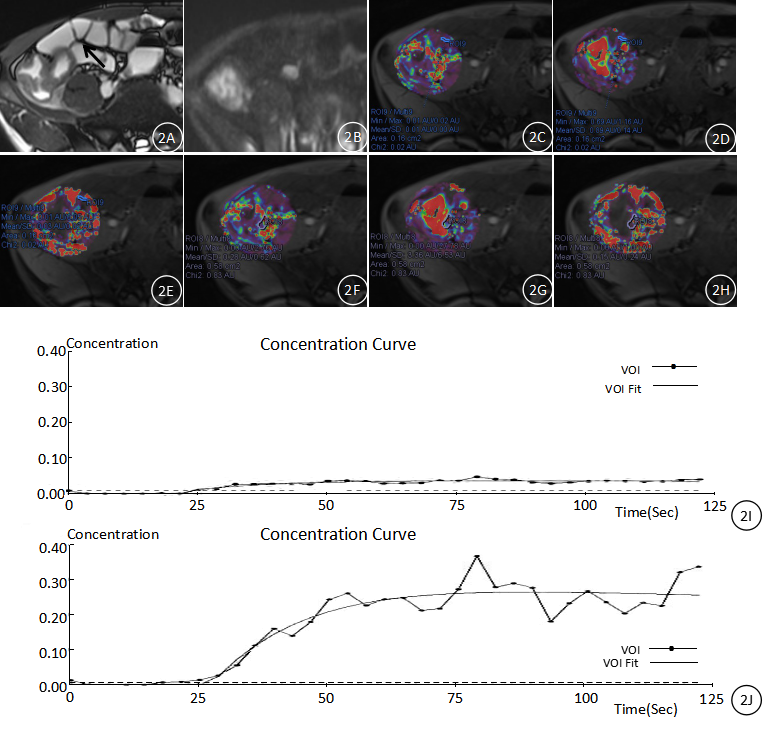
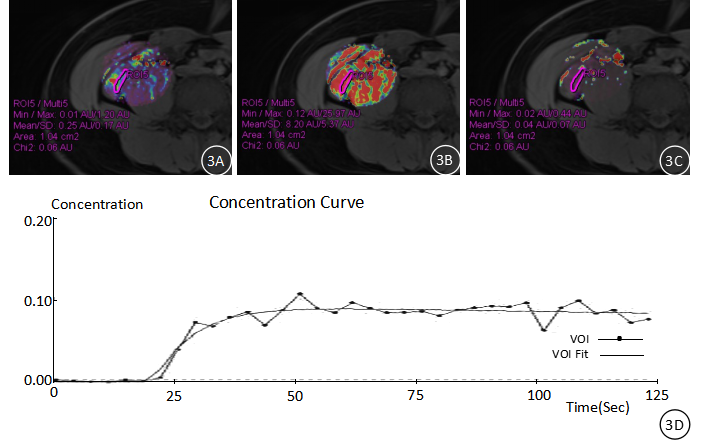
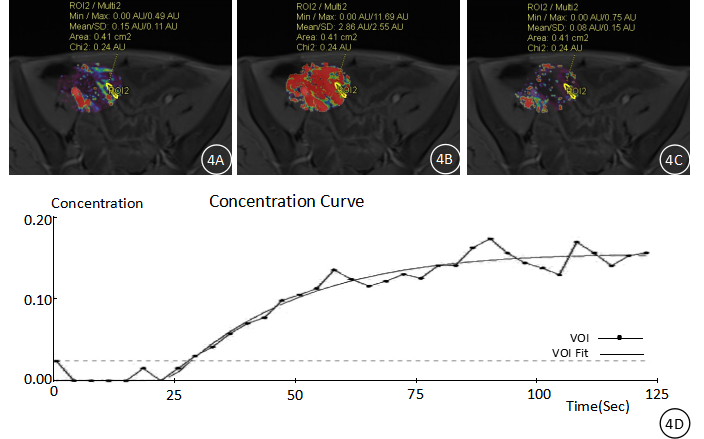
48 patients who underwent bowel examination with magnetic resonance enterography (MRE) were recruited. Ktrans, Kep and Ve of normal and terminal small-bowel were collected and compared. According to Crohn’s disease activity index (CDAI), all patients were divided into three groups such as remissive group, mild group and moderate-severe group. The differences of Ktrans, Kep and Ve among the three groups were compared. The correlations between quantitative parameters and CDAI and small-bowel wall thickness were respectively evaluated.Results
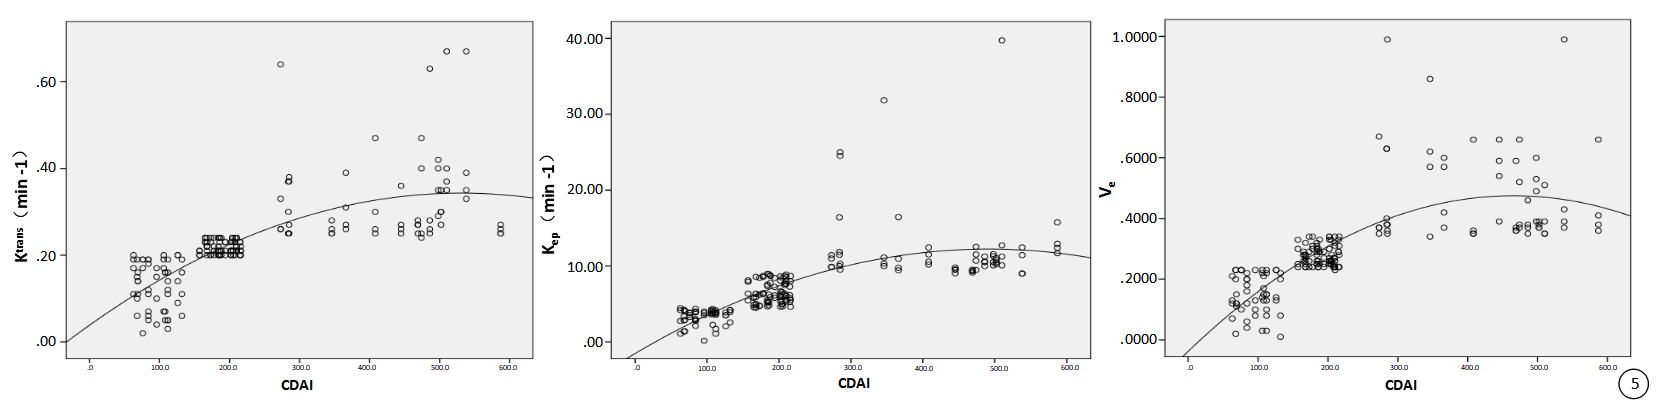
In 48 patients, Ktrans, Kep and Ve of terminal small-bowel were higher significantly than that of normal bowel (P<0.05) with the most remarkable increase in Ve. There were 13 cases of remissive group, 20 cases of mild group and 15 cases of moderate-severe group. Ktrans, Kep and Ve of remissive group were lower than active group (P<0.05). With the progress of CD, Ktrans, Kep and Ve also increased (P=0.000). All quantitative parameters had high positive correlation with CDAI (P<0.05). However, it was not statistically significant in correlation between Ktrans and small-bowel wall thickness(P=0.471).Conclusion
MRI quantitative parameters of small-bowel perfusion can reflect the change of blood perfusion and permeability of CD, and have a certain value for early diagnosing and assessing activity of CD.Acknowledgements
No acknowledgement found.References
[1] SK Min, DH Kim, SJ Park, et al. Efficacy of early immunomodulator therapy on the outcomes of Crohn’s disease. BMC Gastroenterology. 2014. 14 (1) :85.
[2] Wilkins T1, Jarvis K, Patel J. Diagnosis and management of Crohn's disease. Am Fam Physician. 2011 Dec 15;84(12):1365-75.
[3] SaevikF, Nylund K, Hausken T, et al. Bowel Perfusion Measured with Dynamic Contrast-enhanced Ultrasound Predicts Treatment Outcome in Patients with Crohn’s Disease. Inflamm Bowel Dis. 2014 Nov;20(11):2029-37.
[4] Tolan DJ, Greenhalgh R, Zealley IA, et al. MR enterographic manifestations of small bowel Crohn disease, Radiographics. 2010 Mar;30(2):367-84.
[5] Choi HS, Kim AH, Ahn SS, et al. Glioma grading capability: comparisons among parameters from dynamic contrast-enhanced MRI and ADC value on DWI. Korean J Radiol. 2013 May-Jun;14(3):487-92.
[6] Chen YF, Yuan A, Cho KH, et al. Functional evaluation of therapeutic response of HCC827 lung cancer to bevacizumab and erlotinib targeted therapy using dynamic contrast-enhanced and diffusion-weighted MRI. PLoS One. 2017 Nov 9;12(11):e0187824.
[7] Abd-Alazeez M, Ramachandran N, Dikaios N, et al. Multiparametric MRI for detection of radiorecurrent prostate cancer: added value of apparent diffusion coefficient maps and dynamic contrast-enhanced images. Prostate Cancer Prostatic Dis. 2015 Jun;18(2):128-36.
[8] Best WR BJM, Singleton JW. Development of a Crohn’s disease activity index. National Cooperative Crohn’s Disease Study. Gastroenterology. 1976. 70: 439-44.
[9] Fong SC, Irving PM. Distinct management issues with Crohn's disease of the small intestine. Curr Opin Gastroenterol. 2015 Mar;31(2):92-7.
[10] Giusti S, Faggioni L, Neri E, et al. Dynamic MRI of the small bowel: usefulness of quantitative contrast-enhancement parameters and time-signal intensity curves for differentiating between active and inactive Crohn's disease. Abdom Imaging. 2010 Dec;35(6):646-53.
[11] Maccioni F, Patak MA, Signore A, et al. New frontiers of MRI in Crohn's disease: motility imaging, diffusion-weighted imaging, perfusion MRI, MR spectroscopy, molecular imaging, and hybrid imaging (PET/MRI). Abdom Imaging. 2012 Dec;37(6):974-82.
[12] Tofts PS, Brix G, Buckley DL, et al. Estimating kinetic parameters from dynamic contrast-enhanced T(1)-weighted MRI of a diffusable tracer: standardized quantities and symbols. J Magn Reson Imaging. 1999 Sep;10(3):223-32.
[13] Oto A, Kayhan A, Williams JT, et al. Active Crohn's disease in the small bowel: evaluation by diffusion weighted imaging and quantitative dynamic contrast enhanced MR imaging. J Magn Reson Imaging. 2011 Mar;33(3):615-24.
[14] Oto A, Fan X, Mustafi D, et al. Quantitative analysis of dynamic contrast enhanced MRI for assessment of bowel inflammation in Crohn's disease pilot study. Acad Radiol. 2009 Oct;16(10):1223-30.
[15] Röttgen R, Grandke T, Grieser C, et al. Measurement of MRI enhancement kinetics for evaluation of inflammatory activity in Crohn's disease. Clin Imaging. 2010 Jan-Feb;34(1):29-35.
[16] Danese S, Dejana E, Fiocchi C. Immune regulation by microvascular endothelial cells: directing innate and adaptive immunity, coagulation, and inflammation. J Immunol. 2007 May 15;178(10):6017-22.
[17] Danese S, Sans M, Scaldaferri F, et al. TNF-alpha blockade down-regulates the CD40/CD40L pathway in the mucosal microcirculation: a novel anti-inflammatory mechanism of infliximab in Crohn's disease. J Immunol. 2006 Feb 15;176(4):2617-24.
[18] Collins DJ, Padhani AR. Dynamic magnetic resonance imaging of tumor perfusion: Approaches and biomedical challenges. IEEE Eng Med Biol Mag. 2004 Sep-Oct;23(5):65-83.
[19] Pupillo VA, Di Cesare E, Frieri G, et al. Assessment of inflammatory activity in Crohn's disease by means of dynamic contrast-enhanced MRI. Radiol Med. 2007 Sep;112(6):798-809.
[20] Hatoum OA, Heidemann J, Binion DG. The intestinal microvasculature as a therapeutic target in inflammatory bowel disease. Ann N Y Acad Sci. 2006 Aug;1072(1):78-97.
[21] Li Y, Hauenstein K. New Imaging Techniques in the Diagnosis of Inflammatory Bowel Diseases. Viszeralmedizin. 2015 Aug;31(4):227-34.
[22]Taylor SA, Punwani S, Rodriguez-Justo M, et al. Mural Crohn disease: correlation of dynamic contrast-enhanced MR imaging findings with angiogenesis and inflammation at histologic examination--pilot study[J]. Radiology, 2009, 251(2):369.
[23]Tielbeek J A W, Ziech M L W, Li Z, et al. Evaluation of conventional, dynamic contrast enhanced and diffusion weighted MRI for quantitative Crohn’s disease assessment with histopathology of surgical specimens[J]. European Radiology, 2014, 24(3):619.
[24]Lauenstein TC, Ajaj W, Narin B, et al. MR imaging of apparent small-bowel perfusion for diagnosing mesenteric ischemia: feasibility study.[J]. Radiology, 2005, 234(2):569-575.
[25]Froehlich J M, Waldherr C, Stoupis C, et al. MR motility imaging in Crohn’s disease improves lesion detection compared with standard MR imaging[J]. European Radiology, 2010, 20(8):1945-1951.
Figures