1556
Sensitivity and Uniformity Improvement of Phased Array MR Images Using Inductive Coupling and RF Detuning Circuits1Division of Cellular and Gene Therapies (DCGT), FDA, Silver Spring, MD, United States, 2Division of Biomedical Physics (DBP), FDA, Silver Spring, MD, United States
Synopsis
This study demonstrates improvement in MR image sensitivity and uniformity from a 4-channel phased array using a secondary resonator having switchable detuning circuits. The secondary resonator was located at the opposite side of the 4-channel phased array to improve sensitivity and uniformity of the acquired MR images. The numerical simulation results of |B1+| in a transmit mode showed the magnetic field uniformity would be decreased with the designed secondary resonator having no detuning circuits because of unwanted interferences between the transmit birdcage coil and the secondary resonator. Whereas, the sensitivity and uniformity of |B1-| in a receive mode were improved with the secondary resonator and a 4-channel phased array. For experimental verification, a uniform saline phantom and mice were analyzed by MR using a 7.0T small animal MRI system.
INTRODUCTION: The placement of a “secondary resonator” that results in inductive coupling can improve the image quality of MRI [1-2] and signal-to-noise-ratio (SNR) of nuclear magnetic resonance (NMR) spectroscopy [3-4] without changing the RF coil. However, all the previously reported secondary resonators research were designed with a common assumption that the RF coils were operated in transmit and receive (T/R) mode with no need for coil detuning. Therefore, the secondary resonators previously reported cannot be used for receive only RF coils including phased arrays. This study demonstrates improvement in MR image sensitivity and uniformity of a 4-channel phased array coil, using the designed secondary resonator having switchable detuning circuits. The designed secondary resonator combined with the 4-channel phased array was used for the 3D volume mapping of mouse body, fat, and liver to evaluate the effect of knocking-out PP2A-B56g in mice.
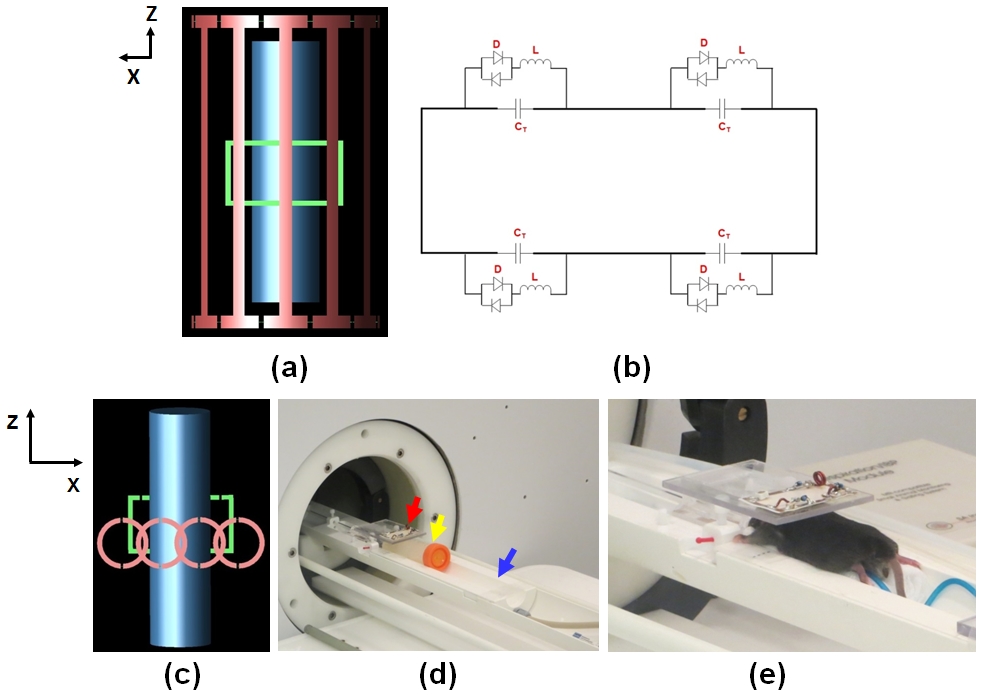
METHODS: The computational model included a 12-rod high-pass (HP) birdcage coil as a transmit volume coil with parameters of inner diameter (ID) = 72 mm, inner length = 110 mm, and outer length = 120 mm, a designed rectangular shape secondary resonator (length = 45 mm, width = 25 mm), a cylindrical saline phantom (ID = 26 mm, length = 100 mm) (Fig. 1 (a)), and a 4-channel phased array (Fig. 1 (c)). Numerical simulations were performed with and without the secondary resonator assuming different detuning conditions at 300 MHz using commercially available software (xFDTD; Remcom, Inc; State College, PA). All corresponding experimental measurements were performed on an Agilent 7T (300 MHz) horizontal bore small animal MRI (Agilent Inc.; Santa Clara, California). The geometry of the transmit birdcage RF coil (RAPID MR International Inc.; Columbus, Ohio) was the same as in the numerical simulations.
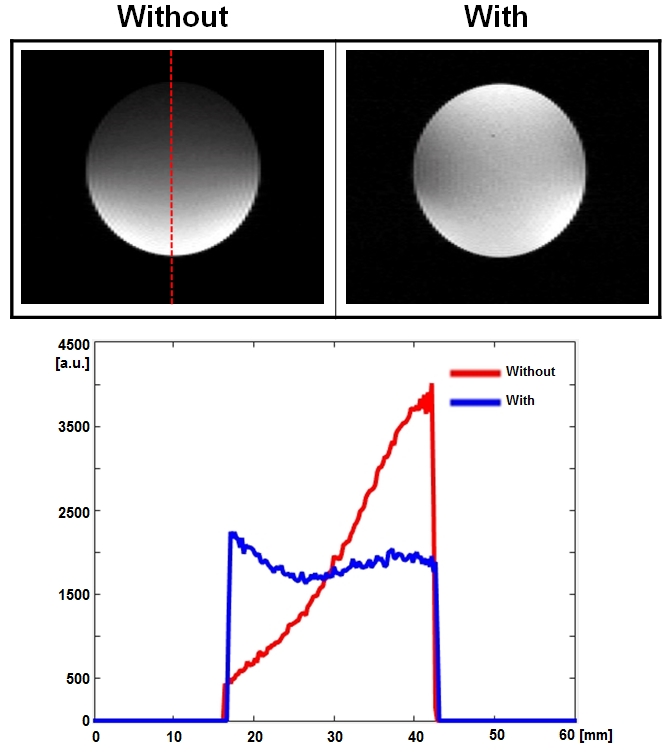
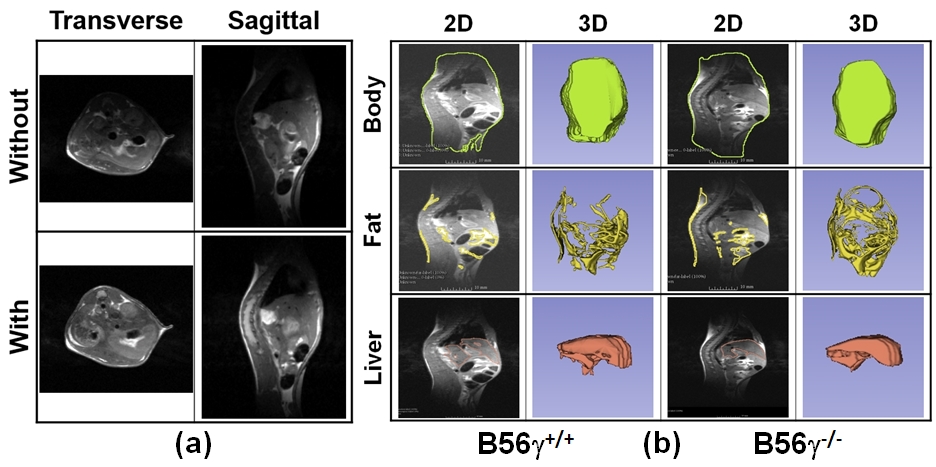
RESULTS AND DISCUSSION: Fig. 2 shows the in-vitro experimental results without and with the secondary resonator combined with different detuning conditions. The image sensitivity and uniformity were improved with the secondary resonator having detuning circuits compared to the other conditions. It is because the detuning circuits minimized interference between the transmit birdcage coil and the secondary resonator at the transmit mode, resulting in the uniform |B1+| distribution made by the transmit birdcage coil. The uniformity of |B1-| was also improved with the induced |B1-| made by the secondary resonator at the receive mode. The mean and standard deviation (SD) within the sample in Fig. 2 are: 1) mean: 1707 (Without) vs. 2040 (With), and 2) SD: 1108 (Without) vs. 555 (With). Fig. 3 (a) shows MR images of mice without and with the secondary resonator having detuning circuits in transverse and sagittal planes. The sensitivity and uniformity of images were improved with the secondary resonator. Fig. 3 (b) presents an example of a pre-clinical application. MR images were acquired from PP2A-B56g+/+control and PP2A-B56g-/- knockout mice using the designed secondary resonator having detuning circuits. Body, fat, and liver 3D volume images were reconstructed using the Slicer software (http://www.slicer.org) to compare the PP2A-B56g+/+ mouse to the PP2A-B56g-/- knockout mouse. The location of fat in the mice was identified in the MR images acquired using a fat saturation sequence. The corresponding 3D volume analysis confirmed that the PP2A-B56g-/- knockout mouse had an increased amount of fat tissue (fat volume: 1131 to 1921 mm3).
CONCLUSION: This study shows that the designed secondary resonator having detuning circuits improved sensitivity and uniformity of MR images acquired using the 4-channel phased array. The methods and results presented here can provide useful information for improving sensitivity and uniformity of MR images in high field human MRIs.
Acknowledgements
No acknowledgement found.References
REFERENCES
1. Quick et al., MRM 48 (5):781-790, 2002 2. Hoult et al., MRE 15 (4):262–285, 2002 3. Schnall et al., JMR 68:16l- 167, 1986 4. Kuhns et al., JMR 78:69-76, 1988
Figures