1414
Texture analysis based on T2WI, DWI and delayed T1-enhanced imaging for the differentiation of benign and malignant bone tumors1First affiliated hospital of Zhengzhou university, Zhengzhou, China, 2Clinical Science, Philips Healthcare, Beijing, China
Synopsis
With the development of MR techniques, the T2WI, DWI and delayed T1-enhanced imaging techniques have applied as the necessary and general clinical scanning sequences for the bone tumors. And the tumors would present a specific intensity distribution for a specific modality of these high resolution images. Therefore, this work investigated and evaluated the role of textures extracted from T2WI, DWI and delayed T1-enhanced imaging in characterizing the subtypes of bone tumors, and furtherly evaluate the ability of these textures to differentiate benign and malignant tumorsby using support vector machine classifier1 (SVM), which might be helpful for clinical diagnosis and studies.Results showed that the texture parameters extracted from these images have the ability to distinguish benign from malignant bone tumors based on SVM.
Purpose
T2WI is the conventional sequence applied to the examination of bone tumors. With the development of clinical MR application, DWI and delayed gadolinium-enhanced T1WI (T1-enhanced) imaging have become the common sequences for examination of the tumors. And for each image modality, the tumors would present a specific intensity distribution, which described the tissue characteristics of the tumor. In this work, the texture analysis based on T2WI, DWI and delayed T1-enhanced imaging were carried out to investigate the application on bone tumors and furtherly evaluate the ability of these texture parameters to differentiate benign and malignant tumors by using support vector machine (SVM) classifier1.Methods
Seventy-one patients (37 males and 34 females aged 33.1±18.7 years old) with bone tumors (all have been diagnosed as bone tumor according to pathological biopsy)were included in this study.And based on the WHO Classification of Tumors of Soft Tissue and Bone(2012) criteria, 71 patients were divided into two groups:31 for benign tumors and 40 for malignancies. All the patients were scanned by MR T2WI, DWI and delayed T1-enhanced imaging sequence based on a 3T MR scanner (Ingenia, Philips Healthcare, Best, the Netherlands). The imaging parameters of T2WI sequence: TR/TE=4200 ms/100 ms; FOV=360mm×380mm and slice thickness 4mm.The axial DWI sequences (TR/TE=3700/85ms, NSA=4) were performed with b0 and b800 and the corresponding apparent diffusion coefficient (apparent diffusion coefficient, the ADC) map were calculated.The delayed T1-enhanced imaging (TR/TE: 500ms/20ms) were performed with fat suppression and axial acquisition. For DWI images, the 3D whole volume ROI of the lesion were drawn on the b800 image and then the ROI was copied to b0image and ADCmap and saved DWI-related ROI masks. For T2WI and delayed T1WI-enhanced images, the 3D whole volume ROIs of the lesions were drawn on each image respectively. Three dimension texture calculations were carried out by using a modified radiomics-master Matlab toolbox for each modality (T2WI, T1WI-enhanced, b0, b800 and ADC maps). And for each modality, 43 textures (Table 1)were extracted and finally 43×5 textures were obtained. Firstly, two sample student’s T test was performed on each texture parameter to find the difference between groups. Then, the textures were reordered by fisher score which indicated the importance of the features. Finally, SVM with different features were performed to identify the malignant from the benign bone tumors by using the first leading features according to fisher scores for groups of T2WI (20 features), T1WI-enhanced (20 features), DWI (b0, b800,ADC) (40 features), the combination of T2W and DWI (40 features) and the combination of T2WI, DWI and T1WI-enhanced (40 features) respectively.Results
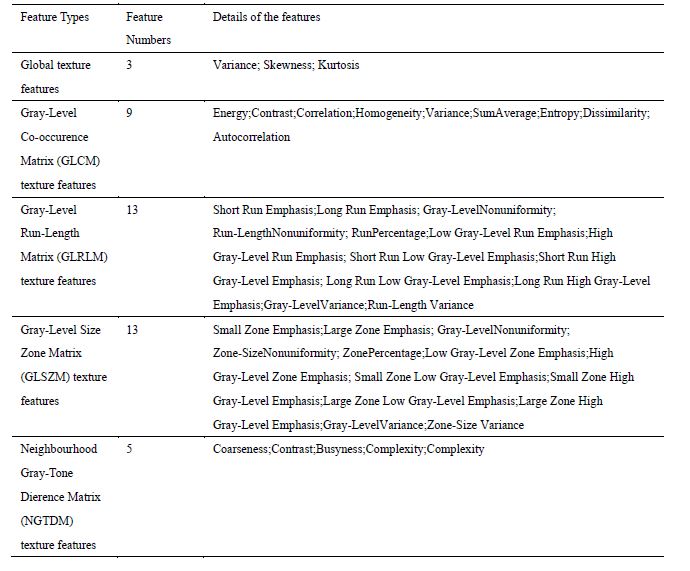
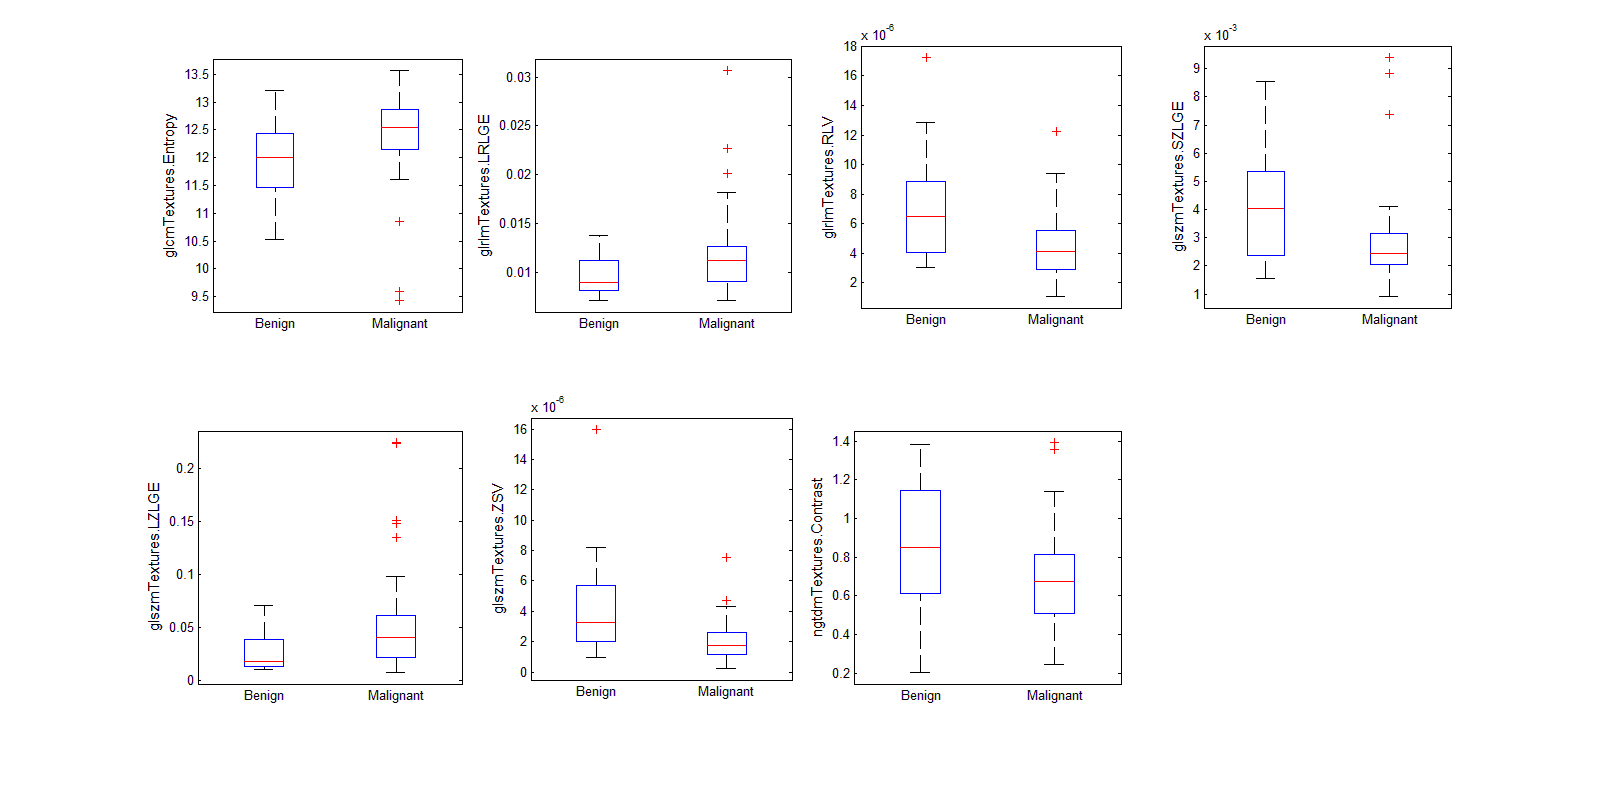
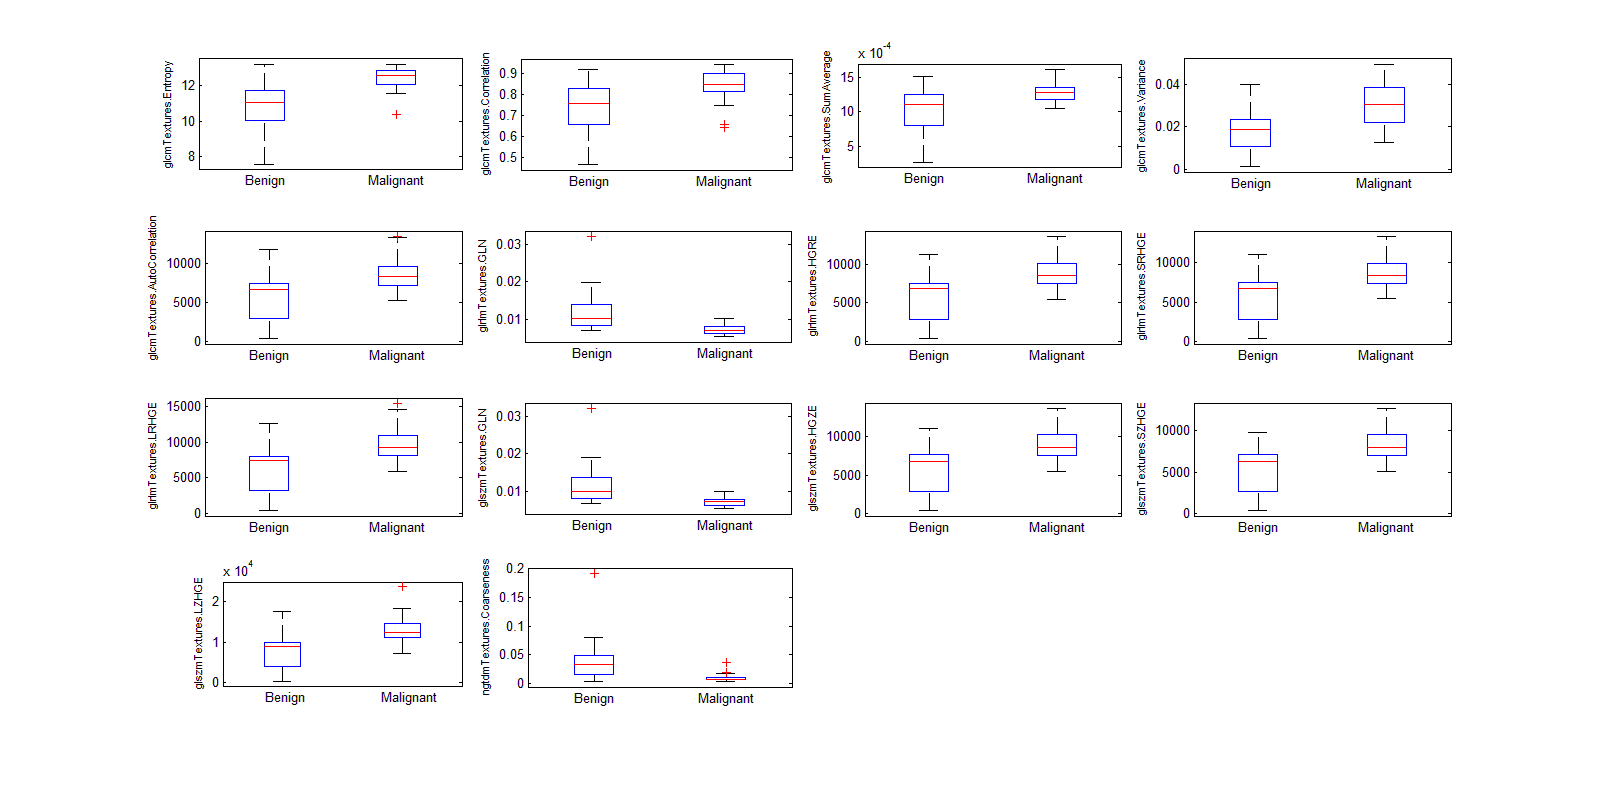
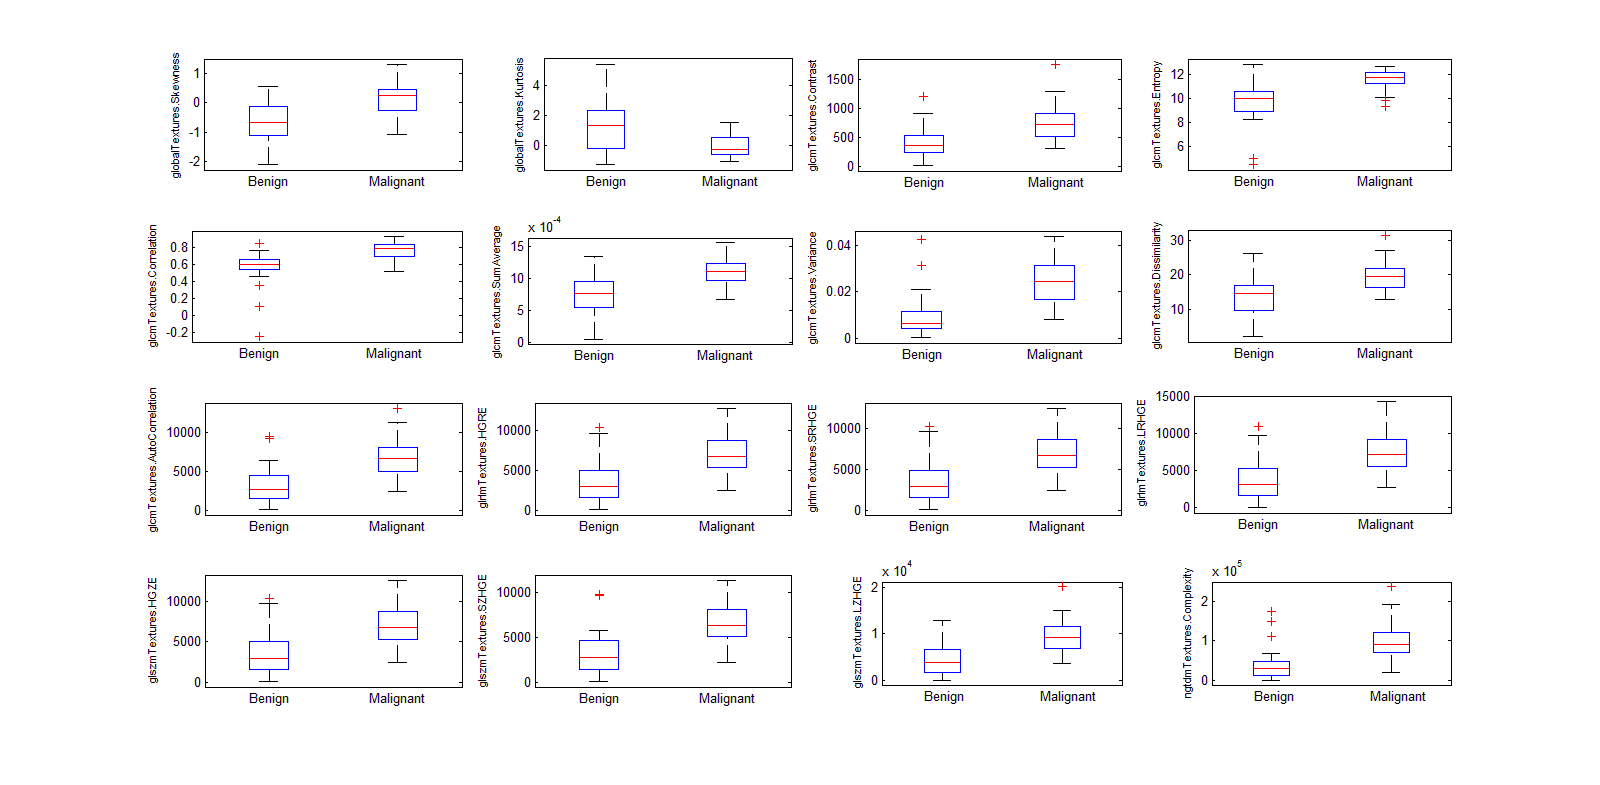
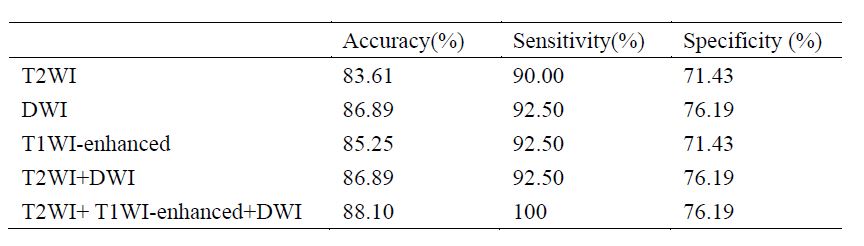
The features adopted in this work were summarized in Table 1.The statistical results were shown in Figure 1-3. Because there are too much textures showed significant difference, so just parts of these textures extracted from T2WI, T1WI-enchanced and ADC were showed. The classification results of the benign and malignant bone lesion were summarized in Table 2. Discussion
The T2WI, DWI and delayed T1-enhanced imaging are the necessary and conventional scanning sequences of the bone tumors. The T2WI reflects the basic morphological feature of the lesion. DWI sequence reflects the information of the water molecular diffusionin the lesion. The delayed T1-enhanced imaging showed the more accurate morphological feature and homogeneity of the lesion.Different types of tumors have the different microstructure1. Therefore, the textures can be applied to reflect the specificmicrostructure for a specific type of tumors2. Our study results show that the texture features extracted from the T2WI, DWI and delayed T1-enhanced imaging is able to differentiate benign from malignant bone tumors. And the SVM classification results showed some texture feature are effective in the differentiation of benign and malignant bone lesion with high accuracy especially for the combination of T2WI, DWI and T1WI-enhanced. And this would be helpful for the clinical diagnosis and corresponding treatment plans.Conclusions
Acknowledgements
No acknowledgement found.References
[1]. LuísaNogueira, Sofia Brandão, Eduarda Matos, et al. Application of the diffusion kurtosis model for the study of breast lesions[J].Eur Radiol,2014,24:1197-1203.
[2].Dang M, Lysack JT, Wu T, et al. MRI texture analysis predicts p53 status in head and neck squamous cell carcinoma [J]. AJNR Am J Neuroradiol. 2015,36(1):166-170.
Figures