1284
Mapping collagen and water proton densities in tibial cortical bone using 3D ultrashort echo time cones (3D-UTE-Cones) MR imaging techniques1Radiology, University of california, San Diego, San Diego, CA, United States, 2Radiology Service, VA San Diego Healthcare System, San Diego, CA, United States
Synopsis
Spatial variations of cortical bone microstructure and mechanics can be described by mapping proton densities as exist in macromolecular, bound, and pore water pools. Comparing bone signal in ultrashort echo time MRI (UTE-MRI) and in inversion recovery UTE MRI against a known external reference signal enabled us to measure total, bound, and pore water proton densities. Measured total water proton density combined with macromolecular fraction from magnetization transfer modelling resulted in macromolecular proton density estimation. We observed strong correlation between proton densities and bone porosity. The developed technique was performed robustly on ten young subjects. This technique may aid diagnosing bone diseases and injuries.
Introduction
Ultrashort echo time MRI (UTE-MRI) can image cortical bone for quantitative assessment(1,2). Macromolecular, bound, and pore water protons are the three major proton pools in cortical bone(2). Total, bound, and pore water proton densities (TWPD, BWPD, and PWPD) can be measured by comparing bone signal in UTE-MRI and inversion recovery UTE-MRI (IR-UTE-MRI) against a known external reference signal (2,3). PWPD can be estimated by subtracting BWPD from TWPD. Magnetization transfer UTE (UTE-MT) can indirectly measure the macromolecular protons fraction (MMF) in cortical bone based on a two-pool MT modeling (5,6). Macromolecular proton density (MMPD) can be measured by combining MMF and TWPD. This study aimed to develop a comprehensive technique to map TWPD, BWPD, PWPD, and MMPD in cortical bone as a potential tool for diagnosing bone injuries and diseasesMethods
Theory: TWPD and BWPD can be estimated by comparing the UTE and IR-UTE signals of cortical bone against the signal of a known external reference (22mmol/L H1, T2*≈0.35, and T1≈5ms) (2,3). Since bone and reference T2*>>TE, for a long TR and low flip angle (FA), the T2* and T1 effects can be neglected. Thus, TWPD can be estimated using Eq.1, where η and ρREF are coil sensitivity and reference proton density, respectively. For an effective pore water nulling, BWPD can be calculated using Eq.2 (4), where T1-BW is bound water T1 (125 ms and 135ms for ex vivo and in vivo, respectively). PWPD equals TWPD-BWPD (Eq.3). Two-pool MT modeling measures MMF as the ratio between MMPD and total proton densities based on the magnetization transferred from saturated macromolecular protons to water protons (6,7). Thus, MMPD can be calculated using Eq.4.
A: Ex vivo study
Sample preparation: Eight 30-mm cortical bone specimens were cut using a commercial band saw from fresh-frozen human tibial midshafts (63±19 years old, 5 women), provided by United Tissue Network, AZ.
UTE-MRI sequences: Specimens were placed in a plastic container filled with Fomblin, then scanned on a 3T clinical scanner (MR750, GE Healthcare Technologies, WI) using an eight-channel knee coil. A 3D-UTE-Cones sequence (TR=100, TEs=0.032ms, FA=10˚) and a 3D-IR-UTE-Cones sequence (TI=45, TR=100, TEs=0.032ms, FA=20˚) were performed to measure water proton densities. An actual FA variable TR (AFI-VTR) sequence (AFI: TE=0.032, TRs=20ms and 100ms, VTR: TE=0.032, TRs=20-100ms, FA=45˚) was performed for T1 measurements (8). A set of 3D-UTE-Cones-MT sequences were performed (saturation powers=500°, 1000°, and 1500°; frequency offsets=2, 5, 10, 20, 50kHz; FA=7˚) for UTE-MT modeling. Field of view (FOV), matrix dimension, nominal pixel size, and slice thickness were 14cm, 256×256, 0.54mm, and 2mm, respectively.
Micro-computed tomography (µCT): Proton densities were compared with bone porosity (BPO) and mineral density (BMD), as measured with a Skyscan 1076 (Kontich, Belgium) µCT scanner at 9 µm isotropic voxel size.
B: In vivo study
Tibial midshaft in ten young volunteers (35±3 years old, 6 women) were imaged using the same coil and sequences. Specifically, FOV, matrix dimension, nominal in-plane pixel size, number of slices, and slice thickness were 12cm, 160×160, 0.75mm, 24, and 5mm, respectively. The total in vivo scan time was approximately 40 minutes.
C: Data analysis: Proton density maps were generated using a developed code implementing Eq.1-4 in MATLAB (Mathworks, MA, USA). To avoid noisy and pixelated maps, all results were smoothed on 4×4 sub-windows. MRI and µCT results were calculated in twelve regions of interest (ROIs) per specimen, and followed by calculation of Pearson’s correlations.
Results
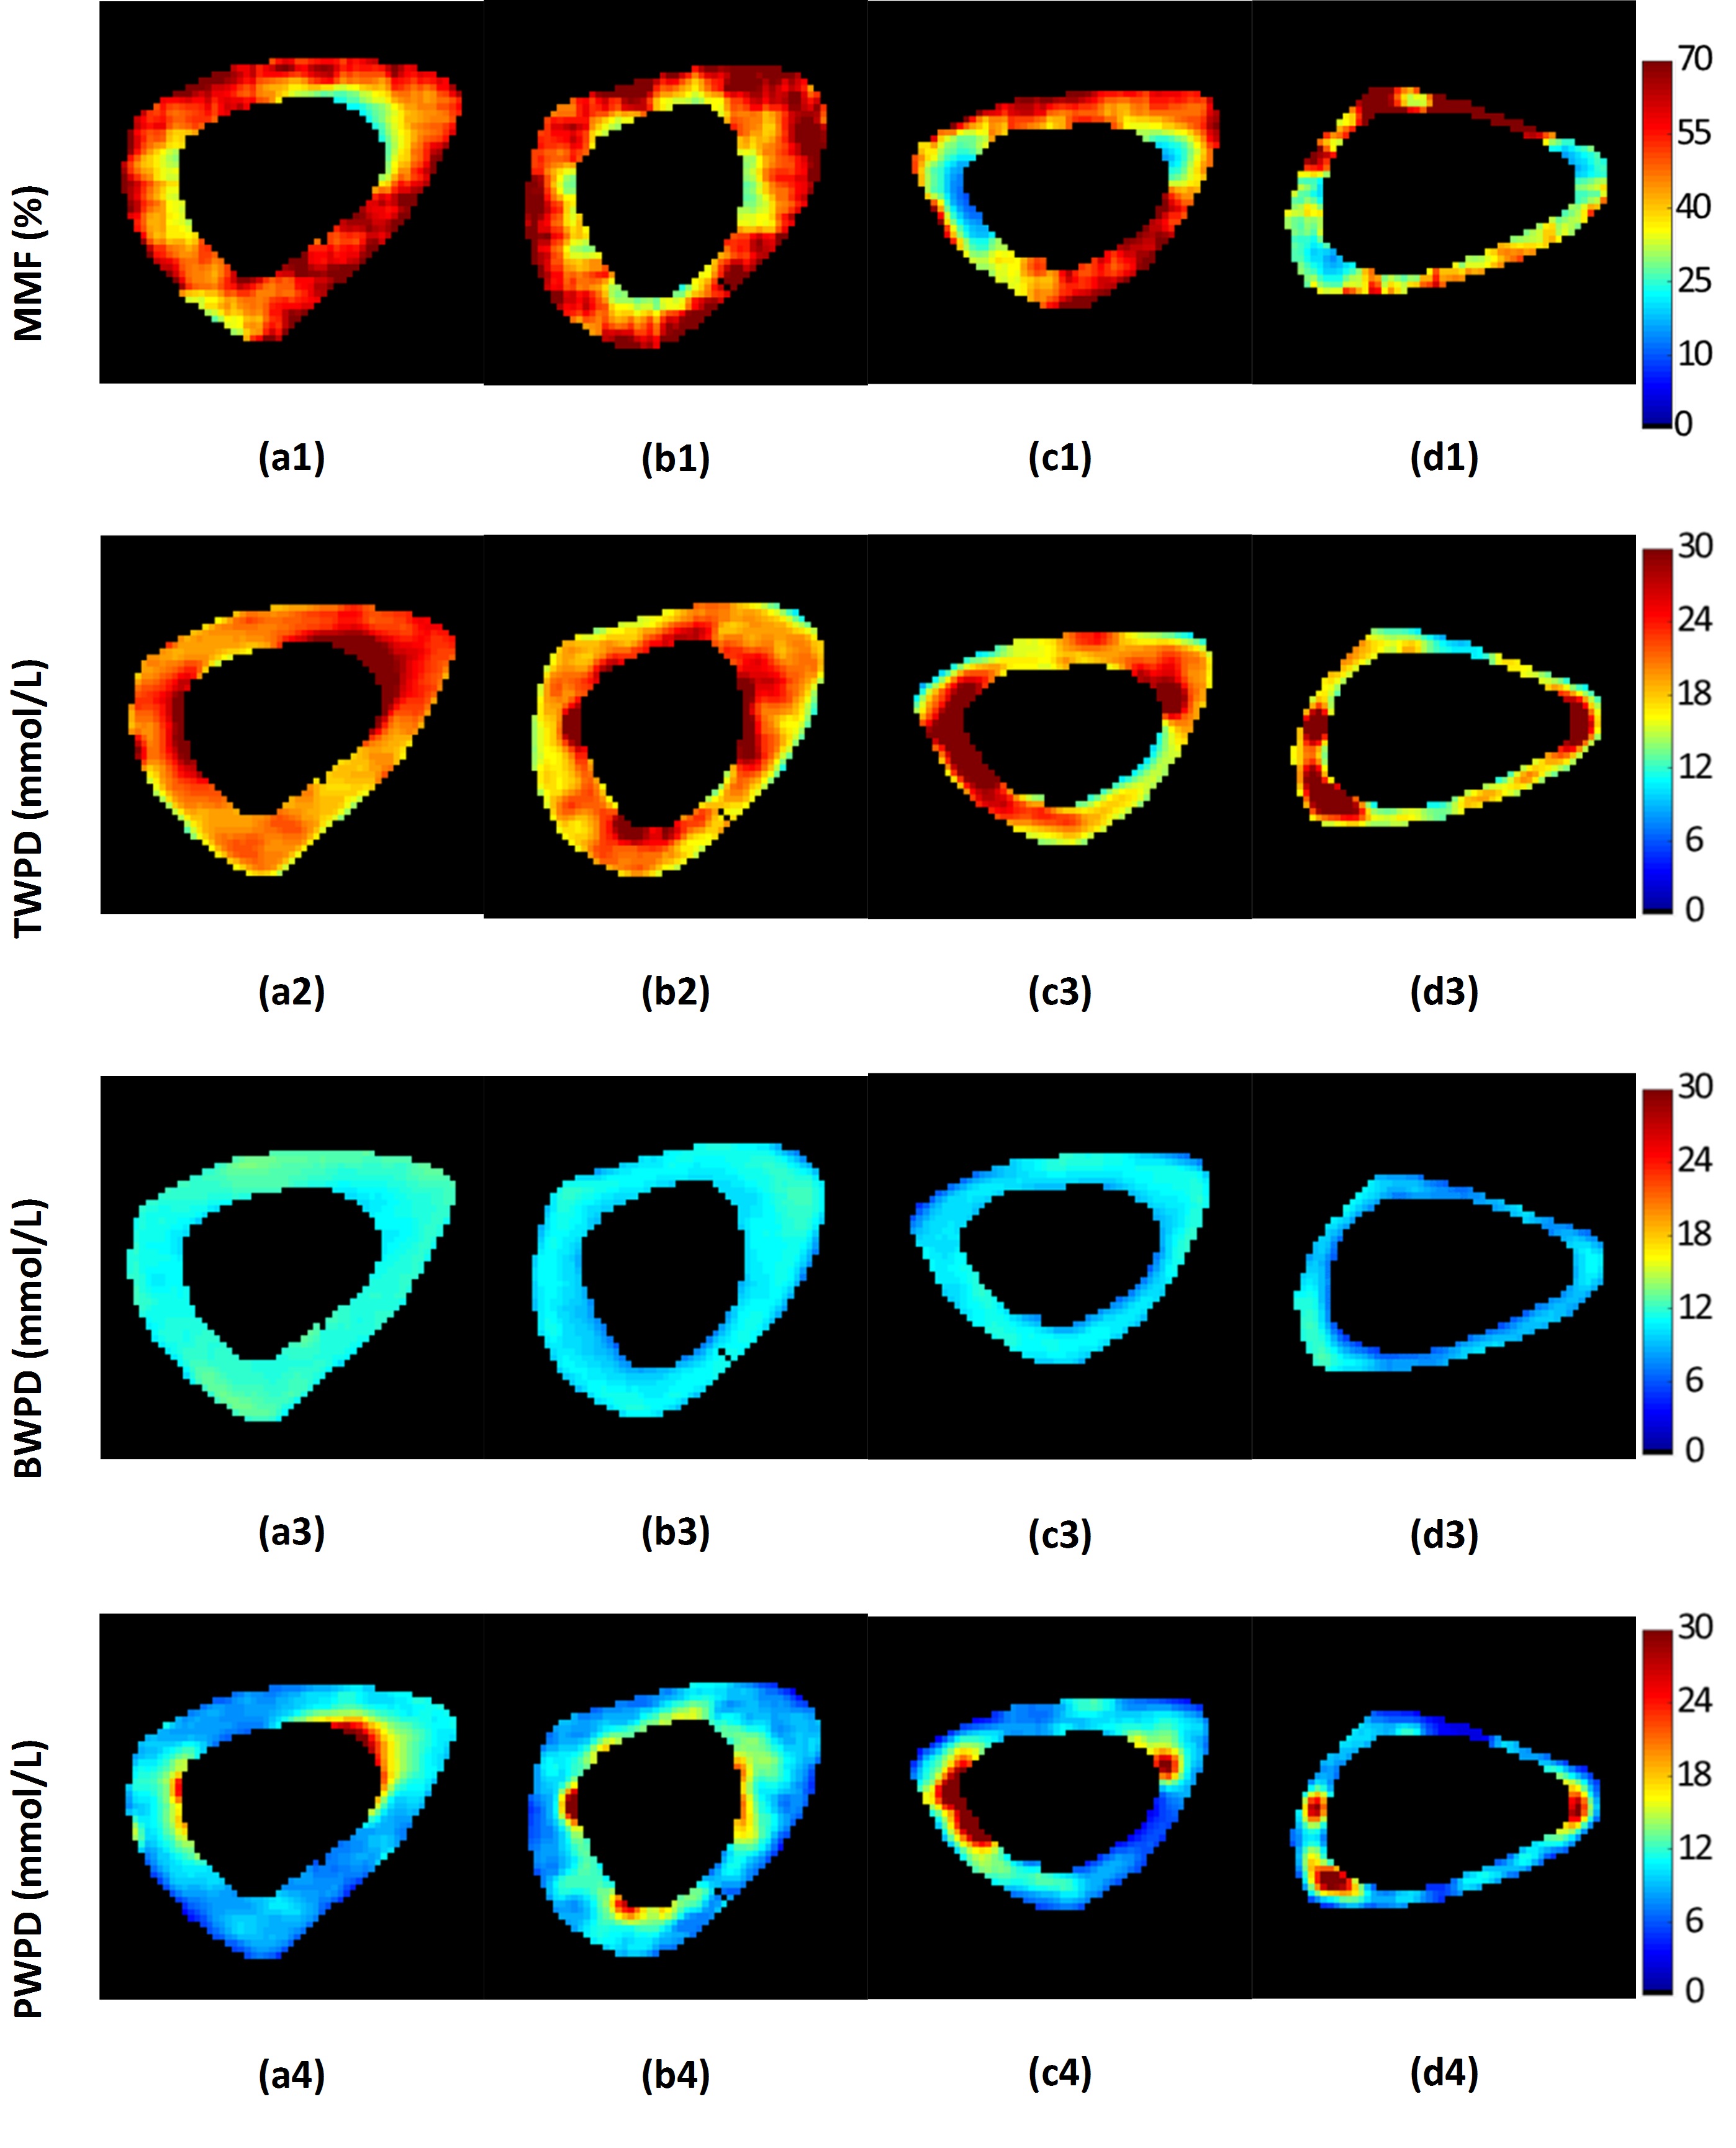
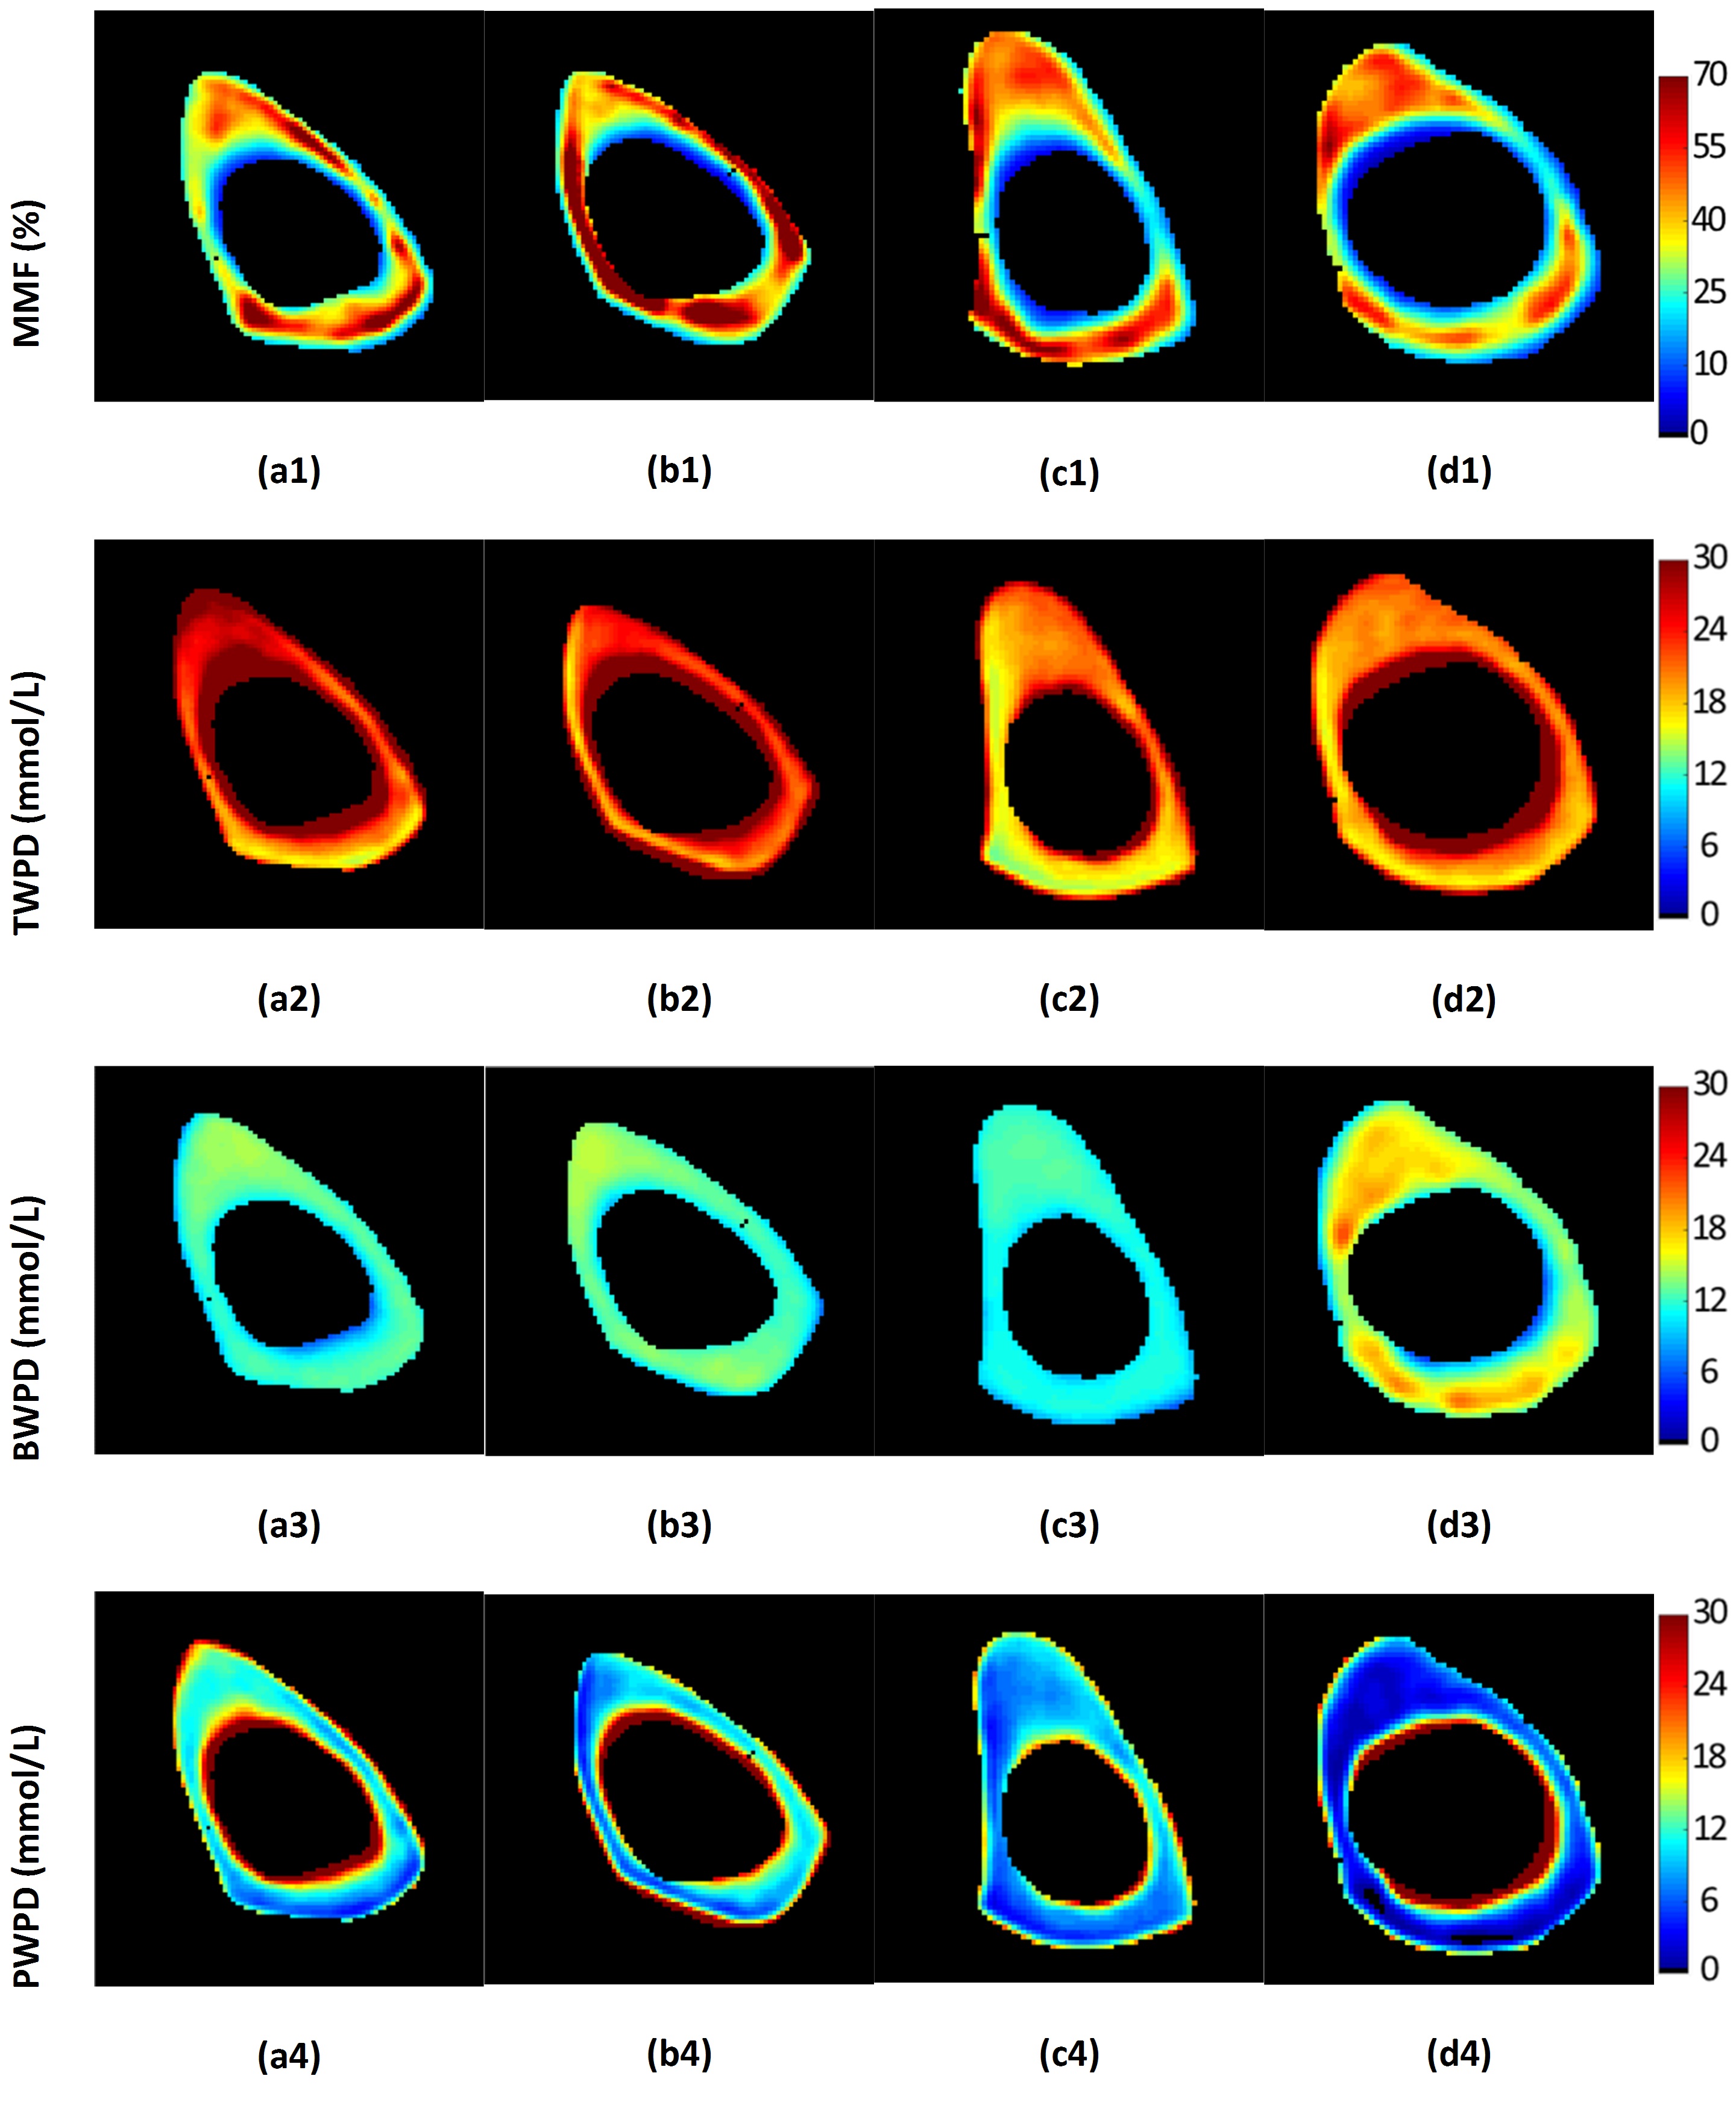
Figure 1 shows UTE-MRI, IR-UTE, and μCT images of a representative tibial bone specimen (73-year-old man). Figure 2 (Table) presents Pearson’s correlations between proton densities and μCT measures. BPO and BMD demonstrated the highest correlation with PWPD (R=0.81 and R=0.71, respectively; p<0.01). Figure 3 demonstrates linear regressions of MRI results on BPO. TWPD, PWPD, and MMPD showed strong correlations with BPO. Figure 4 shows proton density maps and corresponding μCT images in four female bone specimens. Higher porosity locations corresponded to PWPD maxima and MMPD minima. MMPD was lower in elderly female donors versus young donors. Figure 5 shows generated maps for four healthy young volunteers (2 women) from studied ten subjects.Discussion
Our developed mapping technique performed consistently in vivo and ex vivo. Strong correlations were observed between proton densities and μCT measures. For bone specimens from elderly donors, MMPD was lower and PWPD was higher when compared with young donors. BWPD on average was higher in vivo, likely due to losses during ex vivo sample preparation.Conclusion
The proposed comprehensive proton density mapping can trace all major pools of protons in cortical bone. Such proton densities can potentially serve as a novel tool to assess bone microstructure and mechanics, as well as age- or injury-related variations.Acknowledgements
The authors acknowledge grant support from NIH (1R21AR073496, R01AR068987) and VA Clinical Science and Rehabilitation R&D Awards (I01CX001388 and I01RX002604).References
1. Chang EY, Du J, Chung CB. UTE imaging in the musculoskeletal system. J. Magn. Reson. Imaging 2015;41:870–883. doi: 10.1002/jmri.24713.
2. Du J, Bydder GM. Qualitative and quantitative ultrashort-TE MRI of cortical bone. NMR Biomed. 2013;26:489–506. doi: 10.1002/nbm.2906.
3. Du J, Chiang AJT, Chung CB, Statum S, Znamirowski R, Takahashi A, Bydder GM. Orientational analysis of the Achilles tendon and enthesis using an ultrashort echo time spectroscopic imaging sequence. Magn. Reson. Imaging [Internet] 2010;28:178–184. doi: 10.1016/j.mri.2009.06.002.
4. Du J, Carl M, Bydder M, Takahashi A, Chung CB, Bydder GM. Qualitative and quantitative ultrashort echo time (UTE) imaging of cortical bone. J. Magn. Reson. [Internet] 2010;207:304–311. doi: 10.1016/j.jmr.2010.09.013.
5. Ma Y-J, Chang EY, Carl M, Du J. Quantitative magnetization transfer ultrashort echo time imaging using a time-efficient 3D multispoke Cones sequence. Magn. Reson. Med. [Internet] 2017;00:1–9. doi: 10.1002/mrm.26716.
6. Ma Y-J, Shao H, Du J, Chang EY. Ultrashort echo time magnetization transfer (UTE-MT) imaging and modeling: magic angle independent biomarkers of tissue properties. NMR Biomed. 2016;29:1546–1552. doi: 10.1002/nbm.3609.
7. Ma Y-J, Zhu Y, Lu X, Carl M, Chang EY, Du J. Short T 2 imaging using a 3D double adiabatic inversion recovery prepared ultrashort echo time cones (3D DIR-UTE-Cones) sequence. Magn. Reson. Med. [Internet] 2017;00:1–9. doi: 10.1002/mrm.26908.
8. Ma Y-J, Lu X, Carl M, Zhu Y, Szeverenyi NM, Bydder GM, Chang EY, Du J. Accurate T 1 mapping of short T 2 tissues using a three-dimensional ultrashort echo time cones actual flip angle imaging-variable repetition time (3D UTE-Cones AFI-VTR) method. Magn. Reson. Med. [Internet] 2018;00:1–11. doi: 10.1002/mrm.27066.
Figures