1239
Investigation of blood flow causing pulsatile tinnitus in a patient-specific benchtop flow model1Radiology and Biomedical Imaging, University of California San Francisco, San Francisco, CA, United States, 2Neurology, University of California San Francisco, San Francisco, CA, United States
Synopsis
We created 3D printed patient-specific cerebral venous flow models of a patient with pulsatile tinnitus (PT) caused by idiopathic intracranial hypertension whose PT was resolved by CSF removal via lumbar puncture (LP). Prior to and almost immediately after the LP, she underwent MR imaging consisting of anatomic and flow evaluation sequences. Benchtop flow models were generated from both the pre and post LP data sets. We performed sound measurements and flow analysis of these models to identify flow features that correlate with sound production. Very similar features were seen both in vitro and in vivo in the pre-LP (PT) state that were absent in the post-LP (no PT) state. Patient-specific flow models may be an appropriate in vitro surrogate for venous causes of PT that could enable concrete determination of the links between geometry, blood flow, and PT.
Introduction
Pulsatile tinnitus (PT) is the perception of a rhythmic sound synchronous to the heart beat heard without an external source, affecting 3-5 million Americans. PT is frequently associated with aberrant blood flow in cerebral venous vasculature near the cochlea. Venous PT can manifest due to several causes including intracranial hypertension, stenoses, diverticula, and possibly high-riding jugular bulbs1-3, but the mechanistic link between anatomy, blood flow and PT remains unknown. We hypothesize patient-specific flow models to be an adequate in vitro surrogate to allow for further investigation into this phenomenon.
Methods
Ten patients with PT and IIH were recruited from the UCSF Pulsatile Tinnitus Clinic to undergo 2D phase contrast MRI, CE-MRV and 4D Flow MRI immediately before and after LP. Six patients were imaged till date and they rated PT symptoms pre- and post-LP on a scale from 0 (no sound) to 10 (unbearable) at the time of imaging. Five of the patients had their symptoms alleviated by the LP. For one such patient, we created two patient-specific benchtop flow models representing the cerebral venous outflow pre- and post-LP based on her CE-MRV data. The respective anatomies were segmented, and 3D printed in wax and set in silicone separately. The wax was then melted out of silicone to create corresponding hollow patient-specific venous models. A rotary pump was employed to mimic cardiac cycle (60 cycles/min), pumping water at the patient-specific flow rate (9cc/s) through a flow circuit with pre- and post-LP models connected serially. Sound measurements (duration = 15s, repetitions = 10) were recorded at similar locations for pre- and post-LP models using an electronic stethoscope (80-2000Hz) coupled with ultrasound gel. The setup was then moved into the MR suite to perform 4D Flow MRI (1.67 mL Gadolinium diluted in 1 L water, ICOSA6 VENC = 75 cm/s) to determine the flow velocity field and distribution of turbulent kinetic energy (TKE).Results
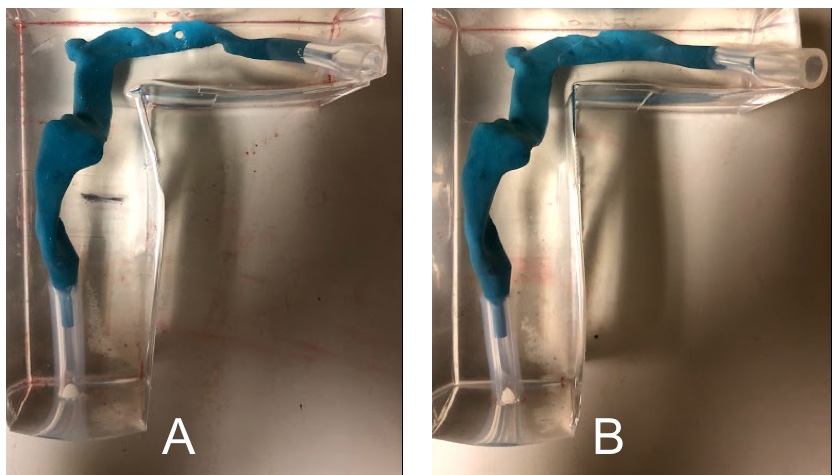
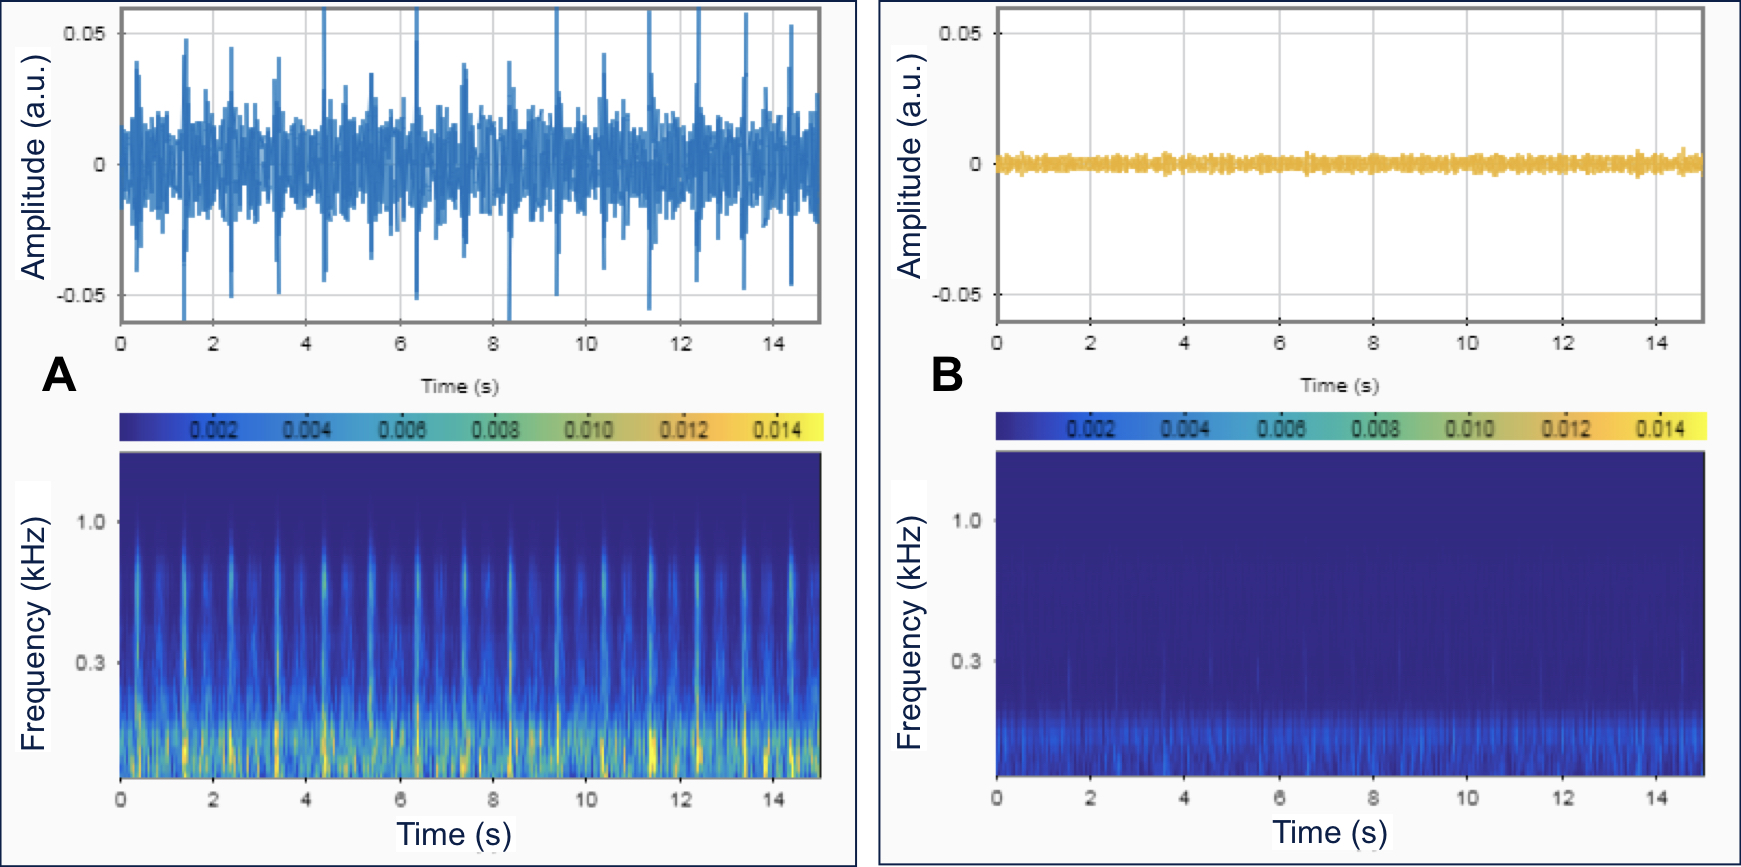
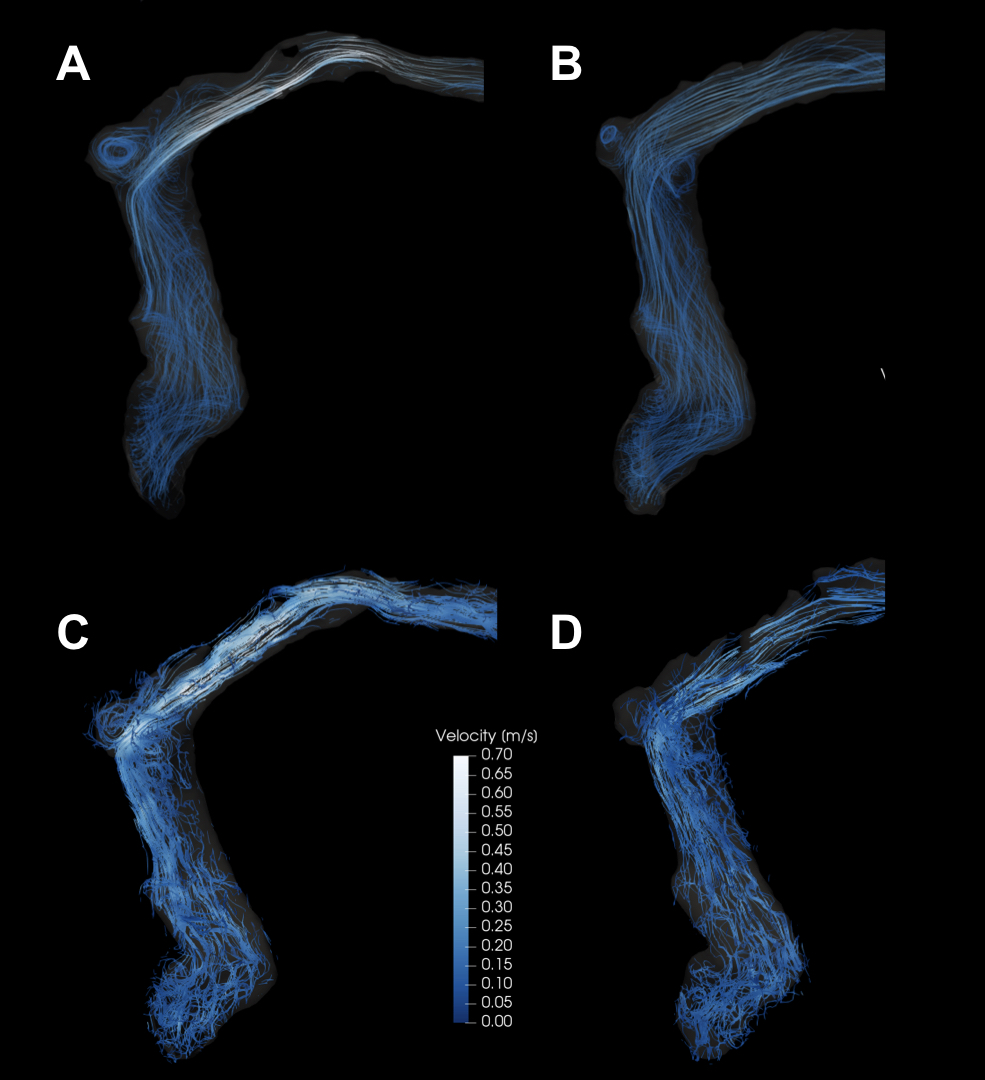
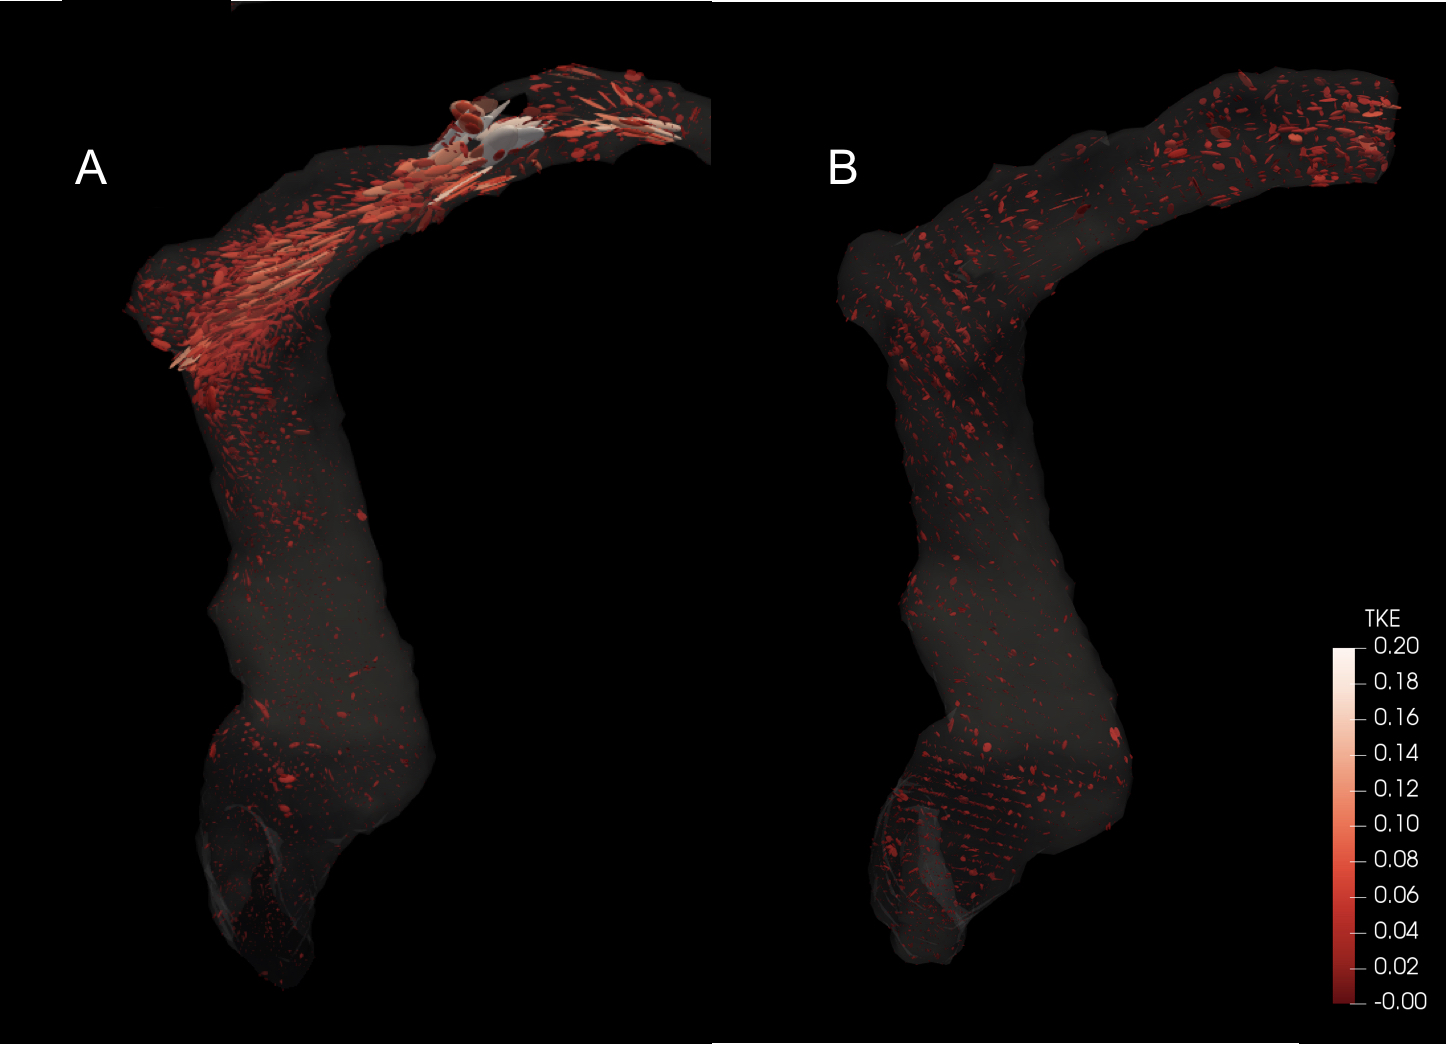
The 3D printed benchtop flow models accurately reproduced the vascular anatomy of the patient, demonstrating transverse sinus stenosis pre-LP and near resolution of the stenosis post-LP (Figure 1A and 1B). Ten separate sound recordings at the transverse sinus of pre- and post-LP models (Figure 2A and 2B) yielded minimal intra-model variation in peak-to-rms amplitude values (3.31 ± 0.45 for pre-LP; 1.98 ± 0.41 for post-LP), with pre-LP model being significantly louder than the post-LP model (p<0.001). 4D Flow MRI of the models (Figure 3A and 3B) revealed qualitative similarity of flow patterns to in vivo results (Figure 3C and 3D), revealing high velocity jets in the transverse sinus region pre-LP with jet reduction post-LP. TKE was most pronounced in the region immediately distal to the stenosis in the pre-LP model, and greatly reduced in the post-LP model (Figure 4A and 4B).Discussion
We have created patient-specific flow models that are able to closely mimic the flow conditions and sound generation seen in patients. In this case study, we demonstrated PT intensity to be correlated with the presence of a high-velocity flow-jet and a large amount of turbulence down-stream from a stenosis. In the models, the loudest recordings were obtained at the transverse sinus stenosis (in the pre-LP model) and rapidly decayed with increased distance from the stenosis. In the post-LP model, there was nearly no measurable sound recorded in the same location, which correlated with the patient’s resolution in symptoms. Our results suggest patient-specific flow models may be an appropriate in vitro surrogate for venous causes of PT.Conclusion
We created patient-specific benchtop venous flow models that reliably produced sounds and had flow features that were similar to in vivo. These models may be an appropriate in vitro surrogate to allow for further investigation into the exact mechanistic link between patient geometry, blood flow, and sound.Acknowledgements
This study was supported by the National Center for Advancing Translational Sciences, National Institutes of Health, through UCSF-CTSI Grant Number B27552C, and National Institutes of Health under award number R21 DC016087-01A1.References
1. Sonmez G, Basekim CC, Ozturk E, Gungor A, Kizilkaya E. Imaging of pulsatile tinnitus: a review of 74 patients. Clin Imaging. 2007;31(2):102–108. doi: 10.1016/j.clinimag.2006.12.024.
2. Liu Z, Chen C, Wang Z, et al. Sigmoid sinus diverticulum and pulsatile tinnitus: analysis of CT scans from 15 cases. Acta Radiol. Apr 2013.
3. Pegge SAH, Steens SCA, Kunst HPM, Meijer FJA. Pulsatile Tinnitus: Differential Diagnosis and Radiological Work-Up. Curr Radiol Rep. 2017;5(1):5.
Figures