1195
On the value of high-performance gradients for clinical MR imaging1Department of Radiology, Medical Physics, Medical Center - University of Freiburg, Faculty of Medicine, University of Freiburg, Freiburg, Germany, 2Department of Radiology, Medical Center - University of Freiburg, Faculty of Medicine, University of Freiburg, Freiburg, Germany
Synopsis
High-performance imaging remains to be one of the hot topics in scientific and clinical development over the recent decades. High-performance gradients are also commonly believed to promise several good image quality and rapid acquisition times.
In this project we question the hypothesis that strong gradient systems are advantageous for standard clinical imaging and diagnostics. More specifically we aim to analyse the impact of distinct reduced gradient performance parameters on imaging quality of stroke, cardiac and liver protocols compared to the state-of-the-art high-performance gradient systems at 1.5T, while keeping parameters and measurement time as close as possible.
Introduction
High-performance imaging remains to be one of the hot topics in scientific and clinical development over the recent decades. Gradient systems with gradient strength of more than 80mT/m and slew rates of 200mT/m/ms for 7T/3T are not uncommon for the cutting the edge methods like diffusion tensor imaging and generic fast imaging1-3. High-performance gradients are also commonly believed to promise several good image quality and rapid acquisition times.
In this project we question the hypothesis that strong gradient systems are advantageous for standard clinical imaging and diagnostics. More specifically we aim to analyse the impact of distinct reduced gradient performance parameters (low-performance system, LP) on imaging quality of stroke, cardiac and liver protocols compared to the state-of-the-art high-performance gradient systems (HP) at 1.5T, while keeping parameters and measurement time as close as possible.
Methods
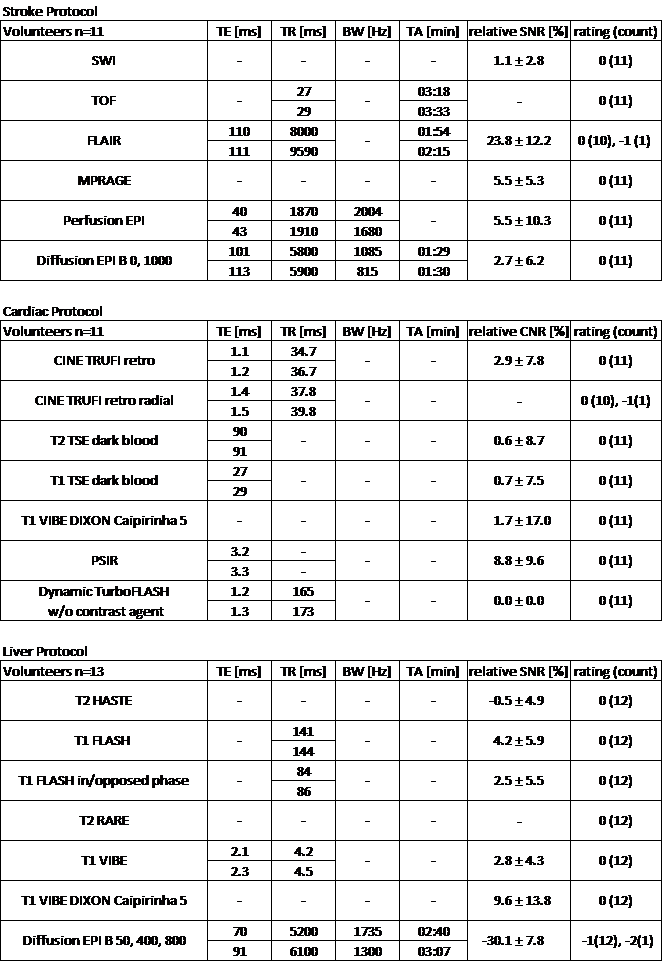
Several basic vendor provided sequences were modified to limit the maximum gradient strength and slew rate, respectively, to arbitrary values. Volunteer measurements for stroke, cardiac and liver protocols were performed on a HP Siemens 1.5T AERA system (maximum gradient amplitude per image axis 24mT/m@180mT/m/ms, maximum absolute gradient amplitude 43mT/m per physical gradient axis). Each volunteer underwent a standard HP protocol procedure (as used in clinical routine in our department) as well as the modified LP procedure (maximum gradient amplitude 16 mT/m@160mT/m/ms, absolute amplitude of 27mT/m). An overview of each protocol with the used sequences is given in Table 1. For clarity, not the entire protocols but only the differences in parameters between HP and LP are shown.
Image quality was assessed by relative SNR (LP divided by HP) or CNR (cardiac: myocardium, blood pool) analysis depending on the image contrast (if applicable). In addition images were critically rated by an independent radiologist using the following scale:
0 equivalent
-1 worse,
but still diagnostically relevant
-2 still
diagnostically relevant with restrictions
-3 unusable
Results
Stroke Protocol
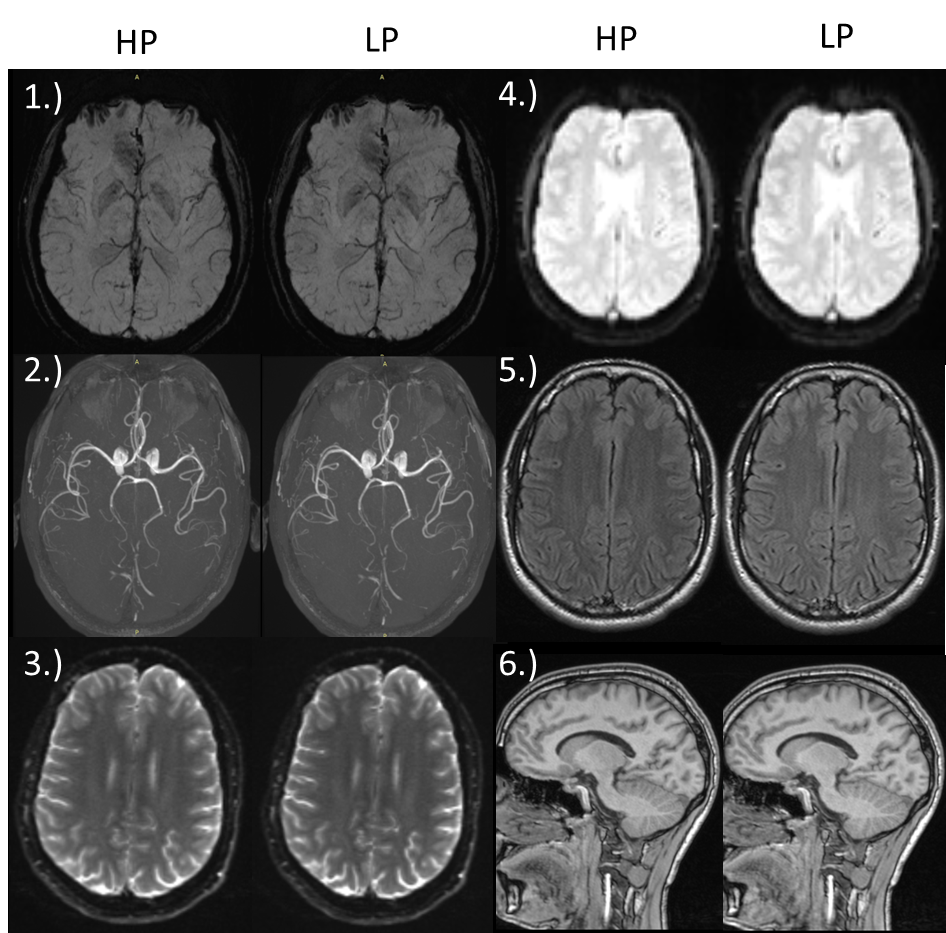
All used sequences performed very well. SNR analysis as well as the rating shows that HP and LP protocol provide similar diagnostic information (Figure 1, Table 1). An increase in echo time (TE) is enforced by LP for Perfusion EPI for FLAIR, Perfusion EPI and Diffusion EPI. A significant increase in repetition time (TR) and corresponding acquisition time (TA) appears only for Flair and MPRAGE.
Cardiac Protocol
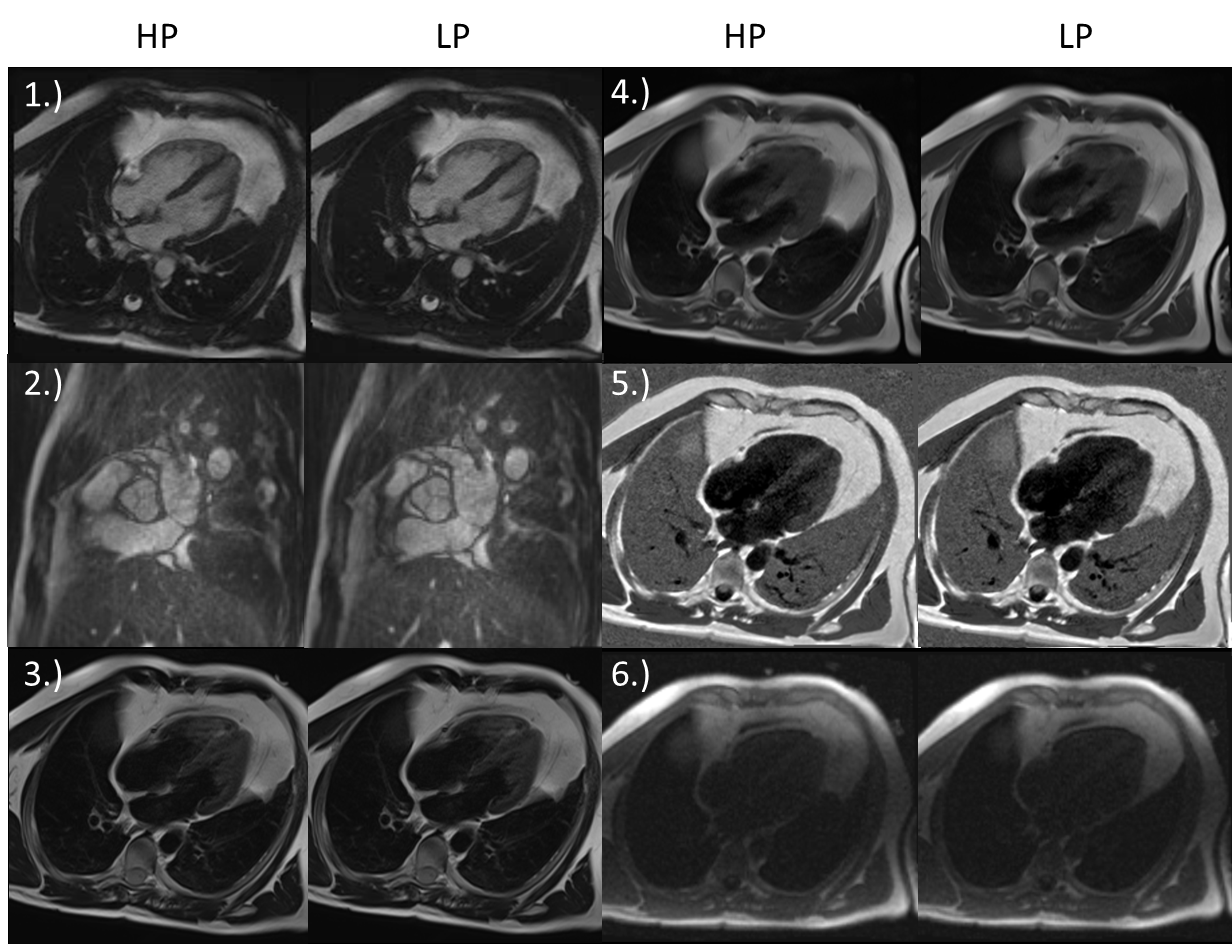
SNR analysis as well as the rating indicate no loss in quality for all used sequences (Figure 2, Table 1). A very slight increase of TE and TR for LP some protocols can be observed (Table1).
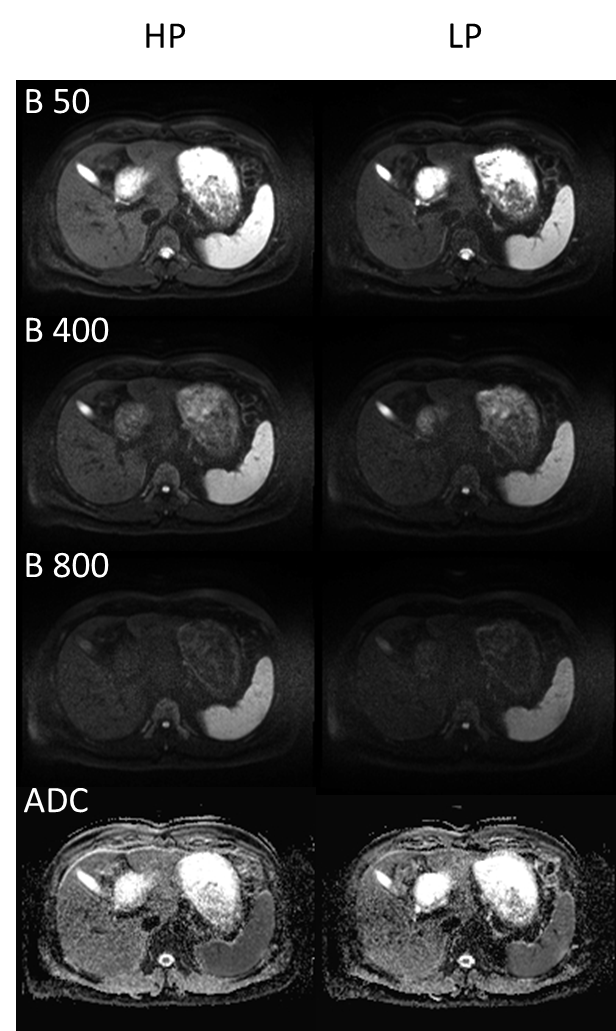
Liver Protocol
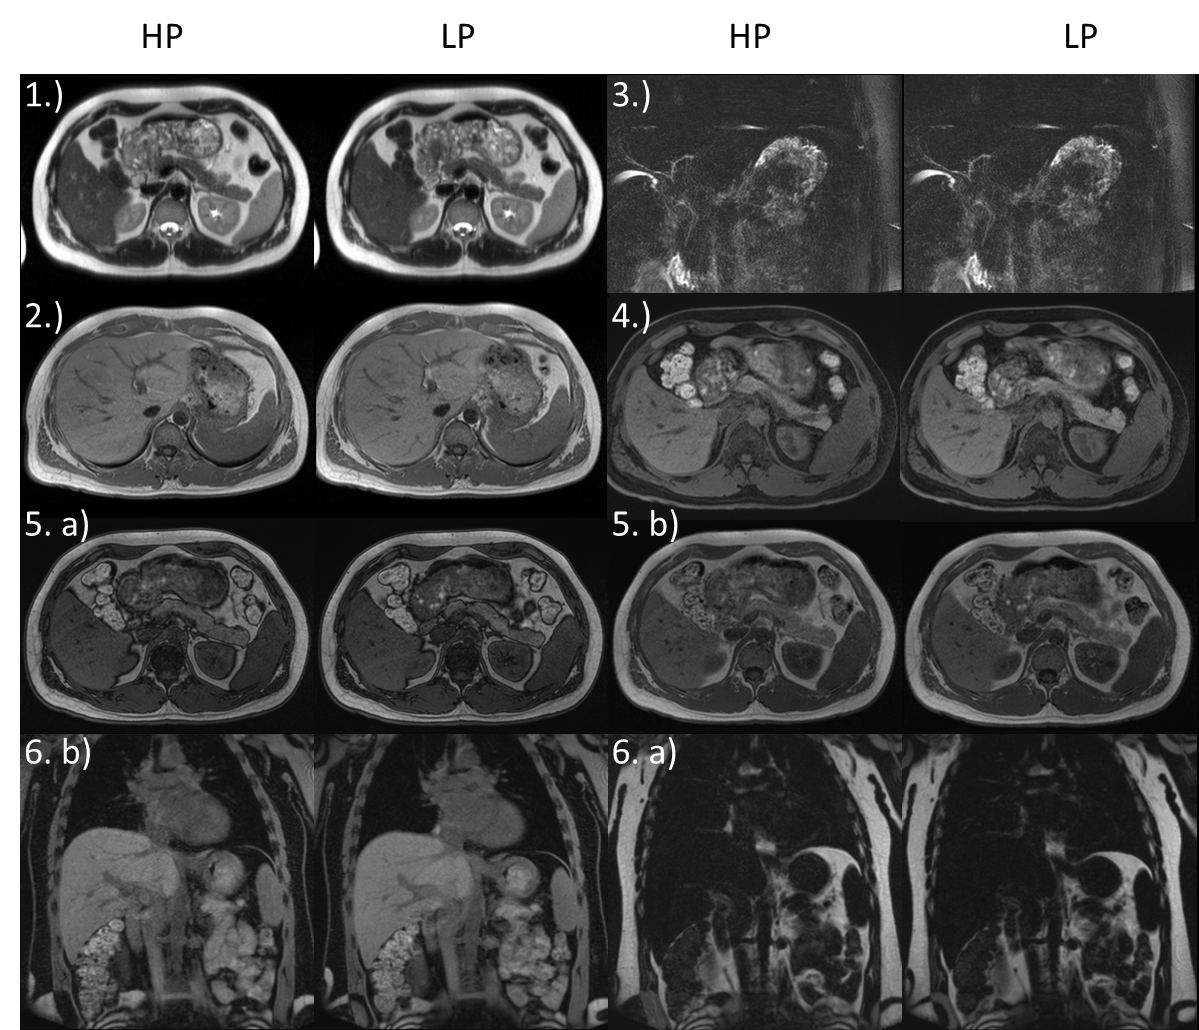
With the exception of the Diffusion EPI, no loss in quality for LP can be observed (Figure 3, Table 1). The only and most significant difference between LP and HP is seen for Diffusion EPI (Figure 4, Table 1): SNR is reduced by 30.1±7.8% also the rating confirms a lower quality (-1(12), -2(1)).
Discussion & Conclusion
Almost all used LP sequences in the three examined three protocols perform very well. In general, results show no significant differences in image quality and diagnostic relevance between HP and LP measurements.
For some sequences an increase in TE and/or TR occurs due to the reduced gradient performance. However, for cardiac imaging they do not affect TA or contrast due to retrospective gating or triggered (end-diastolic) acquisition strategies. For TOF and FLAIR acquisitions of the stroke protocol TA prolongation of +7.5 % (15s) and +18.4 % (21s) are still clinically acceptable.
Imaging protocols relying on EPI are more sensitive to performance deficits than all other sequences. For stroke Perfusion and Diffusion EPI the chosen LP gradient values cause a decrease of bandwidth. However, the reduced bandwidth also compensates partially for a loss of signal due to increased TE (echo-spacing) and provides therefore a comparable image quality. Reduced bandwidth and echo-spacing also result in an increase of geometric distortions which, however, was not treated as problematic by the radiologist.
Diffusion measurements in the liver as tested in our study contribute the only exception. Here the prolonged TE resulted in a signal loss of ~30% which is in accordance with the additional T2 decay for liver tissue with T2=46-51ms@1.5T. Therefore, image quality is lower compared to HP but still diagnostically usable as proven by the rating.
Note that, the aim of this study was a comparison HP and LP with minimal modifications. Further protocol optimisation regarding resolution, parallel imaging and advanced k-space sampling might compensate the detected deficiencies.
In conclusion, high-performance gradients have minimal impact on the image quality for standard clinical imaging and diagnostics.
Acknowledgements
References
1. Setsompop K, Kimmlingen R, Eberlein E, Witzel T, Cohen-Adad J, McNab JA, Keil B, Tisdall MD, Hoecht P, Dietz P, Cauley SF, Tountcheva V, Matschl V, Lenz VH, Heberlein K, Potthast A, Thein H, Van Horn J, Toga A, Schmitt F, Lehne D, Rosen BR, Wedeen V, Wald LL. Pushing the limits of in vivo diffusion MRI for the Human Connectome Project,NeuroImage, Volume 80 , 2013, Pages 220-233, ISSN 1053-8119, https://doi.org/10.1016/j.neuroimage.2013.05.078.
2. Uğurbil K, Xu J, Auerbach EJ, Moeller S, Vu AT, Duarte-Carvajalino JM, Lenglet C, Wu X, Schmitter S, Van de Moortele PF, Strupp J, Sapiro G, De Martino F, Wang D, Harel N, Garwood M, Chen L, Feinberg DA, Smith SM, Miller KL, Sotiropoulos SN, Jbabdi S, Andersson JL, Behrens TE, Glasser MF, Van Essen DC, Yacoub E.Pushing spatial and temporal resolution for functional and diffusion MRI in the Human Connectome Project,NeuroImage,Volume 80, 2013, Pages 80-104, ISSN 1053-8119, https://doi.org/10.1016/j.neuroimage.2013.05.012.
3. McNab JA, Edlow BL, Witzel T, Huang SY, Bhat H, Heberlein K, Feiweier T, Liu K, Keil B, Cohen-Adad J, Tisdall MD, Folkerth RD, Kinney HC, Wald LL. The Human Connectome Project and beyond: Initial applications of 300mT/m gradients,NeuroImage,Volume 80,2013,Pages 234-245,ISSN 1053-8119,https://doi.org/10.1016/j.neuroimage.2013.05.074.
4. M A Goldberg, P F Hahn, S Saini, M S Cohen, P Reimer, T J Brady, and P R Mueller. Value of T1 and T2 relaxation times from echoplanar MR imaging in the characterization of focal hepatic lesions. American Journal of Roentgenology 1993 160:5, 1011-1017
5. Stanisz GJ, Odrobina EE, Pun J, Escaravage M, Graham SJ, Bronskill MJ, Henkelman RM. T1, T2 relaxation and magnetization transfer in tissue at 3T. Magn Reson Med. 2005 Sep;54(3):507-12.
6. de Bazelaire CM1, Duhamel GD, Rofsky NM, Alsop DC. MR imaging relaxation times of abdominal and pelvic tissues measured in vivo at 3.0 T: preliminary results. Radiology. 2004 Mar;230(3):652-9.
Figures