1153
The Effects of Genetic Risk Factors for Glaucoma on the Visual Pathway using Diffusion Tensor MRI1Department of Ophthalmology, New York University School of Medicine, New York, NY, United States, 2Department of Ophthalmology, University of Pittsburgh, Pittsburgh, PA, United States, 3Department of Ophthalmology and Visual Sciences, University of Wisconsin - Madison, Madison, WI, United States, 4McPherson Eye Research Institute, University of Wisconsin - Madison, Madison, WI, United States, 5Department of Medical Physics, University of Wisconsin - Madison, Madison, WI, United States, 6Department of Ophthalmology and Visual Sciences, University of Iowa College of Medicine, Iowa City, IA, United States, 7Department of Radiology, New York University School of Medicine, New York, NY, United States
Synopsis
Glaucoma is the second leading cause of blindness worldwide. To date, the cause of the disease is still unknown, yet a number of candidate genes for glaucoma have been recently identified. In this study, we evaluated the effects of some of these genetic risk factors on the visual pathway using diffusion tensor MRI in experimental animal models. We found that LTBP2 mutants in cats and DBA/2J mice had decreased fractional anisotropy and increased radial diffusivity in the visual pathway. DBA/2J mice also exhibited reduced axial diffusivity, whereas TBK1-transgenic mice did not show detectable DTI changes along the visual pathway.
Purpose
Glaucoma is the second leading cause of blindness in the world (1) characterized by progressive retinal ganglion cell death and irreversible vision loss. It is an age-related disease and a serious public health issue in the elderly. While elevated intraocular pressure is a major risk factor, the cause of the disease is still unknown. A number of candidate genes for glaucoma have been recently identified. However, the contributions of these genetic risk factors to glaucomatous neurodegeneration remain largely unexplored (2). In this study, we evaluated the utility of DTI to detect the effects of some of these genetic risk factors on the visual pathway.Methods
Animal Preparation: The following experimental glaucoma models and their controls were employed: (A) LTBP2 feline model of primary congenital glaucoma (3): This is a spontaneous, recessively inherited form of primary congenital glaucoma (PCG), that represents the ortholog of human PCG (GLC3D) caused by a mutation in the gene LTBP2. Feline PCG is a slowly progressive condition, amenable to long-term, longitudinal structure-function studies.;(B) DBA/2 mouse model of inhereditary pigmentary glaucoma (4): The DBA mouse line represents late onset, chronic pigmentary glaucoma due to elevations in intraocular pressure that result from melanosomal protein mutations;(C) TBK1 transgenic mouse model of normal tension glaucoma (5): This model has one copy of the human TBK1 gene (native promoter and gene structure) incorporated into the mouse genome (Tg-TBK1) mimicking the pathogenicity of the TBK1 gene duplication in human glaucoma.
MRI Protocols: Cat DTI was performed using a 3-Tesla GE MRI scanner, whereas mouse DTI was performed using 9.4-Tesla Varian/Agilent MRI scanner. Slices were oriented orthogonal to the prechiasmatic optic nerves. DTI parametric maps including fractional anisotropy (FA), axial diffusivity (λ//), and radial diffusivity (λ┴) maps were computed using DTIStudio. Manual regions of interest were drawn on the optic nerves optic tracts and/or internal capsules based on color-encoded FA directionality maps. DTI parametric values were compared between experimental and control groups using ANOVA and post-hoc multiple comparisons correction test. Results were considered significant when p<0.05.
Results
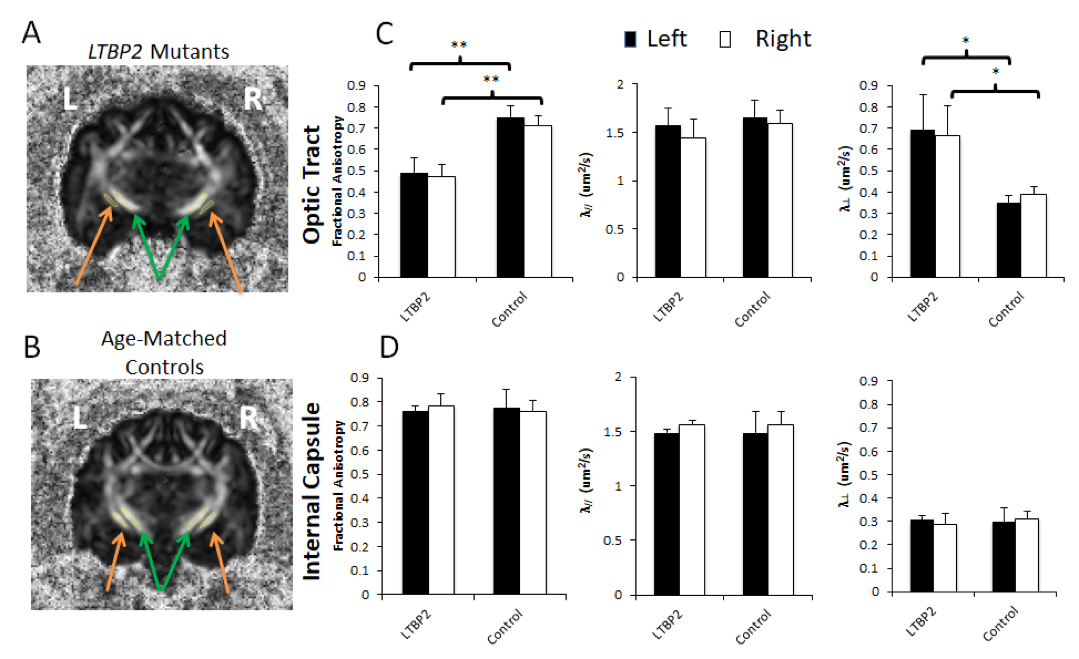
Quantitative comparisons of the feline glaucoma model in Figure 1 reveal that there was a significantly lower FA (p<0.01) and higher λ┴ (p<0.05) in the optic tracts of the LTBP2 mutants compared to age-matched controls (p<0.05). No apparent difference was observed in λ// in the optic tracts between experimental and control groups.The internal capsule, which served as an internal control of non-visual pathway, also showed no apparent difference confirming that the observed DTI changes were confined to the visual pathway.
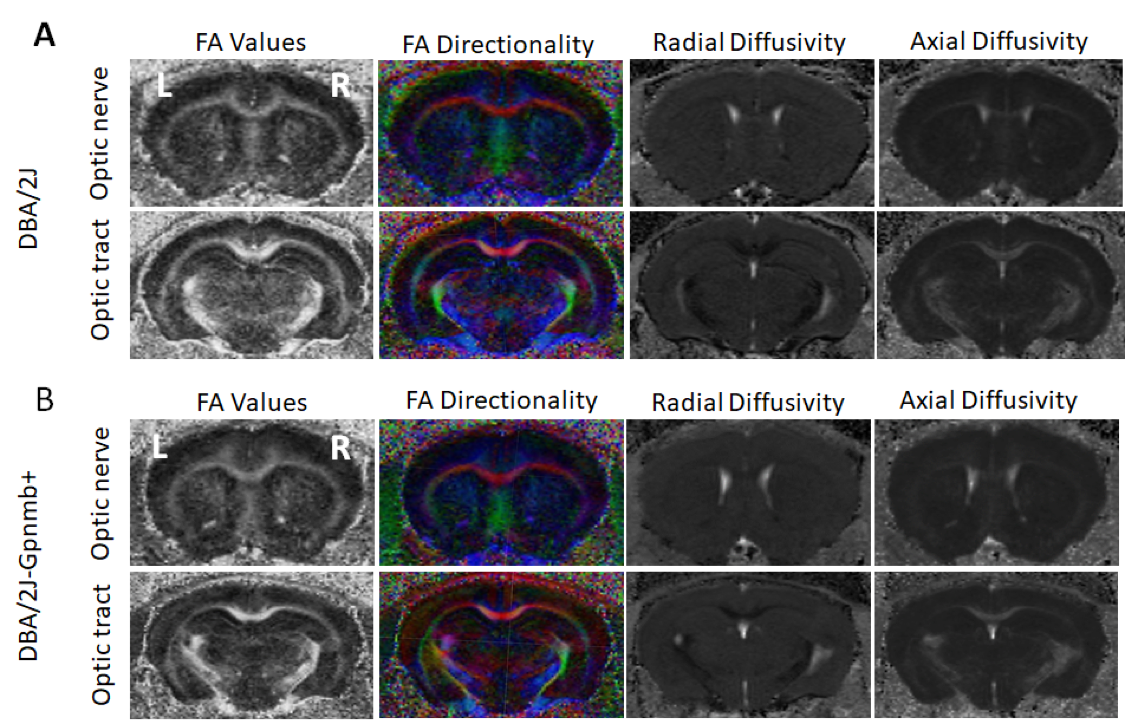
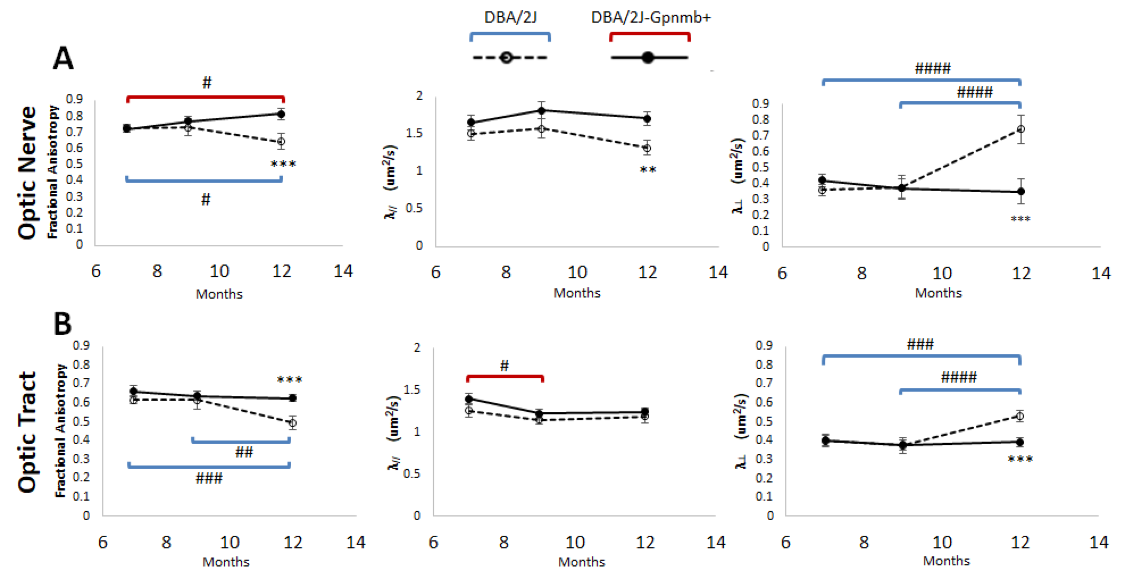
Qualitative and quantitative comparisons of the DBA/2J mouse glaucoma model in Figures 2 and 3 show a decrease in FA in both the optic nerve and optic tract of DBA/2J mice compared to normotensive, genetically-matched DBA/2J-Gpnmb+ controls, when chronic ocular hypertension occurred mostly between 9 and 12 months old (p<0.001). Lower λ// was also observed in the optic nerve of DBA/2J mice compared to DBA/2J-Gpnmb+ mice at 12 months old (p<0.01). There is also an increase in λ┴in the optic nerve and optic tract of the DBA/2J strain compared to control, that also shows the greatest change between 9 and 12 months old (p<0.001). λ// in the optic nerve show significant differences between groups at 12 months old (p<0.01). Similar DTI parametric changes are observed in the optic tracts, with significant decrease in FA in the DBA/2J mice occurring mostly between 9 and 12 months old (p<0.01).
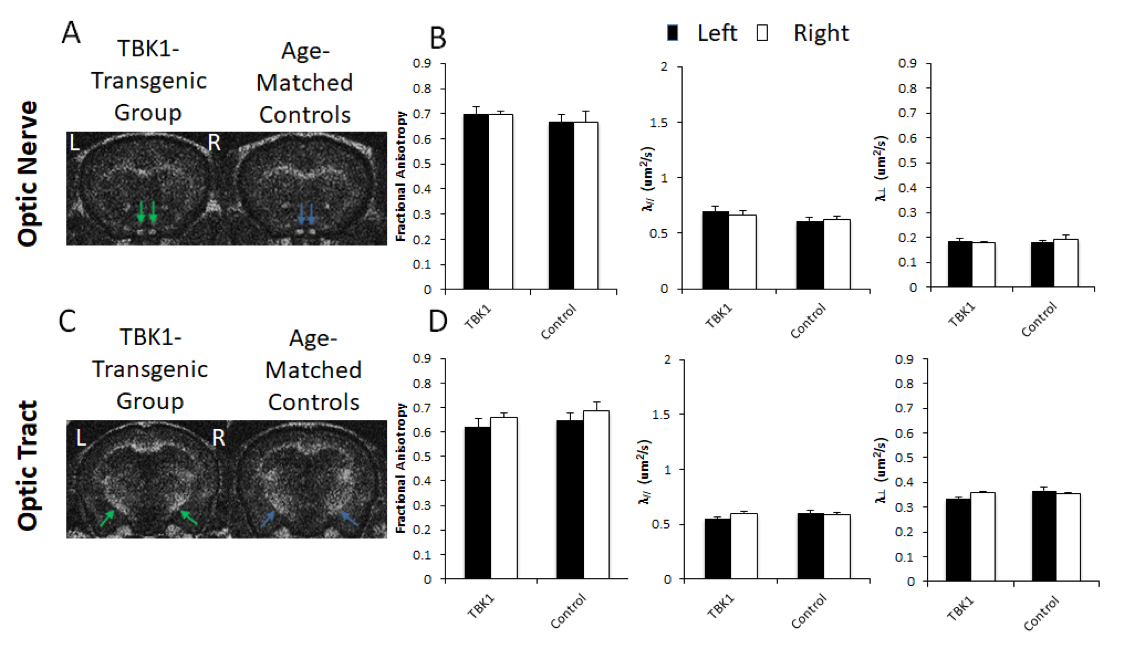
Figure 4 reveals that no apparent difference in FA, λ//, or λ┴between the transgenic TBK1 mice and wild-type littermates along the visual pathway (p>0.05).
Discussion and Conclusions
The results in the feline PCG model and DBA/2J mouse model of pigmentary glaucoma suggest that ocular hypertension due to LTBP2 mutants or melanosomal protein mutations led to structural disorganization specifically in the visual pathway. While TBK1 transgenic mice revealed no apparent DTI parametric changes, it is important to note that TBK1 mice show only a 13% retinal ganglion cell (RGC) loss at 18 months(5). However, LTBP2 cats and DBA/2J mice show decreases in RGCs of 64% and 44%, respectively in the later disease stages (3,4). Future studies will examine the relationships between RGC loss and structural integrity of the RGC axons in the brain’s visual pathway as well as their functional relevance.
In conclusion, DTI of various experimental animal models provided a non-invasive modality to assess the effects of genetic risk factors for glaucoma on the structural integrity of the visual pathway, and may provide insights into the mechanisms underlying human glaucoma and for evaluating novel neuropreservative therapies.
Acknowledgements
This work was supported in part by the National Institutes of Health R01-EY028125 (Bethesda, Maryland); BrightFocus Foundation G2013077 and G2016030 (Clarksburg, Maryland); and Research to Prevent Blindness/Stavros Niarchos Foundation International Research Collaborators Award (New York, New York)References
1. Kingman S. Glaucoma is second leading cause of blindness globally. Bull World Health Organ 2004;82(11):887-888.
2. Alm A. How much is the brain involved in glaucoma? Br J Ophthalmol 2006;90(6):663-664.
3. Kuehn MH, Lipsett KA, Menotti-Raymond M, et al. A Mutation in LTBP2 Causes Congenital Glaucoma in Domestic Cats (Felis catus). PLoS One 2016;11(5):e0154412.
4. Hirt J, Porter K, Dixon A, McKinnon S, Liton PB. Contribution of autophagy to ocular hypertension and neurodegeneration in the DBA/2J spontaneous glaucoma mouse model. Cell Death Discov 2018;5:14.
5. Fingert JH, Miller K, Hedberg-Buenz A, et al. Transgenic TBK1 mice have features of normal tension glaucoma. Hum Mol Genet 2017;26(1):124-132.
Figures