1132
Detection of γ-glutamyl-transferase activity up-regulation in orthotopic glioma using hyperpolarized γ-glutamyl-[1-13C]glycine1Radiology and Biomedical Imaging, UCSF, San Francisco, CA, United States, 2Chemistry and Biotechnology, University of Tokyo, Tokyo, Japan, 3Laboratory of functional and metabolic imaging, EPFL, Lausanne, Switzerland
Synopsis
γ-glutamyl-transferase (GGT) is a key enzyme in the γ-glutamyl cycle, which regulates glutathione homeostasis. Previous studies reported that the enzyme is upregulated in many human malignancies including glioblastoma, but remains low in normal brain. Here, we demonstrate the potential of hyperpolarized γ-glutamyl-[1-13C]glycine as a probe for GGT activity in the brain by demonstrating that its conversion to [1-13C]glycine is significantly higher in animals with orthotopic glioblastoma tumors when compared to healthy animal brains.
Introduction
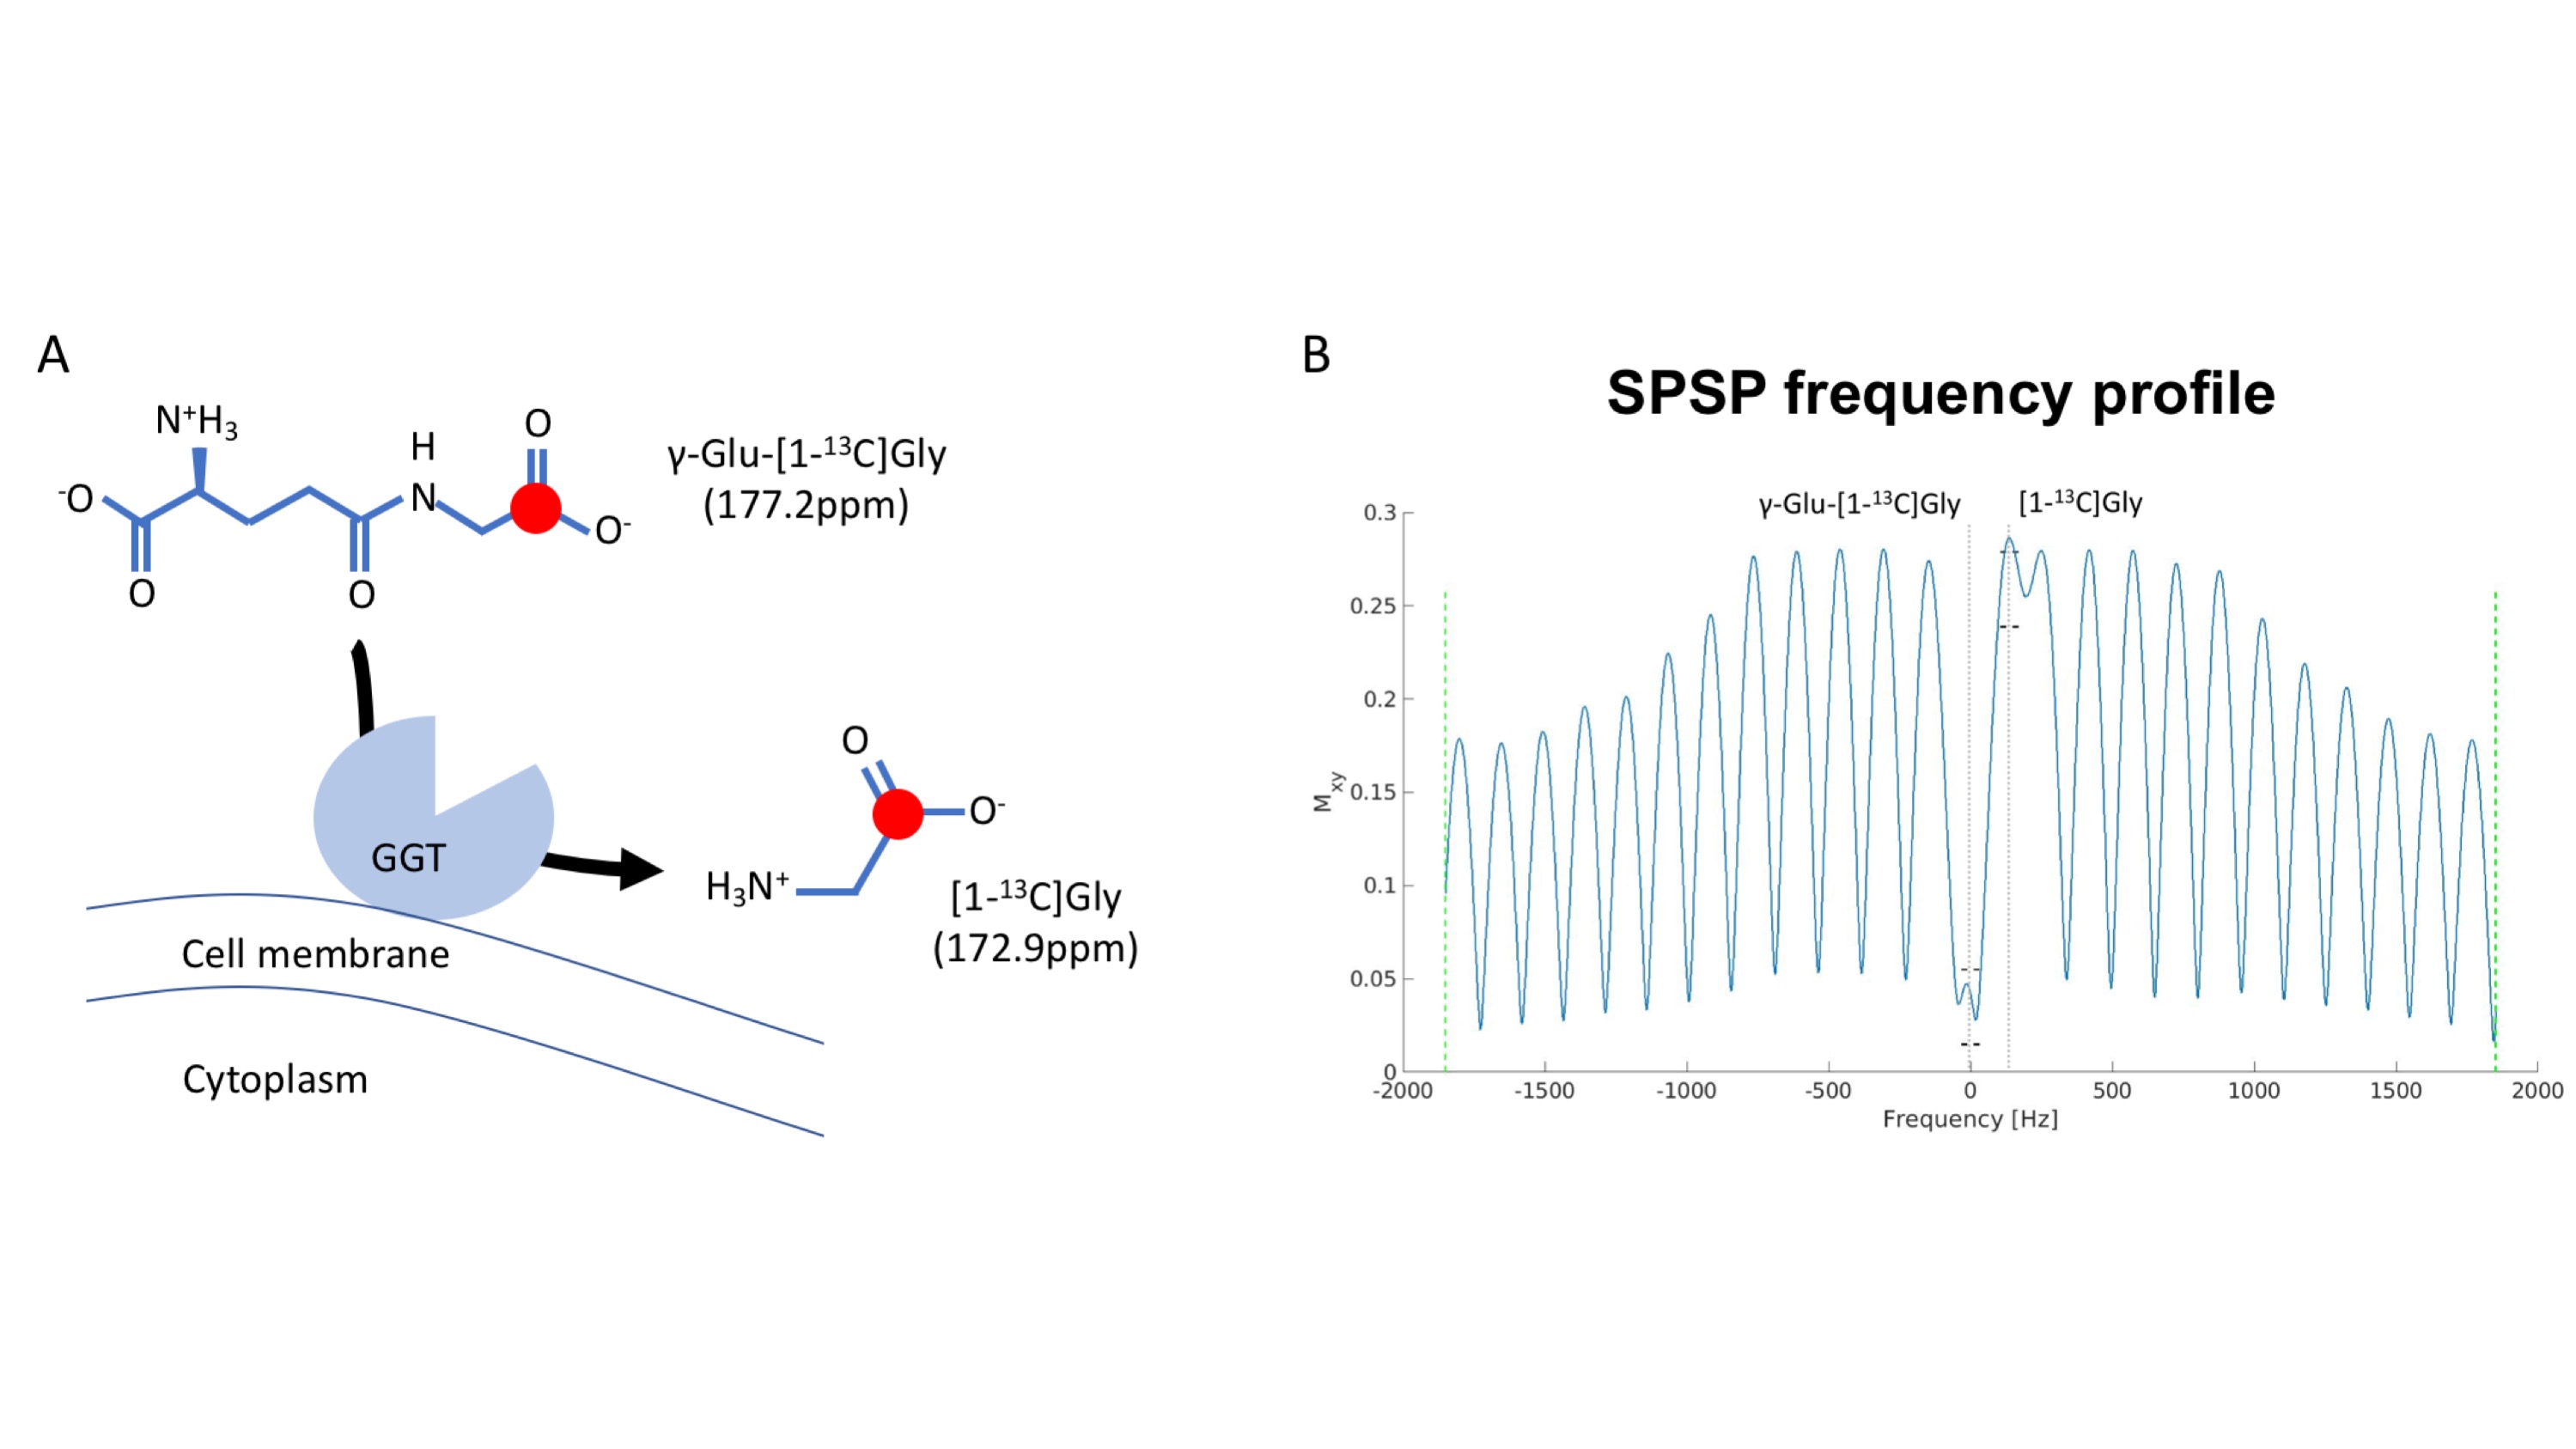
γ-glutamyl-transferase (GGT) is a key enzyme in the γ-glutamyl cycle, which regulates glutathione homeostasis1. The enzyme, localized on the outer cell membrane, catalyzes the extracellular conversion of reduced glutathione to cysteine and glycine (Fig.1A) and thus maintains cysteine levels for intracellular synthesis of glutathione, the major thiol anti-oxidant. Previous studies reported that the enzyme is upregulated in many human malignancies, particularly glioblastoma2, but remains low in normal brain. Increased GGT expression supports tumor progression by maintaining elevated levels of intracellular glutathione, and has also been correlated with drug resistance3. In a recent study, γ-glutamyl-[1-13C]glycine (γ-Glu-[1-13C]Gly) was reported as a new hyperpolarized agent to probe GGT activity4. The sufficiently long T1 values of both substrate and product (30s and 45s respectively at 9.4T) and adequate chemical shift difference (4.3ppm at physiological pH) enabled monitoring metabolism in vivo and in a subcutaneous ovarian carcinoma xenograft model4,5. However, the ability of hyperpolarized γ-Glu-[1-13C]Gly to monitor redox in an orthotopic glioblastoma model has not yet been evaluated. As the enzyme is specifically over-expressed in glioblastomas and not in healthy brain, it is an attractive molecular biomarker for monitoring redox in glioblastoma. The goal of our study was to assess the value of hyperpolarized γ-glutamyl-[1-13C]glycine in glioblastoma-bearing rats.Methods
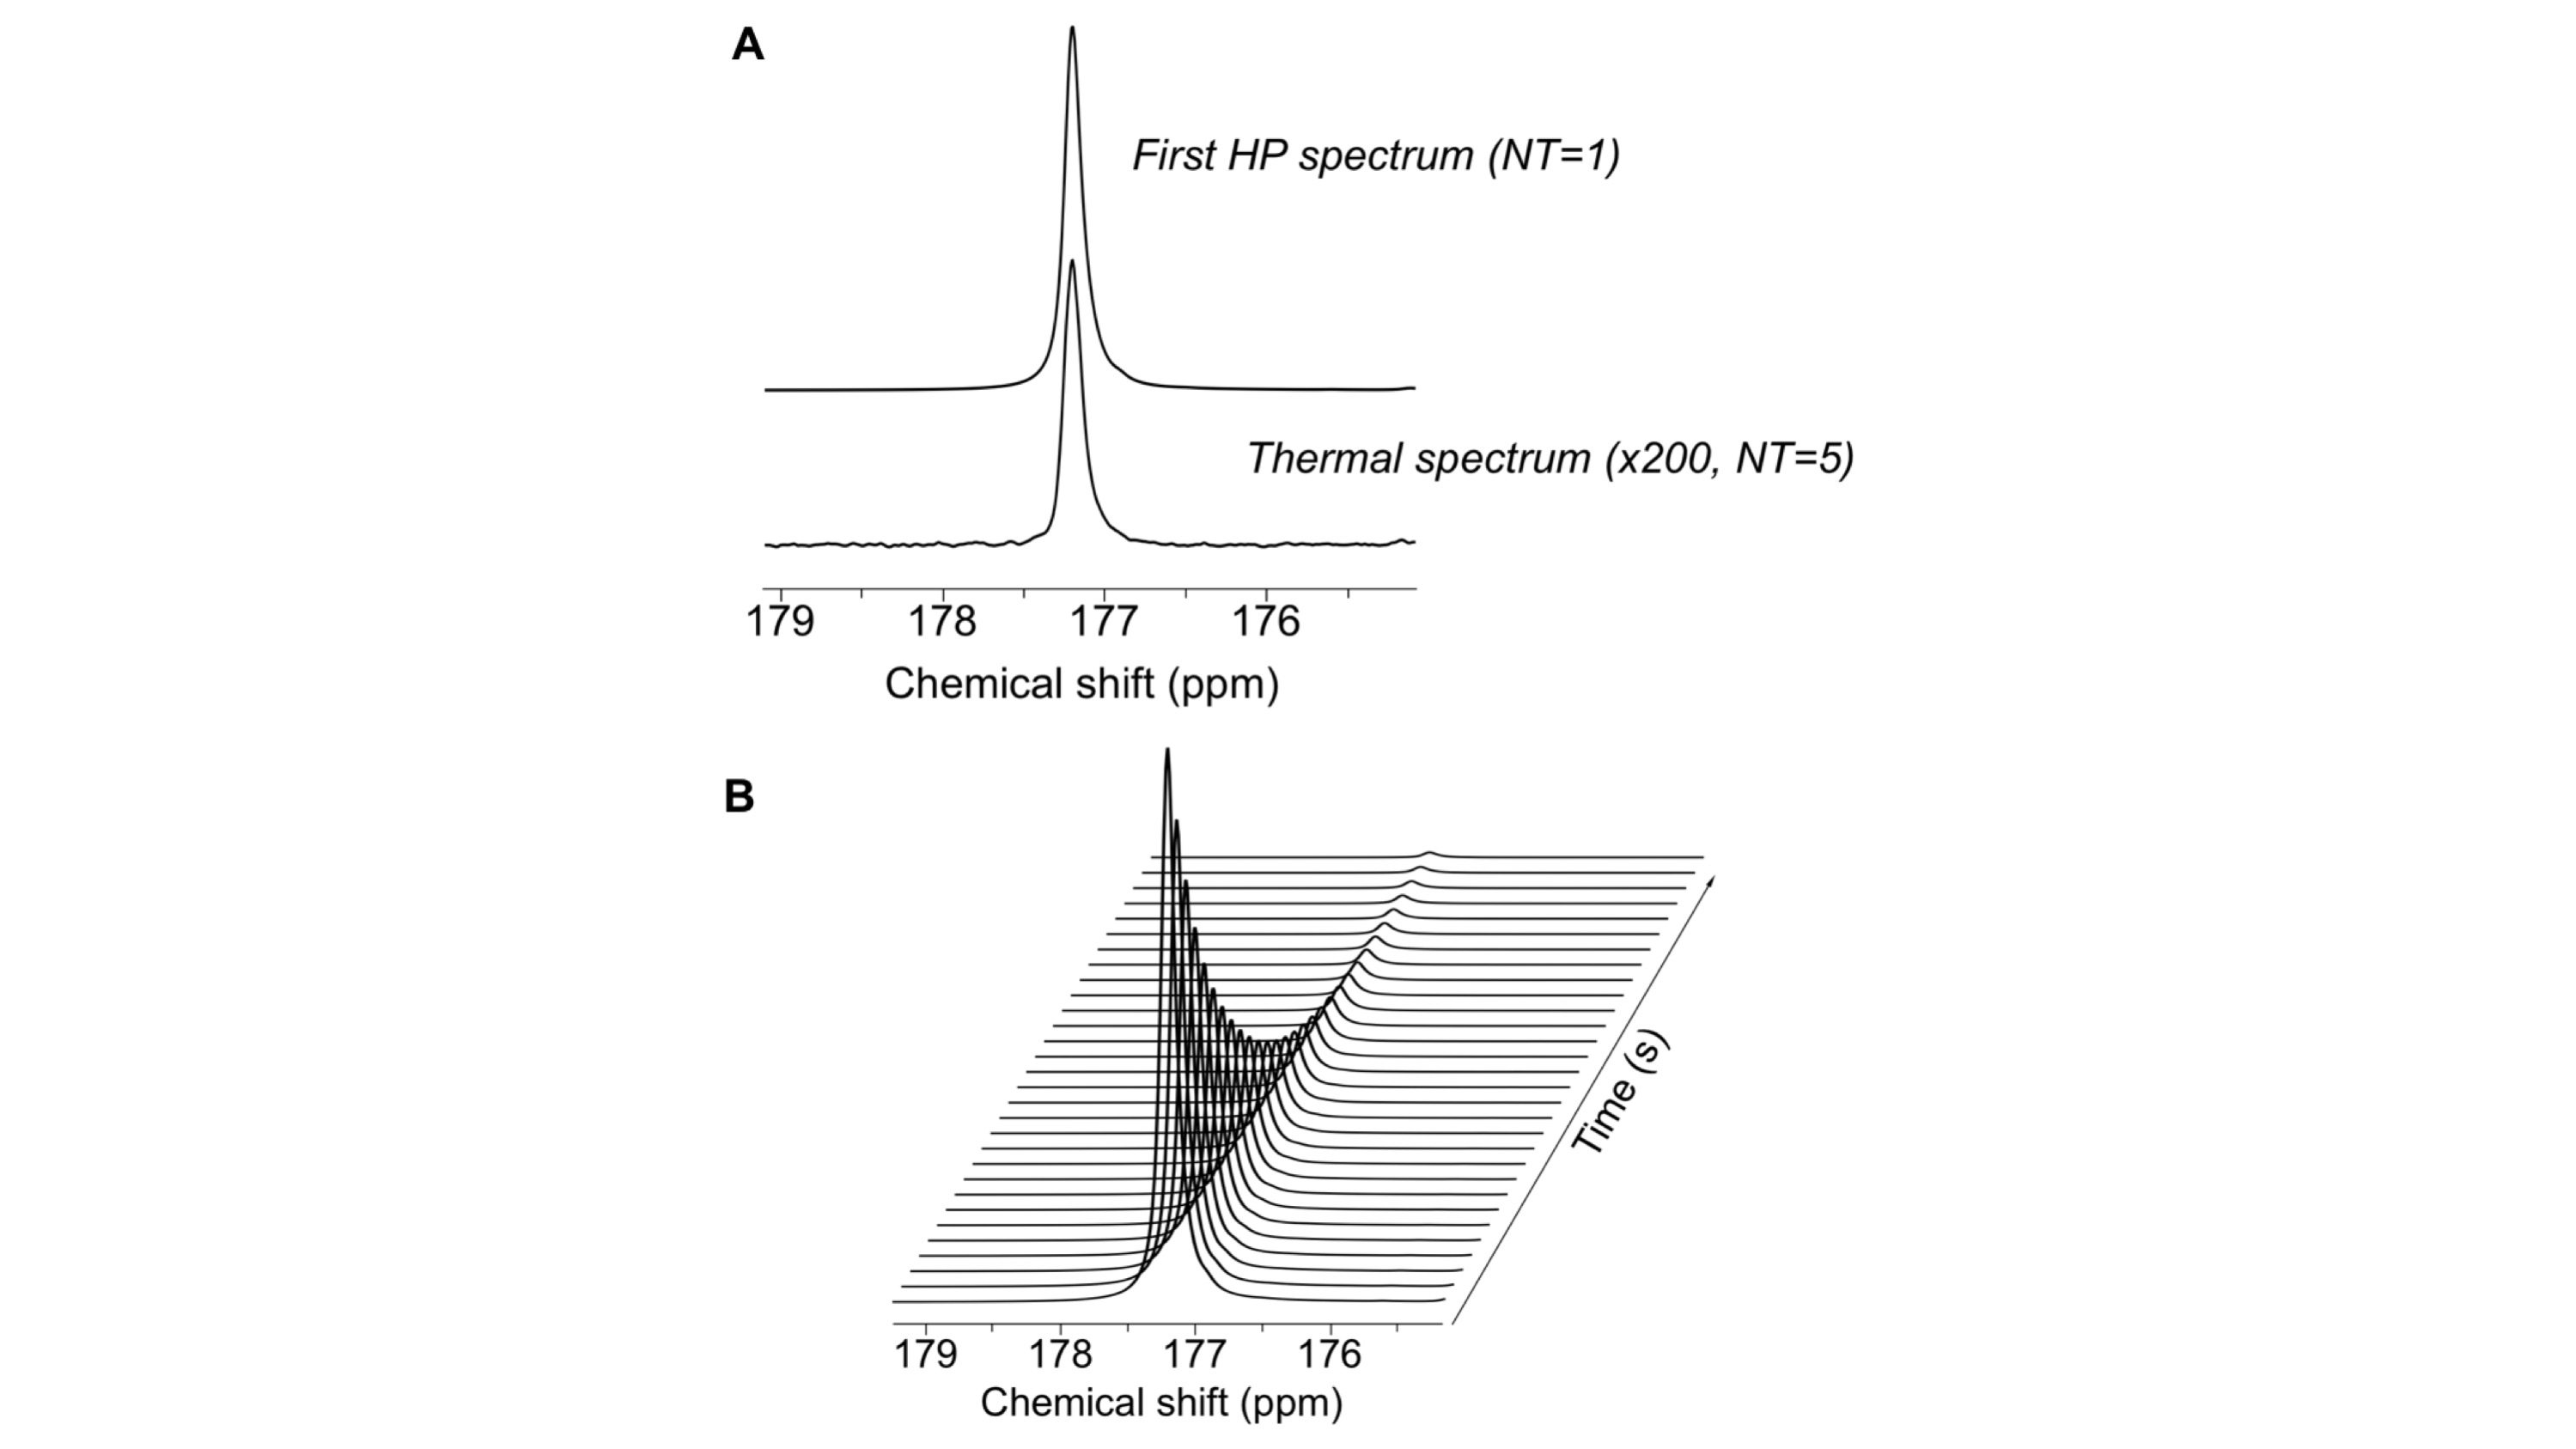
Hyperpolarized γ-Glu-[1-13C]Gly: γ-Glu-[1-13C]Gly was synthesized as previously described4,6. γ-Glu-[1-13C]Gly (2.9M) was dissolved in 6.7M NaOH solution and mixed with 21mM OX-63 and 9.5μl glycerol. After polarization and dissolution, hyperpolarized γ-Glu-[1-13C]Gly was rapidly transferred to an NMR tube or a 3mL syringe and T1 was measured at 1.5T (n=1, TR=5s/FA=10°, Oxford Instruments), at 3T (n=2, TR=3s/FA=10°, Biospec, Bruker) and at 11.7T (n=1, TR=3s/FA=13°, INOVA, Agilent Technologies). Percent polarization was also quantified at 11.7T (n=1, TR=300s/FA=90°/NR=5). Spectra were processed by peak integration using MestReNova (Mestrelab).
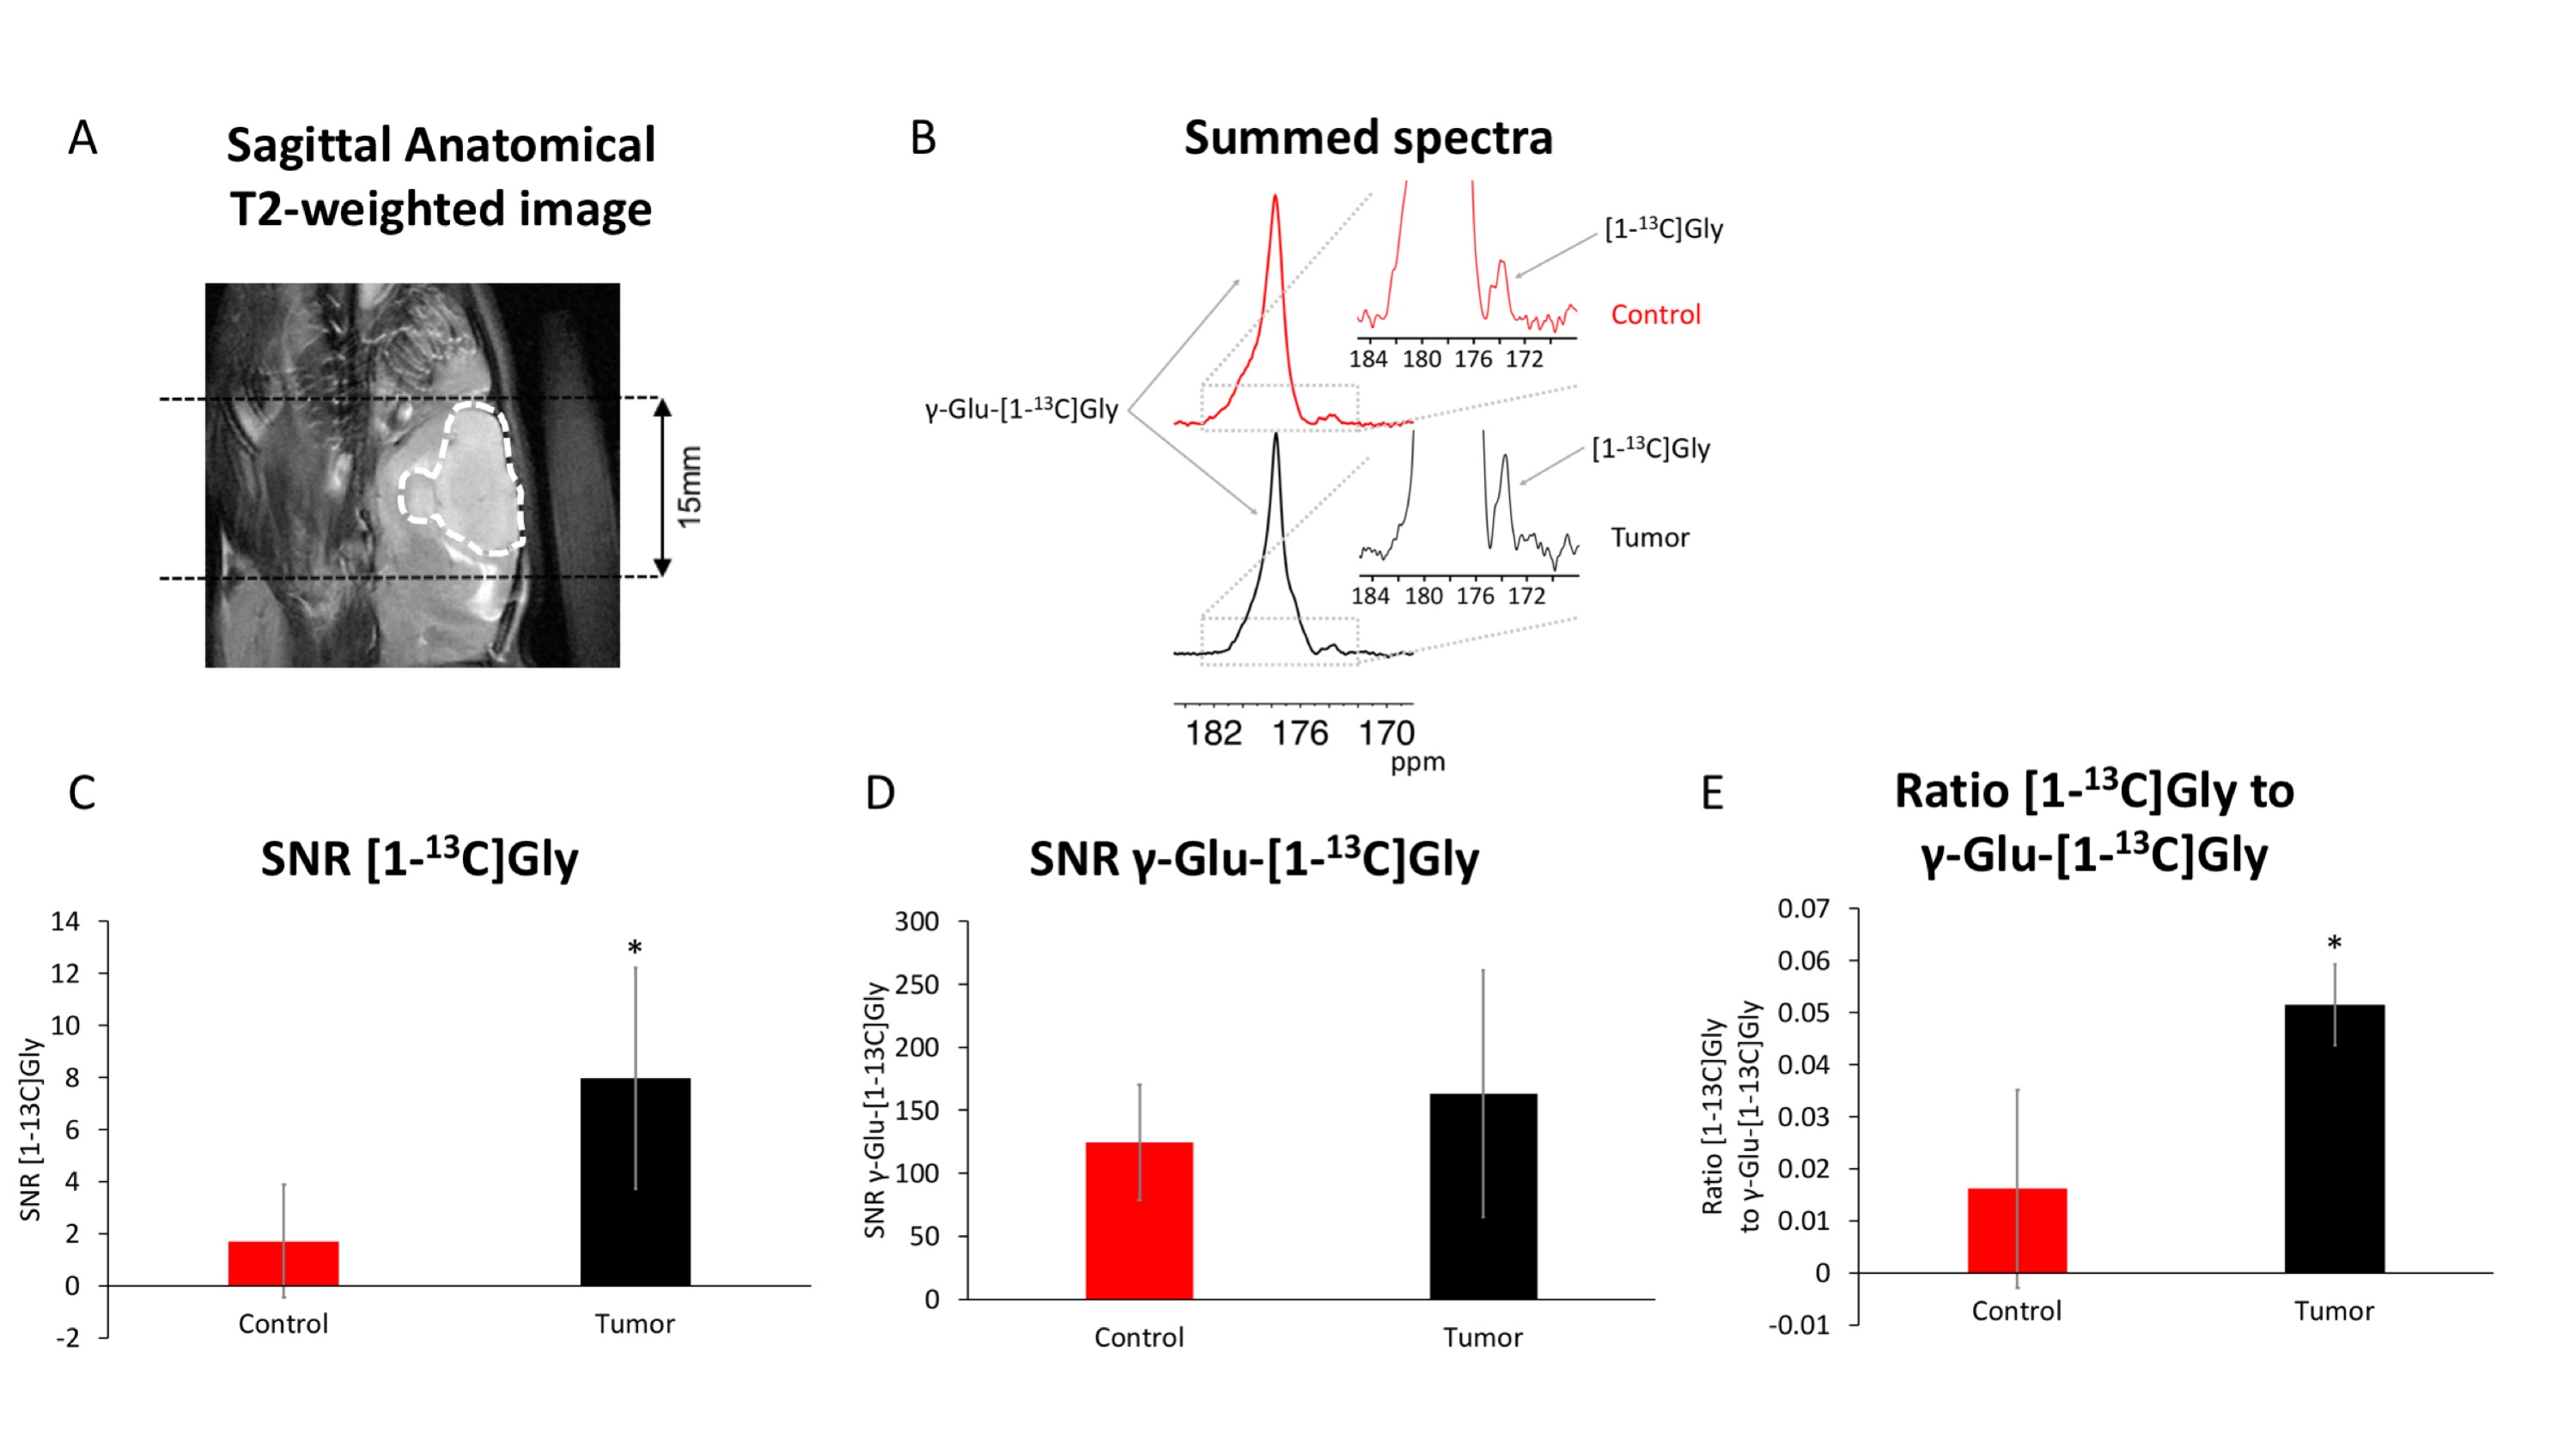
Animal Studies: 9 male athymic nu/nu rats were used. U87 glioblastoma cells (3x10⁵) were implanted intracranially as previously described in 5 rats7. 4 rats served as age matched tumor free controls. All measurements were performed on a 3T horizontal 105mm bore MR system (BioSpec, Bruker) equipped with a dual-tuned 1H-13C volume coil. Axial T2-weighted images were recorded using a spin echo sequence (TurboRARE) (TE/TR=64/3484ms, FOV=35x35mm, matrix=256x256, slice thickness=1mm, NA=10) and used to monitor tumor location and size. For hyperpolarized studies 2.2mL of HP γ-Glu-[1-13C]Gly was injected (pH=7) via a tail-vein-catheter over 15s. 12s after the beginning of the injection, dynamic 13C MR spectra (TR=3s/NR=16) were acquired from a 15mm slab using a flyback spectral-spatial pulse (SPSP; Fig.1B) with 30° excitation on product ([1-13C]Gly) and 4° on substrate (γ-Glu-[1-13C]Gly). The dynamic data were summed over time and analyzed by measuring the γ-Glu-[1-13C]Gly and [1-13C]Gly signal-to-noise (SNR) ratios using MestReNova.
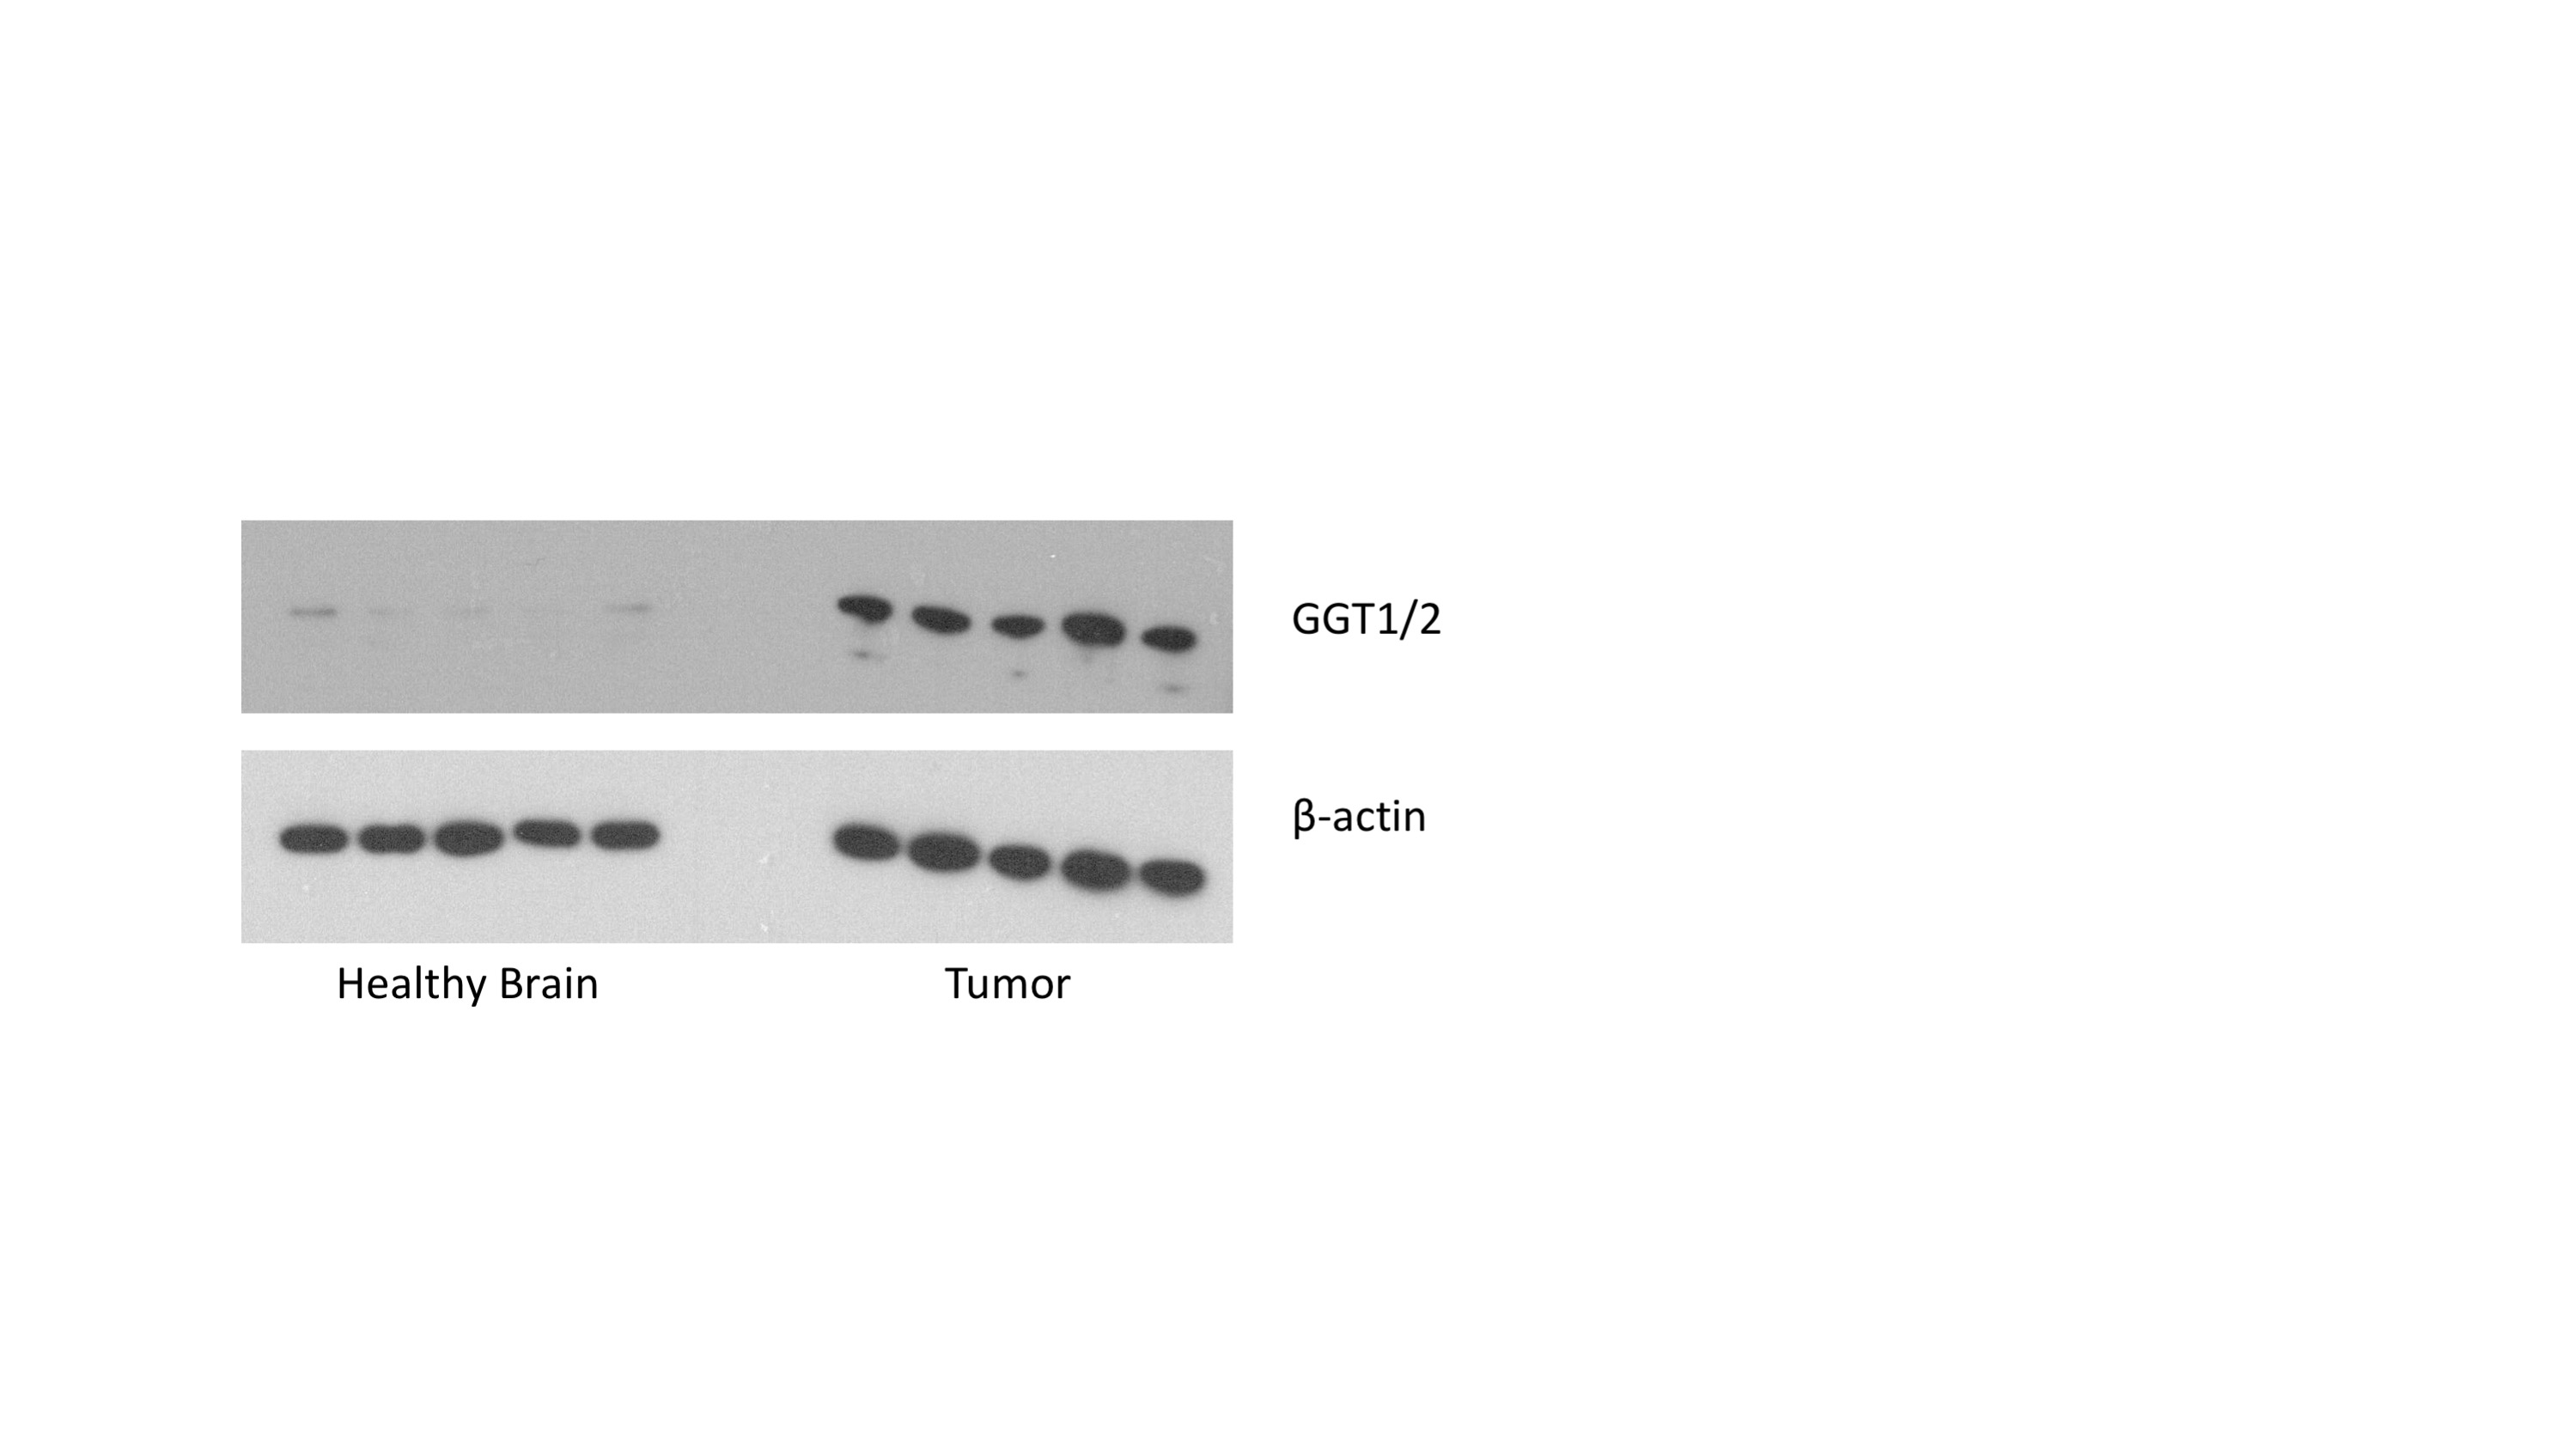
Immunoblotting: γ-glutamyl-transferase 1 and 2 (GGT1/2) levels in tumor and contralateral healthy brain tissue samples were evaluated using western blotting with β-actin as loading control.
Statistical analysis: All results are expressed as mean±STD. Statistical significance was assessed using an unpaired two-tailed student’s t-test with p<0.05 considered significant.
Results and Discussion
Polarization level and T1: Following dissolution, the resonance of γ-Glu-[1-13C]Gly was detected at 177.5ppm with an enhancement (back calculated to time of dissolution) of 17% when compared to thermal spectrum (Fig.2). Consistent with previously published values4, the T1 of HP γ-Glu-[1-13C]Gly was 33±3.5s (at 3T) and showed a slight magnetic field dependence (T1 of 28s and 21.5s at 1.5T and 11.7T respectively).
GBM studies: HP acquisitions were performed on tumor-bearing animals when tumors reached a volume of ~0.25±0.1cm3 (Fig.3A). Summed spectra from dynamic acquisitions in control animals showed low or below detection signal of [1-13C]Gly, whereas [1-13C]Gly was readily detected in all tumor-bearing animals (Fig.3B,C). Comparison of control and tumor-bearing rats showed no statistically significant difference in the SNR of the substrate (HP γ-Glu-[1-13C]Gly; Fig.3D). Consistent with the higher levels of HP [1-13C]Gly production in tumor relative to normal brain, the [1-13C]Gly-to-γ-Glu-[1-13C]Gly ratio was significantly higher in tumor-bearing animals relative to controls (p=0.04; Fig.3E).
Immunoblotting: Western blots of healthy brain tissue showed low expression of γ-glutamyl-transferase 1 and 2 (GGT1/2) compared to glioma tumor (Fig.4) indicating that our hyperpolarized finding of higher [1-13C]Gly production in tumor likely reflects the observed difference in GGT1/2 expression.
Conclusion
Further studies are needed to assess the generality of our findings. Nonetheless, for the first time, this study demonstrates the feasibility of using γ-Glu-[1-13C]Gly to monitor GGT activity metabolism in an orthotopic glioblastoma model.Acknowledgements
Work supported by NIH R01CA172845, NIH R01CA197254, ABTA BRF1700006, UCSF LOGLIO collective, NICO project and P41EB013598.References
1Corti A. et al., Gamma-glutamyltransferase of Cancer Cells at the Crossroads of Tumor Progression, Drug Resistance and Drug Targeting, Anticancer Research (2010) 30: 1169-1182
2Schäfer C. et al., Gamma-Glutamyl Transferase Expression in Higher-grade Astrocytic Glioma, Acta Oncologica (2001) 40: 529–535
3Hanigan MH, Gamma-Glutamyl Transpeptidase: Redox Regulation and Drug Resistance, Adv. Cancer Res. (2014) 122: 103–141
4Nishihara T. et al. , Direct Monitoring of g-Glutamyl Transpeptidase Activity In Vivo Using a Hyperpolarized 13C-Labeled Molecular Probe, Angew. Chem. Int. Ed. (2016) 55: 10626 –10629
5Seki T et al., Application of a novel 13C hyperpolarized metabolic tracer for γ-Glutamyl transferase activity in vivo tumor xenograft, Proc. ISMRM (2018) #3052
6Nishihara T. et al., A Strategy to Design Hyperpolarized 13C Magnetic Resonance Probes Using [1-13C]a-Amino Acid as a Scaffold Structure, Chem. Asian J. (2017) 12: 949 – 953
7Chaumeil MM et al., Non-invasive in vivo assessment of IDH1 mutational status in glioma, Nature Communications (2013)
Figures