1079
Prediction of Ischemic Placental Disease during Early Gestation using Pseudo-Continuous Arterial Spin Labeling MRI1Radiological Sciences, University of California, Los Angeles, Los Angeles, CA, United States, 2Mark & Mary Stevens Neuroimaging and Informatics Institute, University of Southern California, Los Angeles, CA, United States, 3Department of Pediatrics, University of California, Los Angeles, Los Angeles, CA, United States, 4Department of Obstetrics and Gynecology, University of California, Los Angeles, Los Angeles, CA, United States
Synopsis
A real-time and non-invasive way to assess placental development would have great potential to help diagnose various conditions of placental insufficiency. Arterial spin labeling (ASL) MRI has great potential to serve as
Purpose
To assess associations between high-perfusion related imaging parameters and pregnancy outcomes with volumetric placental perfusion measurements using pseudo-continuous arterial spin labeling (pCASL) MRI.Methods
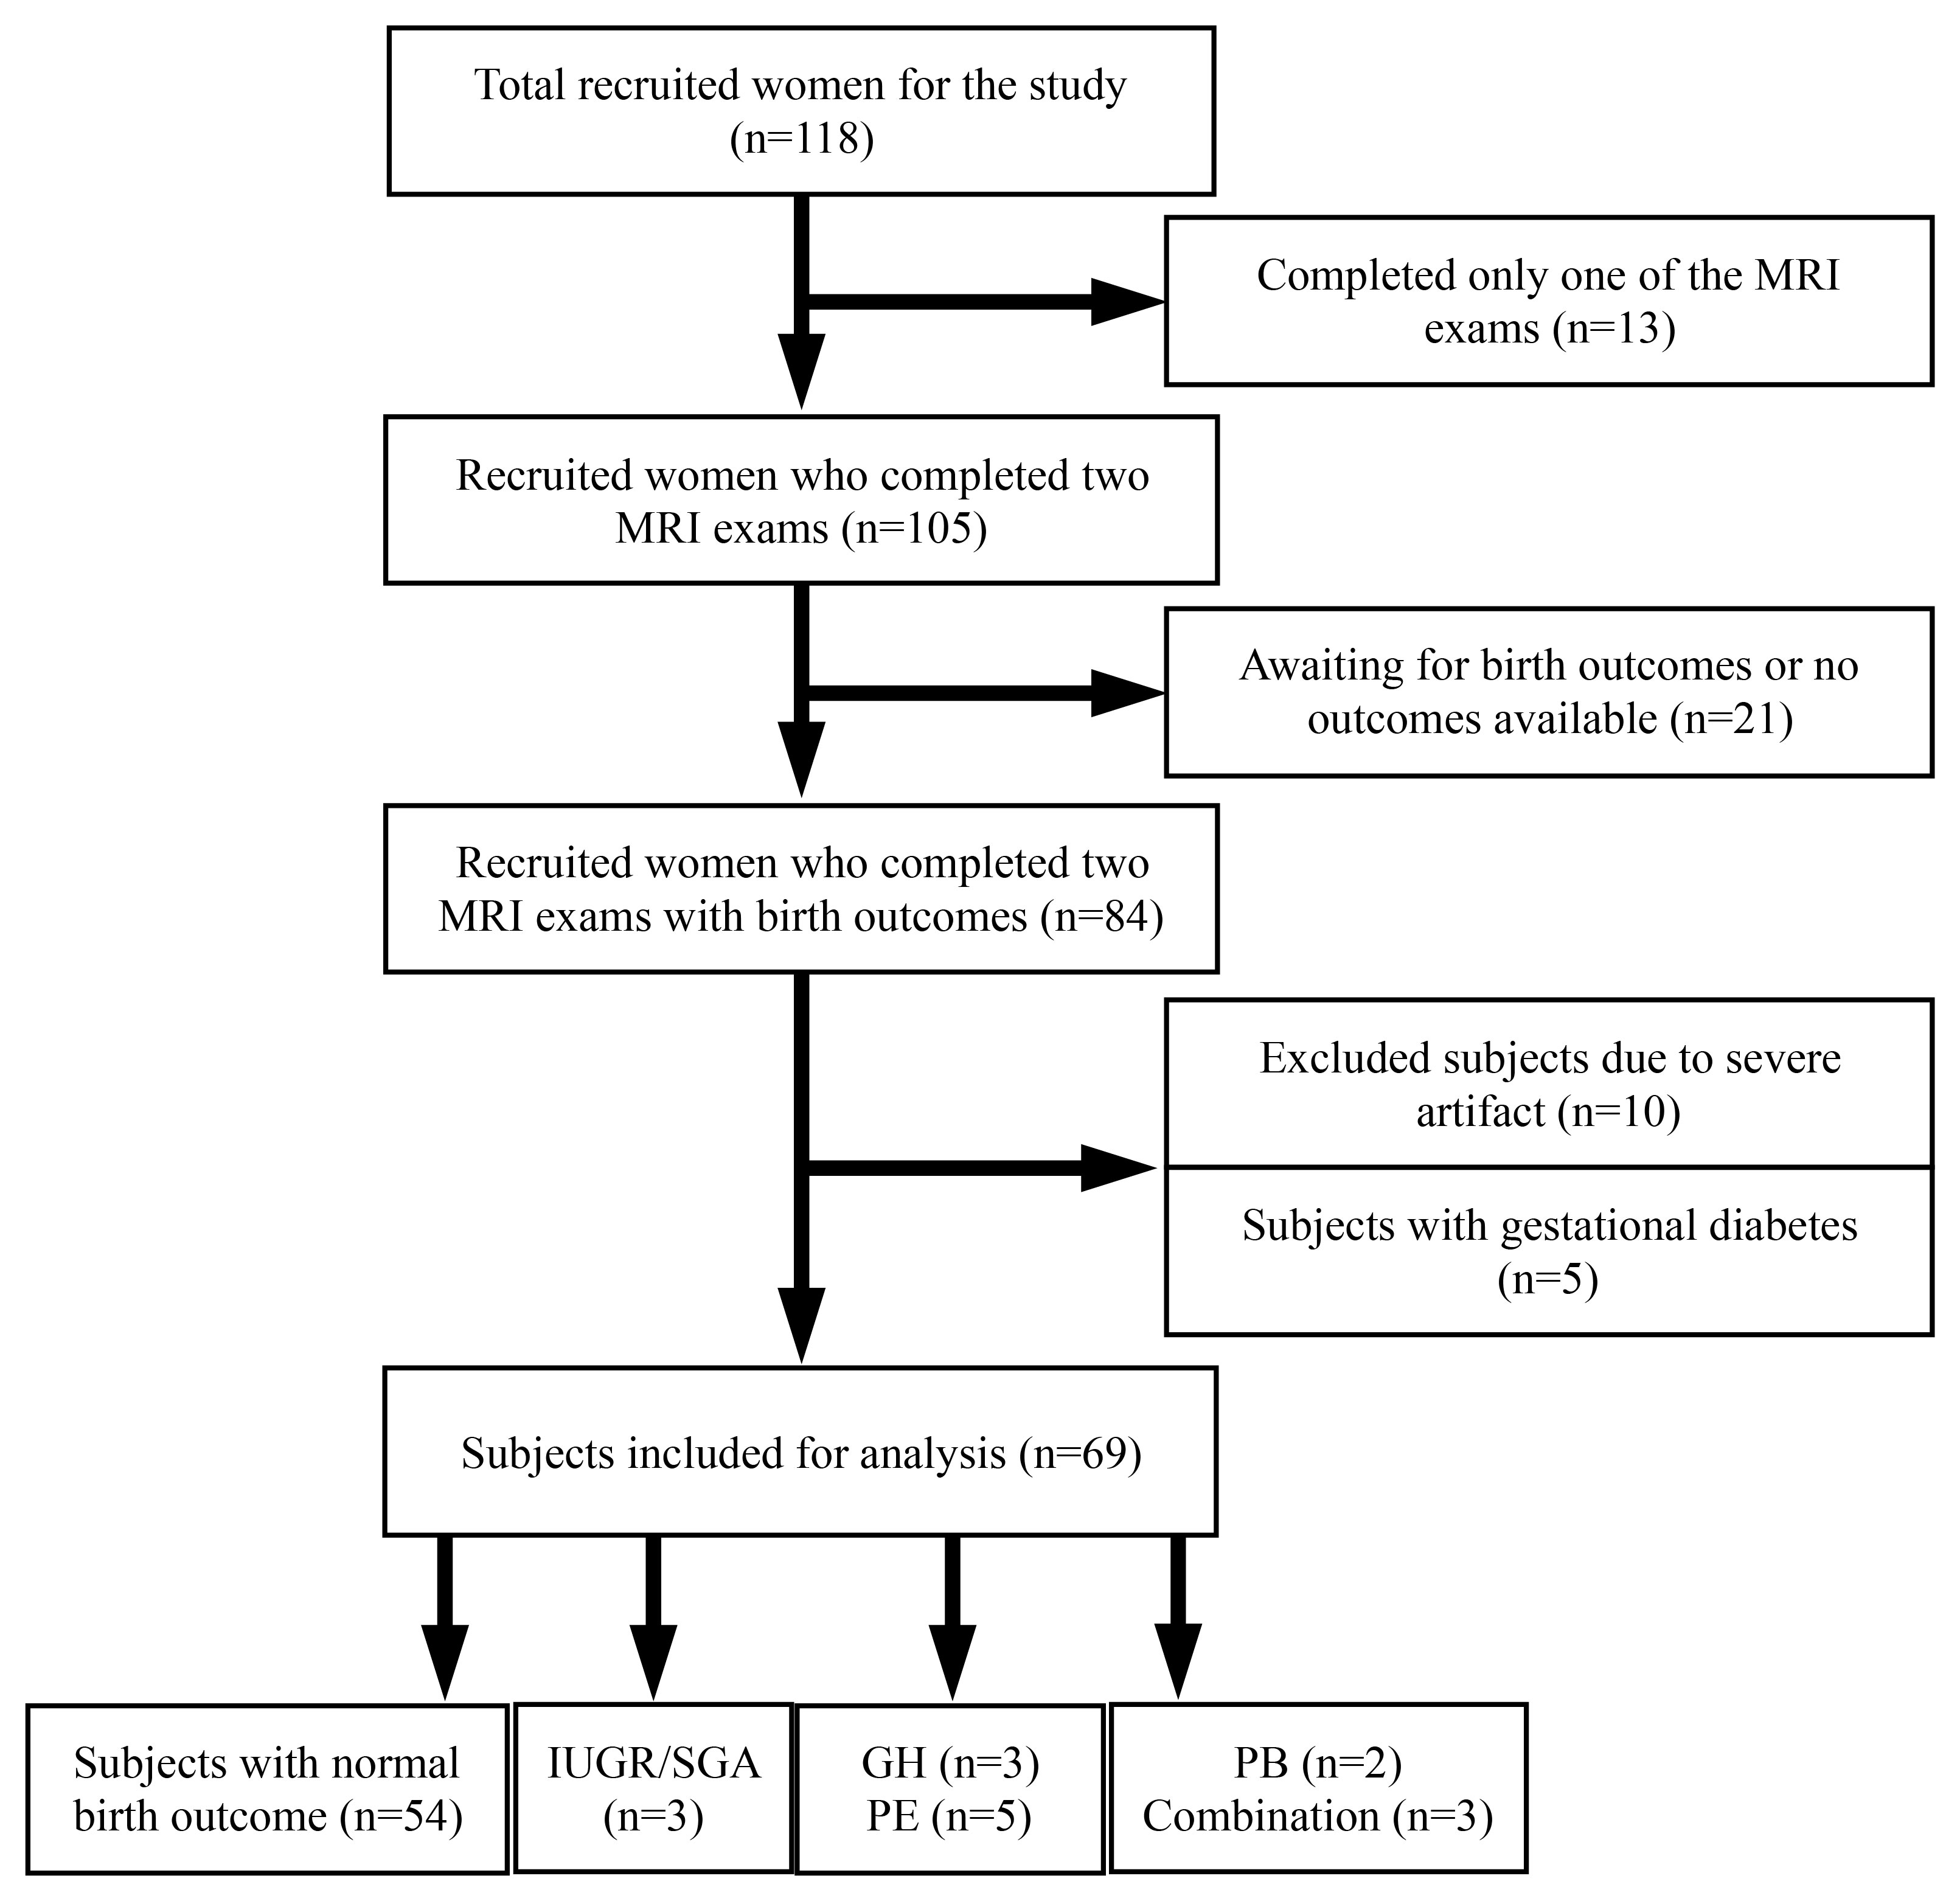
A total of 118 women were recruited at antenatal clinics for the study to undergo two longitudinal pCASL MRI exams (first; 14-18 weeks and second; 19-24 weeks). At the time of birth, clinical information inclusive of maternal and neonatal outcomes were reviewed to assess the primary outcome, namely the ischemic placental disease (IPD). We defined IPD as women diagnosed with gestational hypertension (GH), preeclampsia (PE), or bearing intrauterine growth restriction (IUGR) / small for gestational age (SGA), preterm birth (PB), or a combination of these conditions by the American College of Obstetrics and Gynecology (ACOG) [1]. After excluding 49 subjects, a total number of 69 subjects were included for the analysis of which 15 developed IPD, including three GH, five PE, three IUGR/SGA, two PB, and two a combination of these conditions, as described in Fig 1.
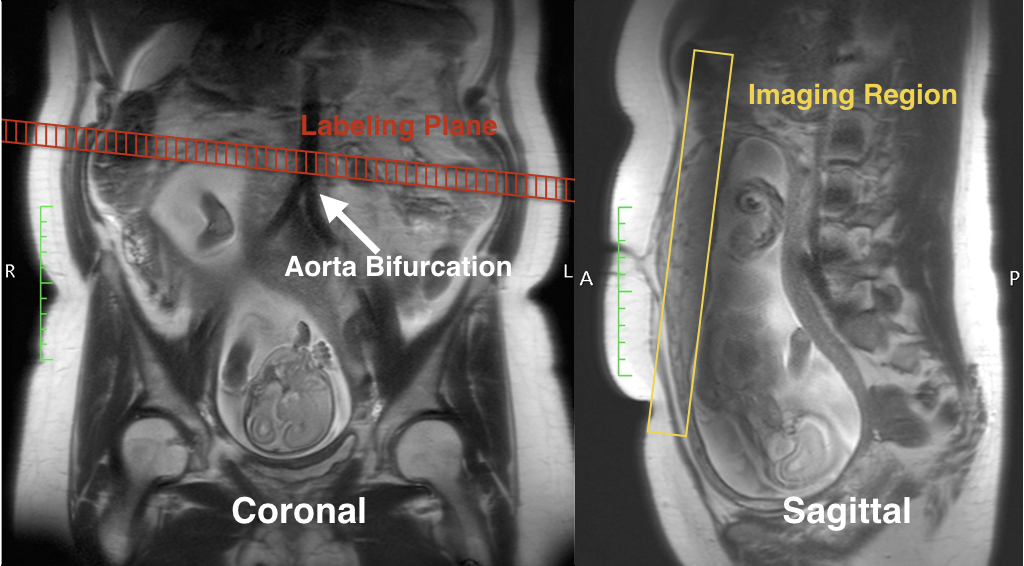
All experiments were performed on two Siemens 3T MRI scanners (Skyra and Prisma; Siemens Healthcare) using a phased-array body coil. All subjects underwent MRI exams in a feet-first, supine position and were breathing normally. Our imaging protocol included T2-weighted (T2w) MRI for anatomical references and free-breathing multi-delay pCASL with 3D GRASE readout [2] for placental blood flow (PBF) measurements, as shown in Fig. 2. As placental perfusion heterogeneity was observed, two new imaging parameters, such as high placental blood flow (hPBF) and relative hPBF, were computed to account for regional high perfusion. We applied the initial thresholding to separate high and low PBF areas by using a binary segmentation algorithm [3]. To minimize any potential bias from noise, a point-by-point signal-to-noise ratio map was computed, as the mean divided by standard error across measurements, and was applied to the initial hPBF, as described below:
$$hPBF:=\{x\in\ PBF | x > \theta ~\textit{and}~ SNR(x) > 1\}$$
where $$$\theta$$$ is the threshold. Thus, the hPBF ROI was defined as the intersection of areas of PBF greater than $$$\theta$$$ and SNR greater than 1. When no available hPBF ROI exists, the case was excluded from the hPBF calculation (five out of 69 subjects were excluded, all of whom delivered normally). The final hPBF was calculated as the mean of PBF values over the hPBF ROI. We also computed the relative contribution of the regional high perfusion, relative hPBF, by normalizing hPBF with the global placental perfusion in percentage, defined as hPBF/PBF×100%.
As each imaging parameter consists of two temporal points on a longitudinal continuum, corresponding to first and second MRI exams, we normalized the earliest temporal point to 16th weeks of gestation based on a linearity assumption. Comparisons between normal and IPD groups were performed using the unpaired Wilcoxon tests. The p-values less than 0.01 were considered highly significant.
Results
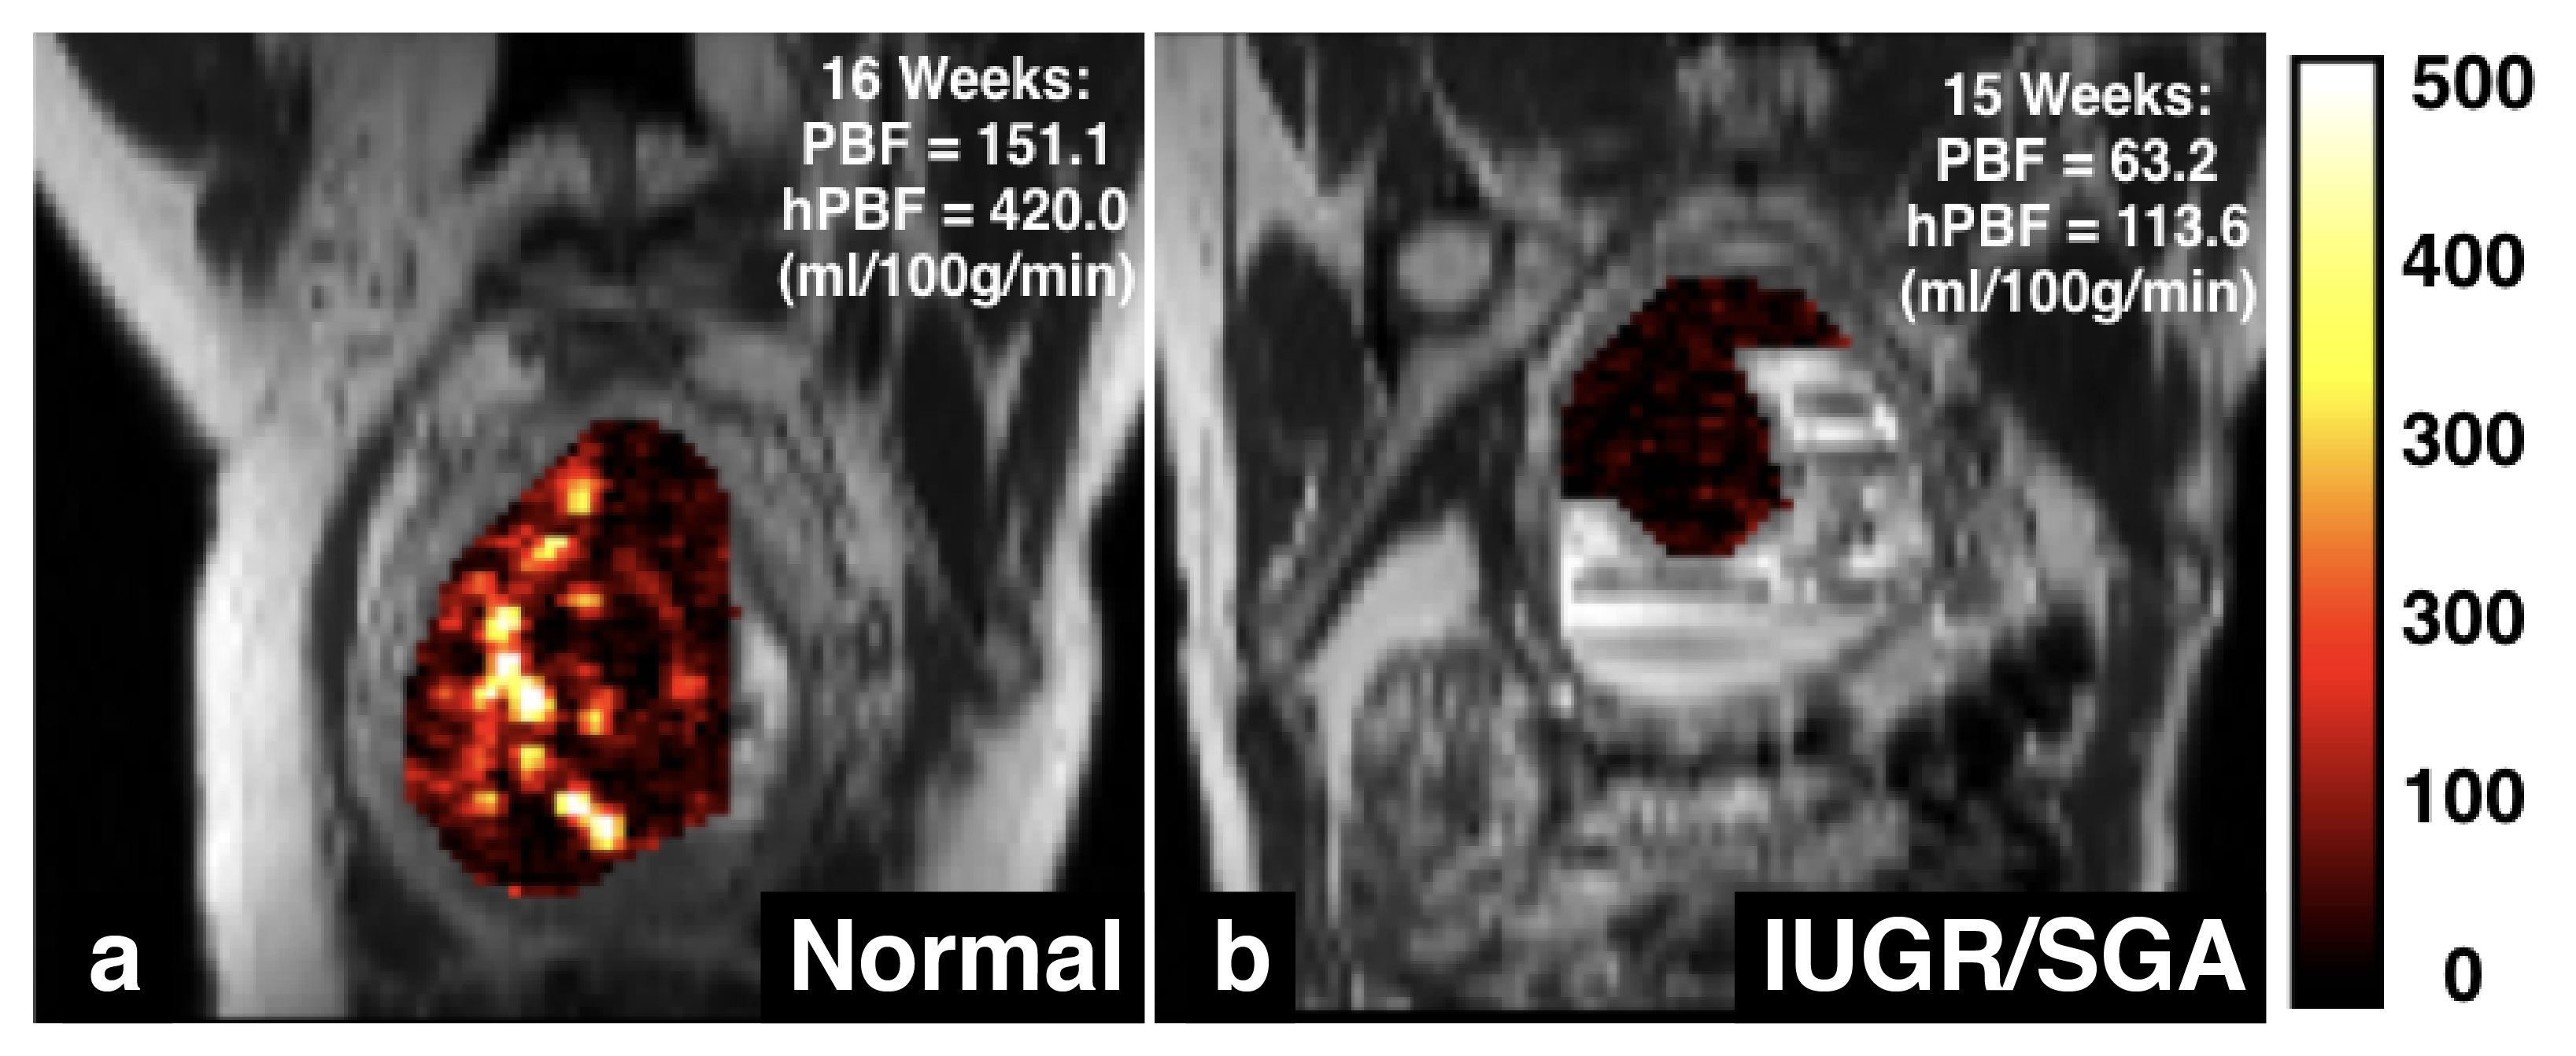
Fig. 3 shows two representative examples of PBF maps using pCASL MRI: normal and IPD (IUGR/SGA) subjects at a first MRI scan. Spatial heterogeneities of the placental perfusion can be clearly observed with scattered high perfusion areas in normal pregnancy, while low spatial heterogeneities with low perfusion were noted in the IUGR/SGA bearing subject at the first MRI scan.
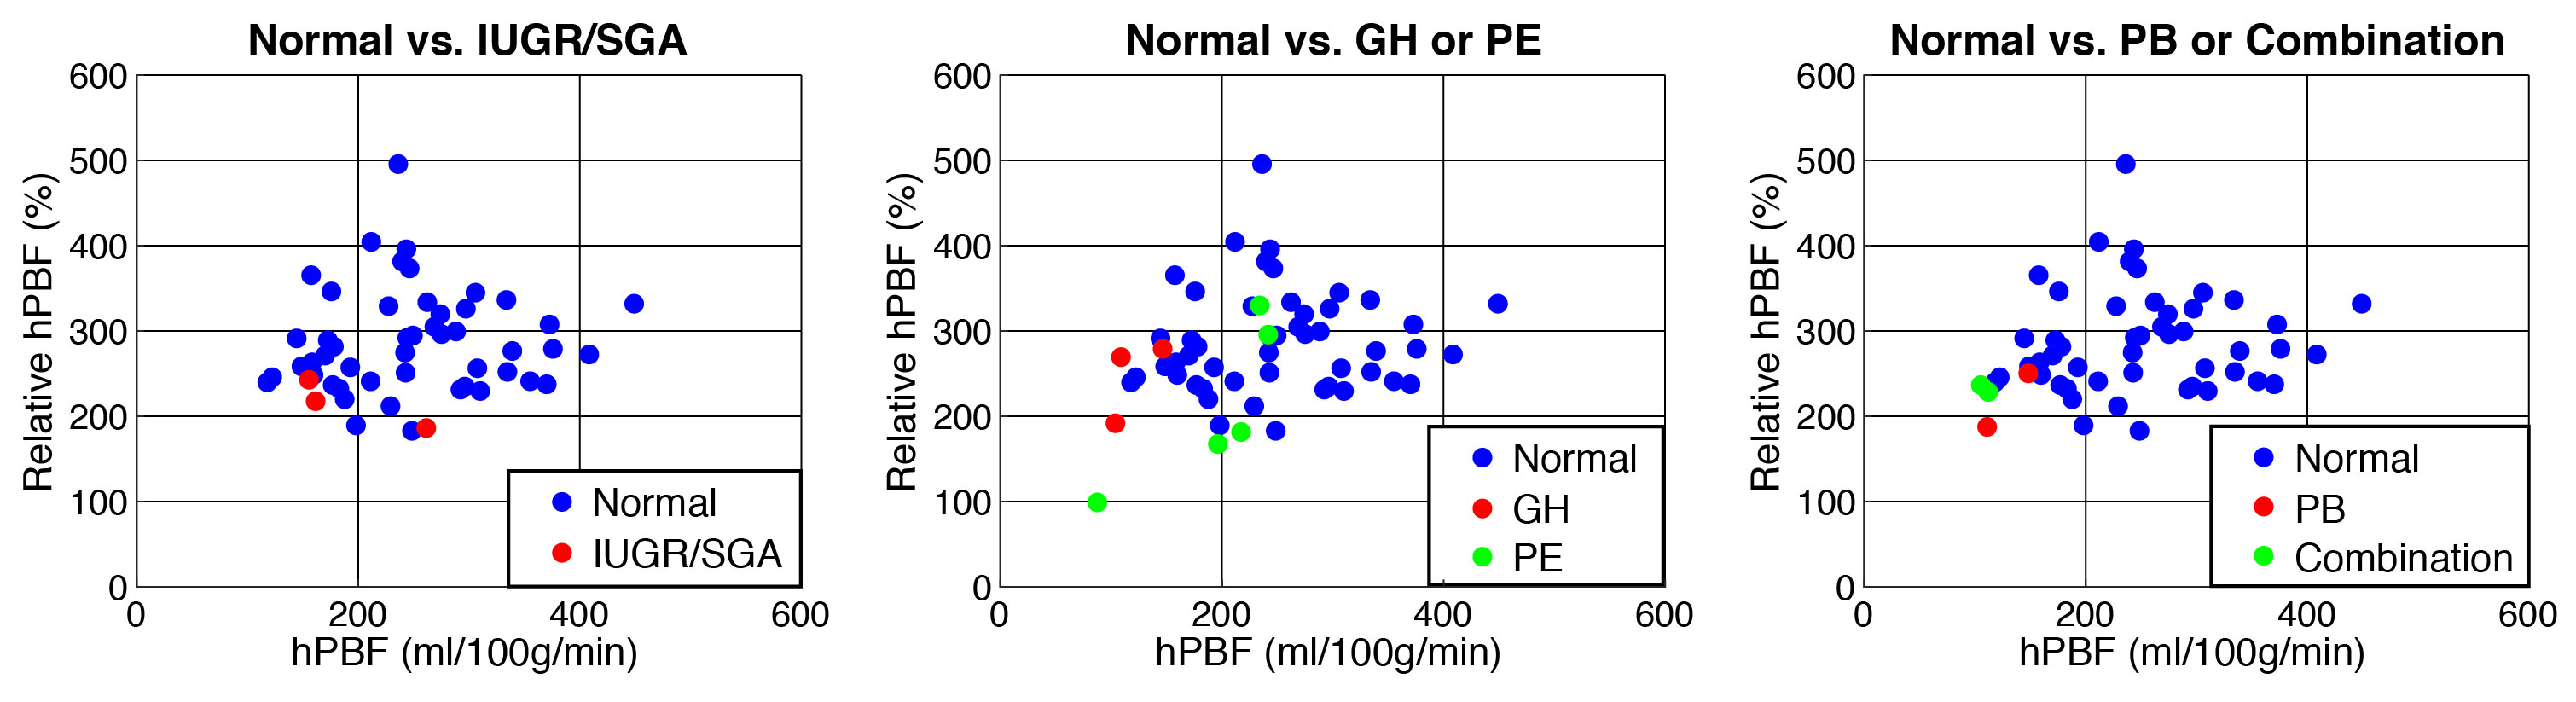
Fig. 4 demonstrates the relationship between two high perfusion-related parameters, hPBF and relative hPBF at the normalized 16-week gestational time point, normal vs. IUGR/SGA (a) and normal vs. gestational hypertension (GH) or pre-eclampsia (PE) (b), and normal vs. preterm birth (PB) or combination (c). Blue-colored dots represent normal pregnancy while red and green-colored dots represent IPD subjects.
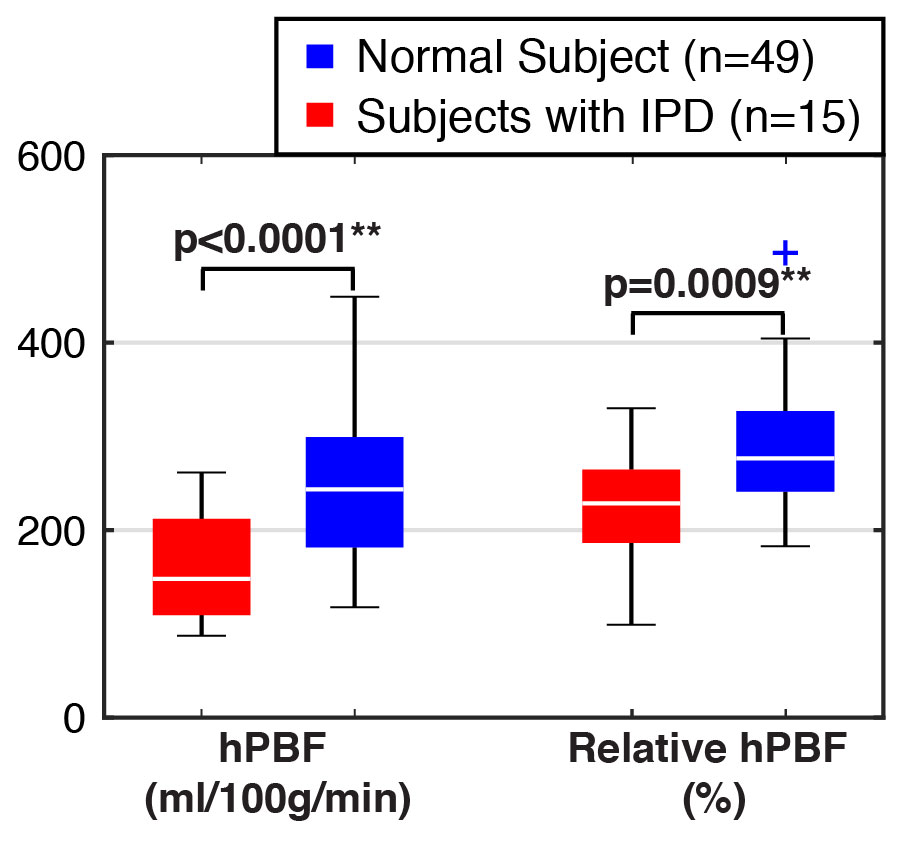
The differences between normal and IPD subjects for the two imaging parameters are illustrated in Fig. 5 as box plots. The red color denotes IPD, and the blue color denotes normal pregnancy. The highly significant difference was observed in both hPBF and relative hPBF at the normalized 16 weeks of gestation (p<0.01).
Conclusion
The high perfusion-related imaging parameters (hPBF and relative hPBF) were significantly different between normal and IPD subjects in early gestation, demonstrating a potential to serve as a promising imaging biomarker in predicting subsequent pregnancy outcomes.Acknowledgements
This study was supported by NIH U01-HD087221.References
1. American College of Obstetricians and Gynecologists, Task Force on Hypertension in Pregnancy. Hypertension in Pregnancy. Obstet Gynecol. 2013;122:1122–1131
2. Shao X, Liu D, Martin T, et al. Measuring human placental blood flow with multidelay 3D GRASE pseudocontinuous arterial spin labeling at 3T. J Magn Reson Imaging. 2018; 47(6):1667-1676.
3. Otsu N. A Threshold Selection Method from Gray-Level Histograms. IEEE Trans. Syst. Man. Cybern. 1979 p. 62–66.
Figures