1071
Quantifying T1 and T2* Relaxation Times of Fetal Fat, Fetal Liver, Fetal Kidney, and Amniotic Fluid at 1.5T1Medical Biophysics, Western University, London, ON, Canada, 2Obstetrics and Gynaecology, Western University, London, ON, Canada, 3Division of Maternal, Fetal and Newborn Health, Children’s Health Research Institute, London, ON, Canada
Synopsis
T1 and T2* relaxation times of fetal tissues as a function of gestational age have not been previously published. We acquired fetal MRI data from pregnant women with a gestational age between 29 and 38 weeks. Using DESPOT1 and Quantitative IDEAL, the T1 and T2* relaxation times, respectively, of fetal fat, fetal liver, fetal kidney, and amniotic fluid were quantified as a function of gestational age. Only fetal fat T1 and T2* relaxation times, and fetal liver T2* relaxation times changed during this gestational period.
Introduction
Fetal development (gestational age (GA): 10 – 40 weeks) – the process where fetal organs mature to become capable of sustaining the fetus outside the mother’s body – is the longest and most clinically relevant component of the gestational period.1-3 Accurate information about fetal development will allow clinicians to better understand, and potentially distinguish abnormal from normal development.
T1 and T2 relaxation times for adult organs have been previously quantified4 because they are commonly used as a source of contrast between tissues in images.5 However, the adult values may not be valid for the fetus due to the dramatic growth during gestation.1-3 To the best of our knowledge, the relaxation times of fetal organs, especially as a function of GA, have not been previously published. Some of the major fetal tissues that play a significant role during fetal development, and whose relaxation times should be quantified include fat,6 liver,7-8 and kidneys.6
Quantification of fetal tissue relaxation times will allow better optimization of image acquisition for fetal MRI. The purpose of this study is to quantify T1 and T2* relaxation times of fetal fat, fetal liver, fetal kidney, and amniotic fluid as a function of GA at 1.5T.
Methods
Women with singleton pregnancies and a GA between 29 and 38 weeks were imaged in a 1.5T MRI (GE MR450w). 3D water-fat MRI (Quantitative IDEAL, TR: 9.3-9.8 ms, Field of View: 50 cm, 128x128 pixels, slice thickness: 4-6.5 mm, 42-78 slices, ARC acceleration: 2x phase 2.5x slice and 32x32 calibration lines, acquisition time: 12-28 s) images were acquired with flip angles of 6° and 20° in separate breath holds.
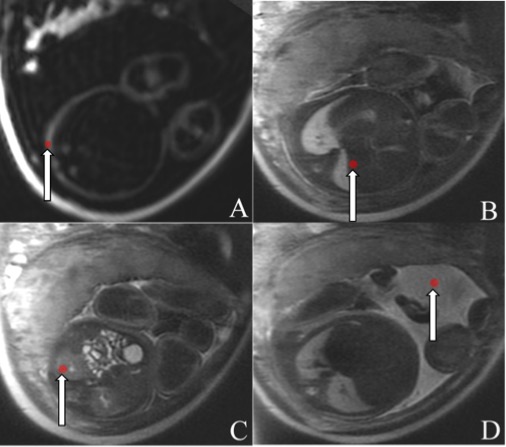
3D Slicer (v4.9.0-2018-05-04)9 was used to place 7-mm diameter regions of interest (ROIs) in fetal subcutaneous fat, a vessel-free region of the fetal liver, fetal kidney cortex, and amniotic fluid. Example ROI locations are shown in Figure 1.
For T1 quantification, a ROI was placed in identical locations of fetal fat in the 6° and 20° IDEAL fat images. The ROIs for the remaining tissues and fluid were placed in the same locations in the two IDEAL water images. T1 relaxation times were quantified from the mean signal value in the ROIs at the two flip angles using DESPOT1.10 For T2*, ROIs were transferred to the same location in the high flip angle R2* image reconstructed by Quantitative IDEAL. Linear regression was performed to determine if the slope of T1 and T2* over GA for each tissue and fluid was significantly different than zero using GraphPadPrism (v7.03) (α = 0.05).
Results
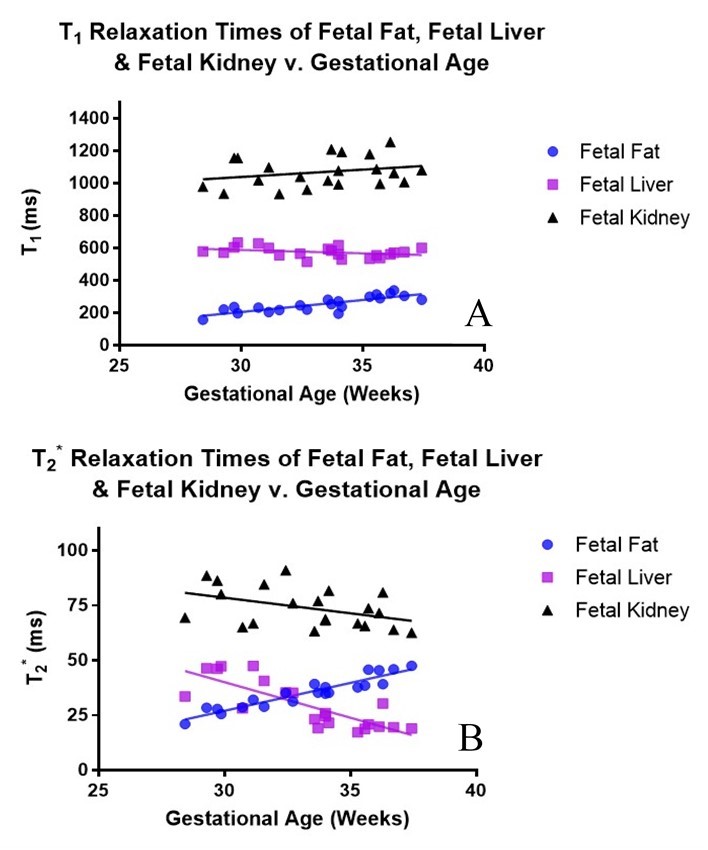
Twenty-one women with a GA between 28 and 37 weeks consented to the study. Sequences were repeated for three participants and no participant was excluded due to significant fetal motion. The T1 and T2* values of fetal fat both increased with GA as both slopes were significantly different than zero (p < 0.0001). The fetal liver T2* values decreased with GA with a slope significantly different than zero (p < 0.0001). Fetal liver T1, fetal kidney T1 and T2*, amniotic fluid T1 and T2* values remained relatively the same throughout the gestational period (Figure 2).Discussion
T1 and T2* relaxation times of fetal fat, fetal liver, fetal kidney, and amniotic fluid were determined at 1.5T. Amniotic fluid had the highest T1 and T2* relaxation times. The T1 values of fetal fat at the GA of 37 weeks, fetal liver, and fetal kidney are similar to the T1 values of adult fat, liver, and kidney cortex at 1.5T reported in de Bazelaire et al;4 the T2* values for the tissues are all less than their respective adult T2 values.4 The T1 and T2* values of fetal fat changed with GA, suggesting that fetal fat composition might be changing as pregnancy progresses.11 For fetal liver, only the T2* values decreased with increasing GA, suggesting an increase in hepatic iron concentration.12
Quantitative IDEAL was used because the participants had already consented to a study of fetal fat using the sequence and we could measure T1 by adding one extra acquisition. Furthermore, using water-fat separated images allowed us to eliminate any confounds from partial volume of water and fat.
Limitations of this study include small sample size and possibility of fetal motion between acquisitions. Future work should focus on quantifying T2 relaxation times for the above tissues and repeating the study at 3T.
Conclusion
We quantified T1 and T2* relaxation times of fetal tissues between 29 and 38 weeks GA, and showed that only the fetal fat T1 and T2*, and fetal liver T2* changed during this gestational period.Acknowledgements
Grant support from the Children's Health Research Institute, Natural Sciences and Engineering Research Council of Canada, Canadian Institutes of Health Research, and General Electric.References
1. Mayer C, Joseph KS. Fetal growth: a review of terms, concepts and issues relevant to obstetrics. Ultrasound Obstet Gynecol. 2013;41(2):136-145.
2. Moore KL, Persaud TVN. The Developing Human: Clinically Oriented Embryology. Fifth ed. Philadelphia: W.B. Saunders Company. 1993;93-112.
3. Langman J, Sadler TW. Langman’s Medical Embryology. Fifth ed. Baltimore: Williams & Wilkins. 1985;61-125.
4. de Bazelaire CMJ, Duhamel GD, Rofsky NM, et al. MR imaging relaxation times of abdominal and pelvic tissues measured in vivo at 3.0 T: preliminary results. Radiology. 2004;230(3):652-659.
5. Nitz WR, Reimer, R. Contrast mechanisms in MR imaging. Eur Radiol. 1999;9(6):1032-1046.
6. Mendelson CR. Minireview: fetal-maternal hormonal signaling in pregnancy and labor. Mol Endocrinol. 2009;23(7):947-954.
7. Guo Y, Zhang X, Huang J, et al. Relationships between hematopoiesis and hepatogenesis in the midtrimester fetal liver characterized by dynamic transcriptomic and proteomic profiles. PloS One. 2009;4(10):e7641.
8. Sasaki K, Sonoda, Y. Histometrical and three-dimensional analyses of liver hematopoiesis in the mouse embryo. Arch Histol Cytol. 2000;63(2):137-146.
9. Federov A, Beichel R, Kapathy-Cramer J, et al. 3D Slicer as an Image Computing Platform for the Quantitative Imaging Network. Magn Reson Imaging 2012;30(9):1323-1341.
10. Deoni SC, Rutt BK, Peters TM. Rapid combined T1 and T2 mapping using gradient recalled acquisition in the steady state. Magn Reson Med. 2003;49(3):515-526.
11. Giza SA, Olmstead C, McCooeye DA, et al. Measuring fetal adipose tissue using 3D water-fat magnetic resonance imaging: a feasibility study. J Matern Fetal Neonatal Med. 2018;1–7.
12. Wood JC. Magnetic resonance imaging measurement of iron overload. Curr Opin Hematol 2007;14:183-190.
Figures