0985
MRI-based Analysis of Morphologic, Inflammatory, and Mechanical Stress Factors that Govern Abdominal Aortic Aneurysm Progression Rates1Radiology and Biomedical Imaging, University of California, San Francisco, San Francisco, CA, United States
Synopsis
Clinical management of abdominal aortic aneurysm (AAA) disease is based on the maximal aneurysm diameter. Novel markers including vascular inflammation, intraluminal thrombus (ILT) composition and mechanical vessel wall stress have been correlated to AAA risk. Prior studies have typically focused on a single marker. We have developed a comprehensive AAA assessment based on high-resolution black-blood MRI and followed 41 patients for 1.9±0.6 years. Our results showed that both active ILT change and inflammation (identified by USPIO uptake) were strongly associated with AAA growth and/or intervention, and wall stress varied in a sub-group of patients. Such comprehensive assessment may improve AAA patient risk stratification.
Purpose
Abdominal aortic aneurysm (AAA) disease is prevalent and is a major cause of death. Current management is based on maximal diameter but that has limitations. Studies suggest that vascular inflammation1, intraluminal thrombus (ILT) composition2, and mechanical stress3may predict progressive AAA disease. However, previous studies mostly focused on a single marker. We aim to do a comprehensive evaluation of these markers and correlate with AAA growth or intervention.Methods
Study Population: 41 patients (40 male, age 71.6±6.3) with AAA disease were followed by repeated MRI for 1.9±0.6 years. Scanning Protocols: MRI was performed on a Siemens 3T scanner before and 3-5 days after ultrasmall superparamagnetic iron oxide (USPIO) administration (ferumoxytol). The accuracy and reproducibility of a 3D T1-weighted black blood MRI technique (DANTE-SPACE, blood suppressed fast-spin-echo4) was previously validated against a CTA gold standard5, and that sequence was used. Scan Parameters: 1.3mm isotropic resolution, TR/TE 800ms/20ms; echo train length 60. A standard 2D T2* mapping sequence was used to quantify USPIO uptake by macrophages (a marker of cellular inflammation). Scan parameter: 5mm slice thickness with 1.5mm in-plane resolution, 5 echoes from 4.8ms to 15ms. Image Analysis: ILT was designated bright if its signal on black blood MRI was higher than 1.2 times of adjacent psoas muscles2. Active ILT change was designated if new ILT formed during follow-up, or ILT signal changed from iso-intense to bright. Stable ILT was designated if ILT signal intensity remained unchanged or decreased. Positive USPIO uptake was defined as greater than 55% drop in T2* values1. Mechanical Analysis: 10 patients with USPIO uptake were selected for wall stress estimation. The 3D geometry of each AAA was reconstructed from MRI. For each case, a hexahedral-dominant computational mesh of the aneurysm wall was generated, and ILT was represented with tetrahedra. Stress analyses were computed using the finite element code ABAQUS, employing non-linear constitutive relations for vessel wall and thrombus from the literature. The unloaded state of each vessel was estimating using a fixed-point iterative method prior to a simulation of systolic loading, as previously described6. Von Mises wall stress was derived and compared between patients.Results
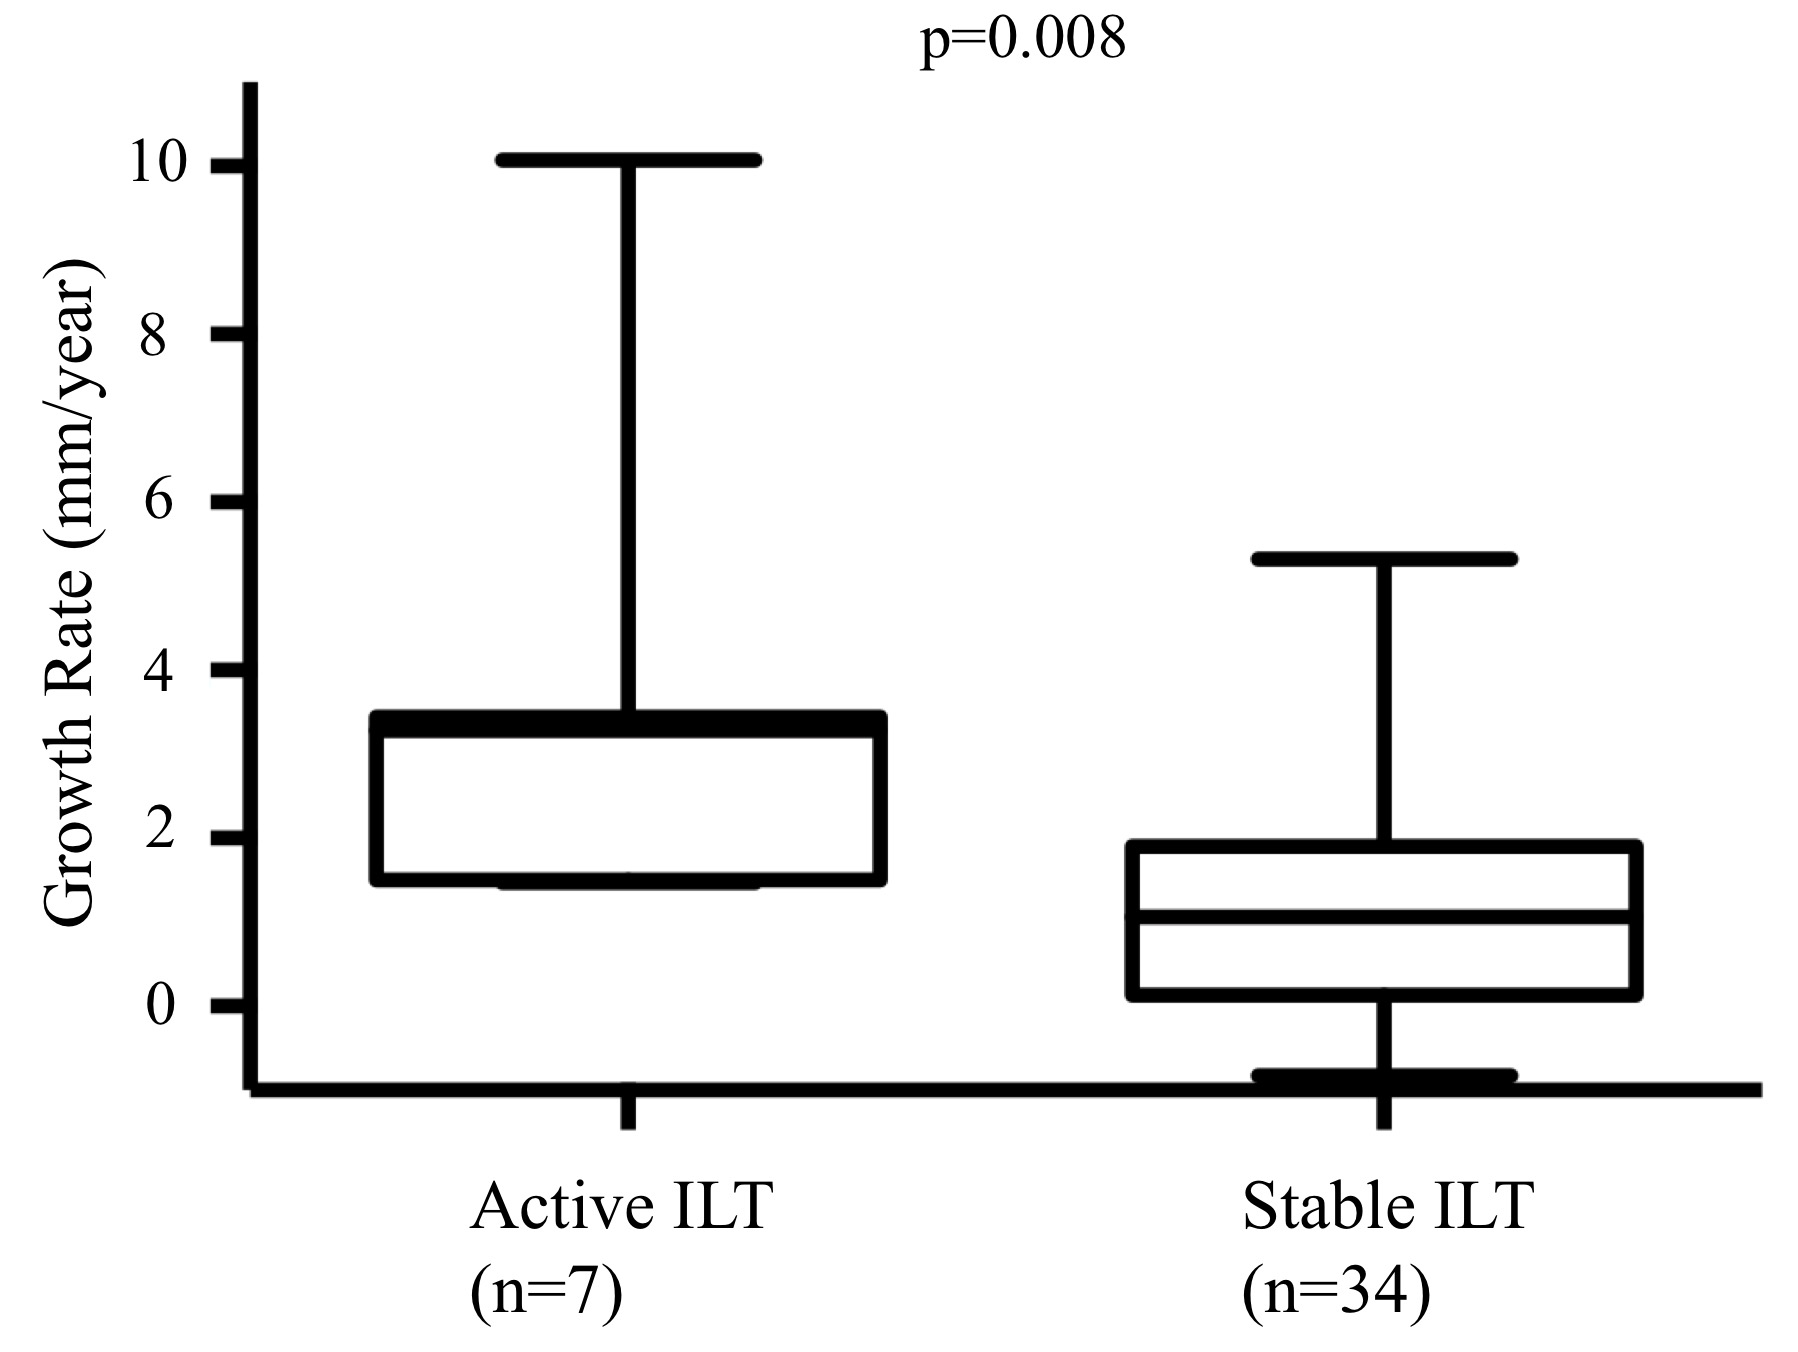
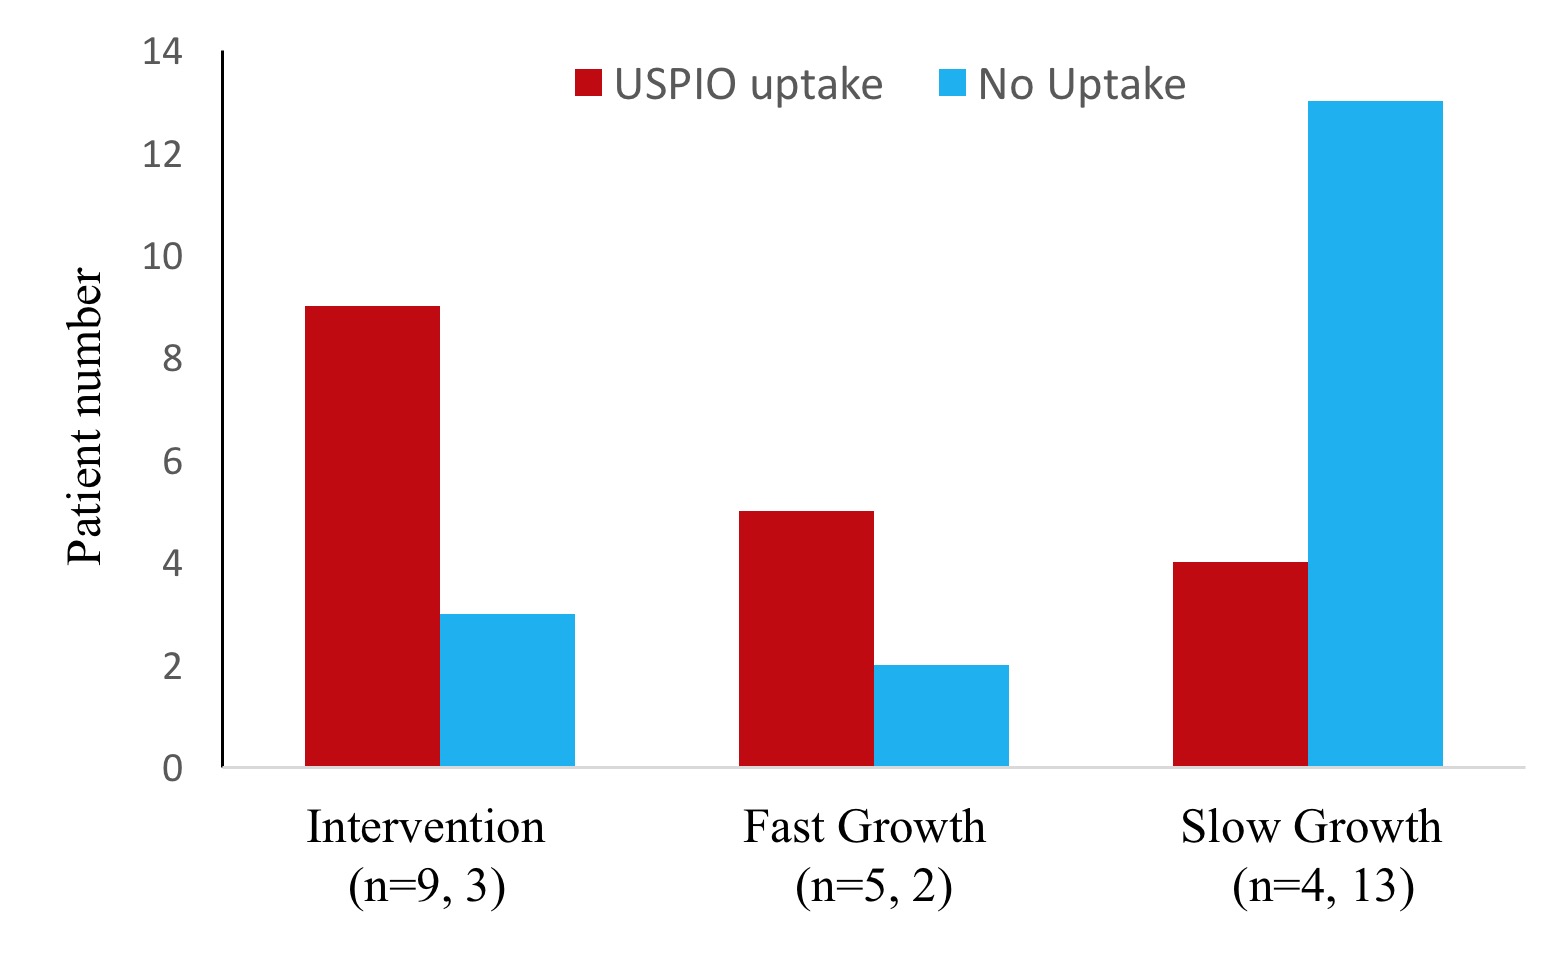
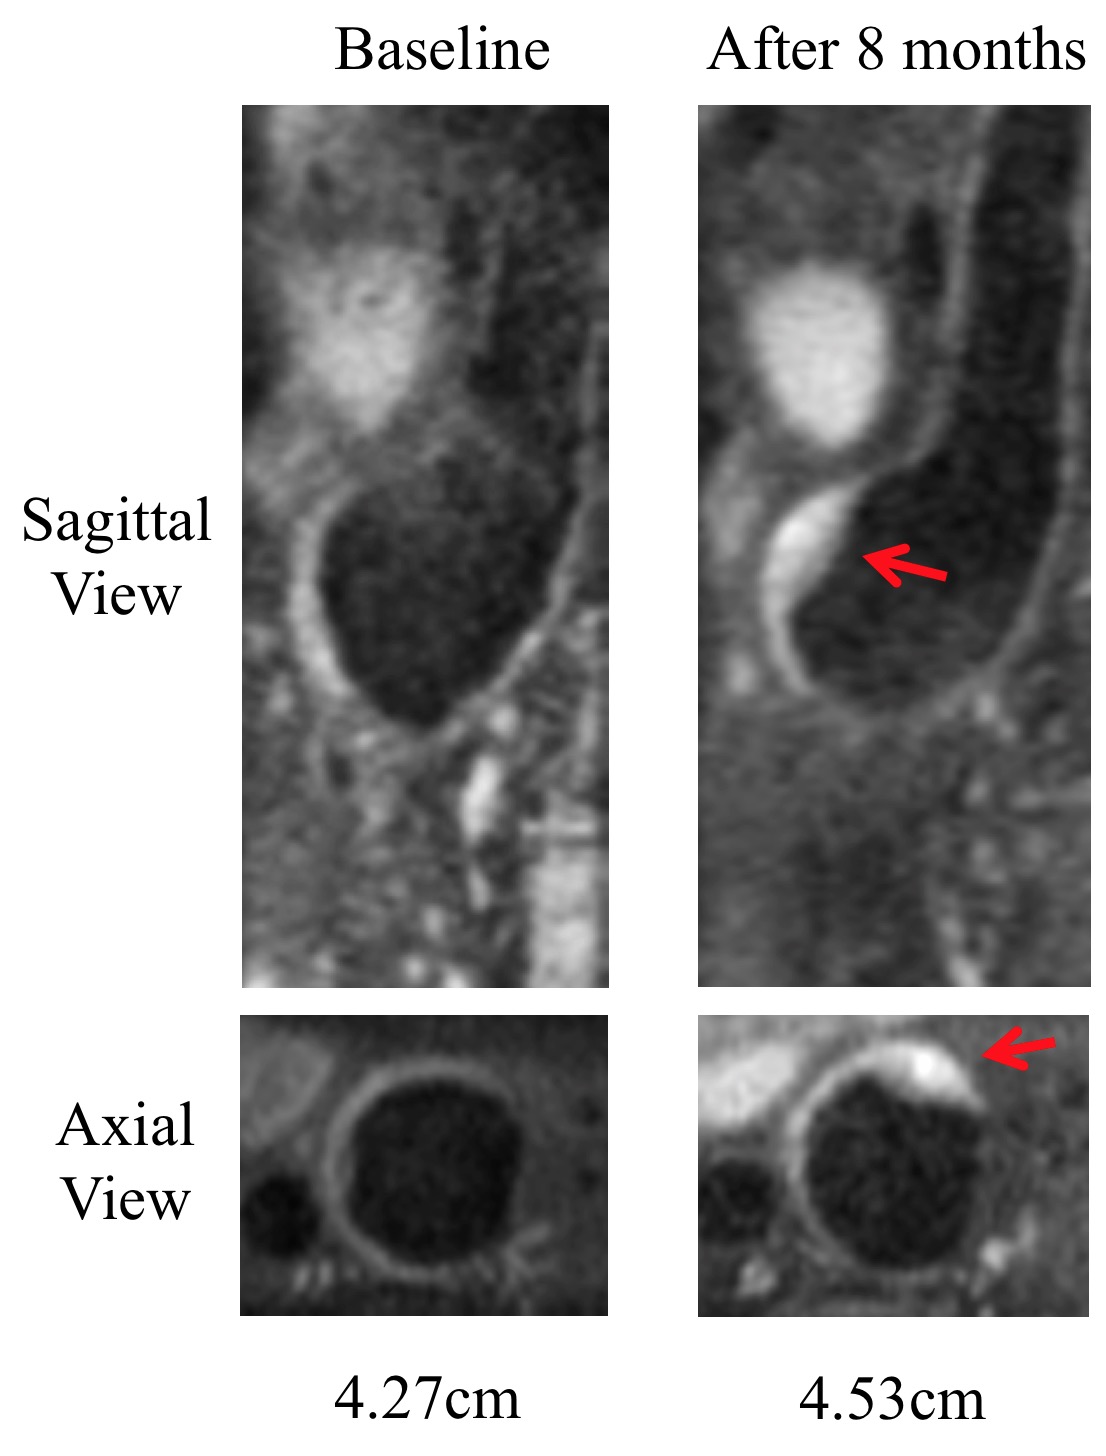
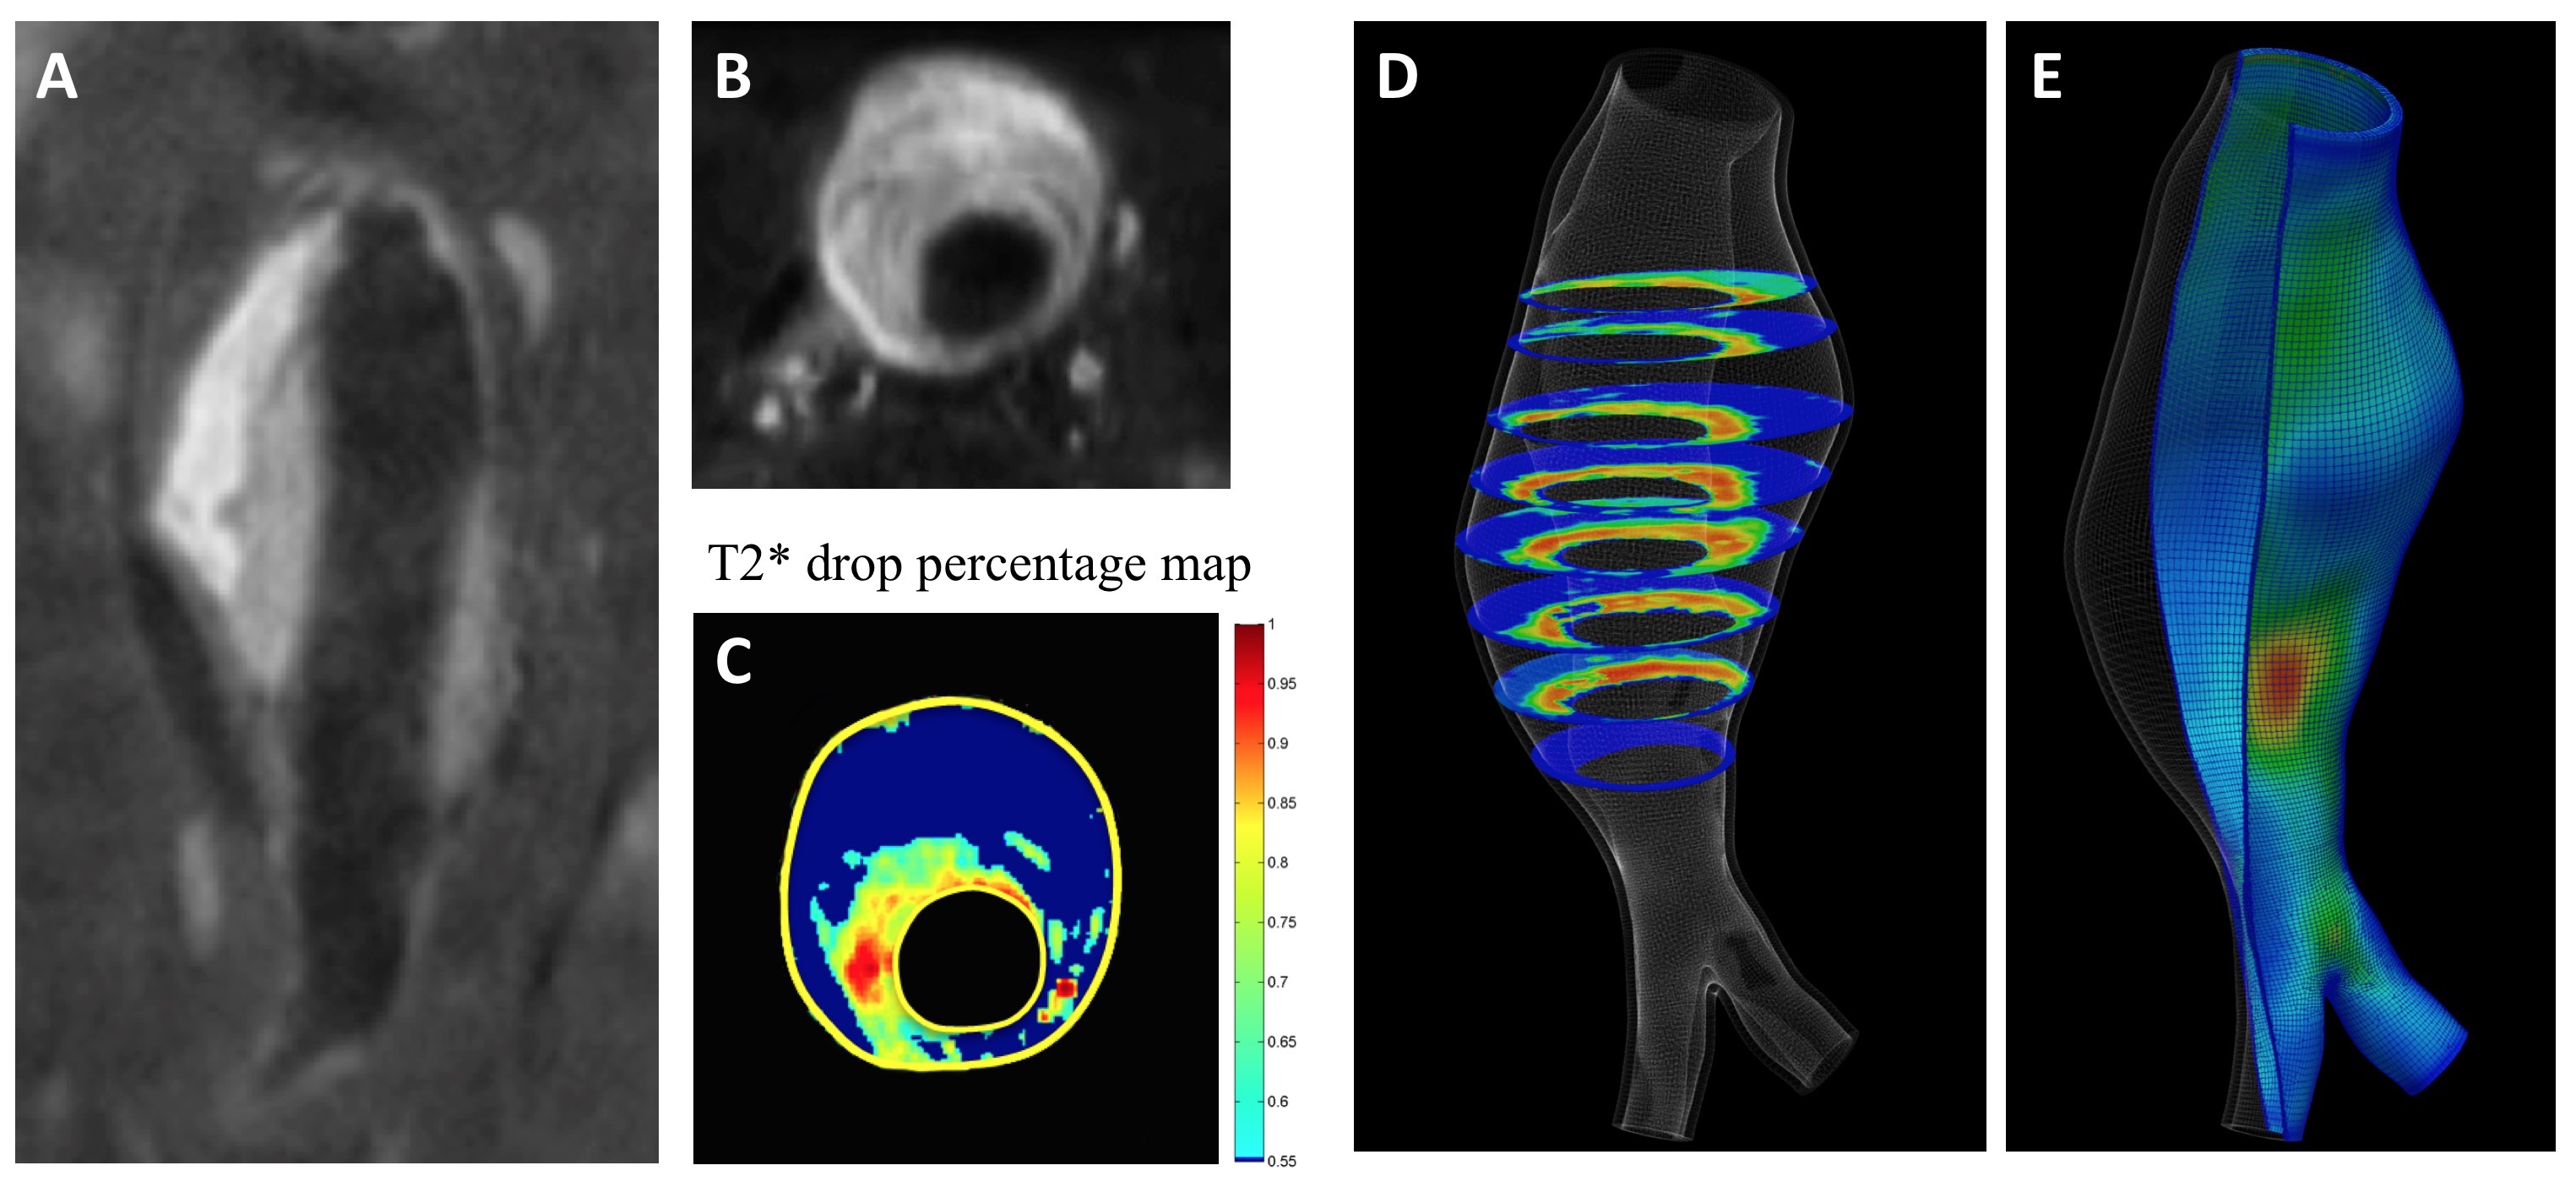
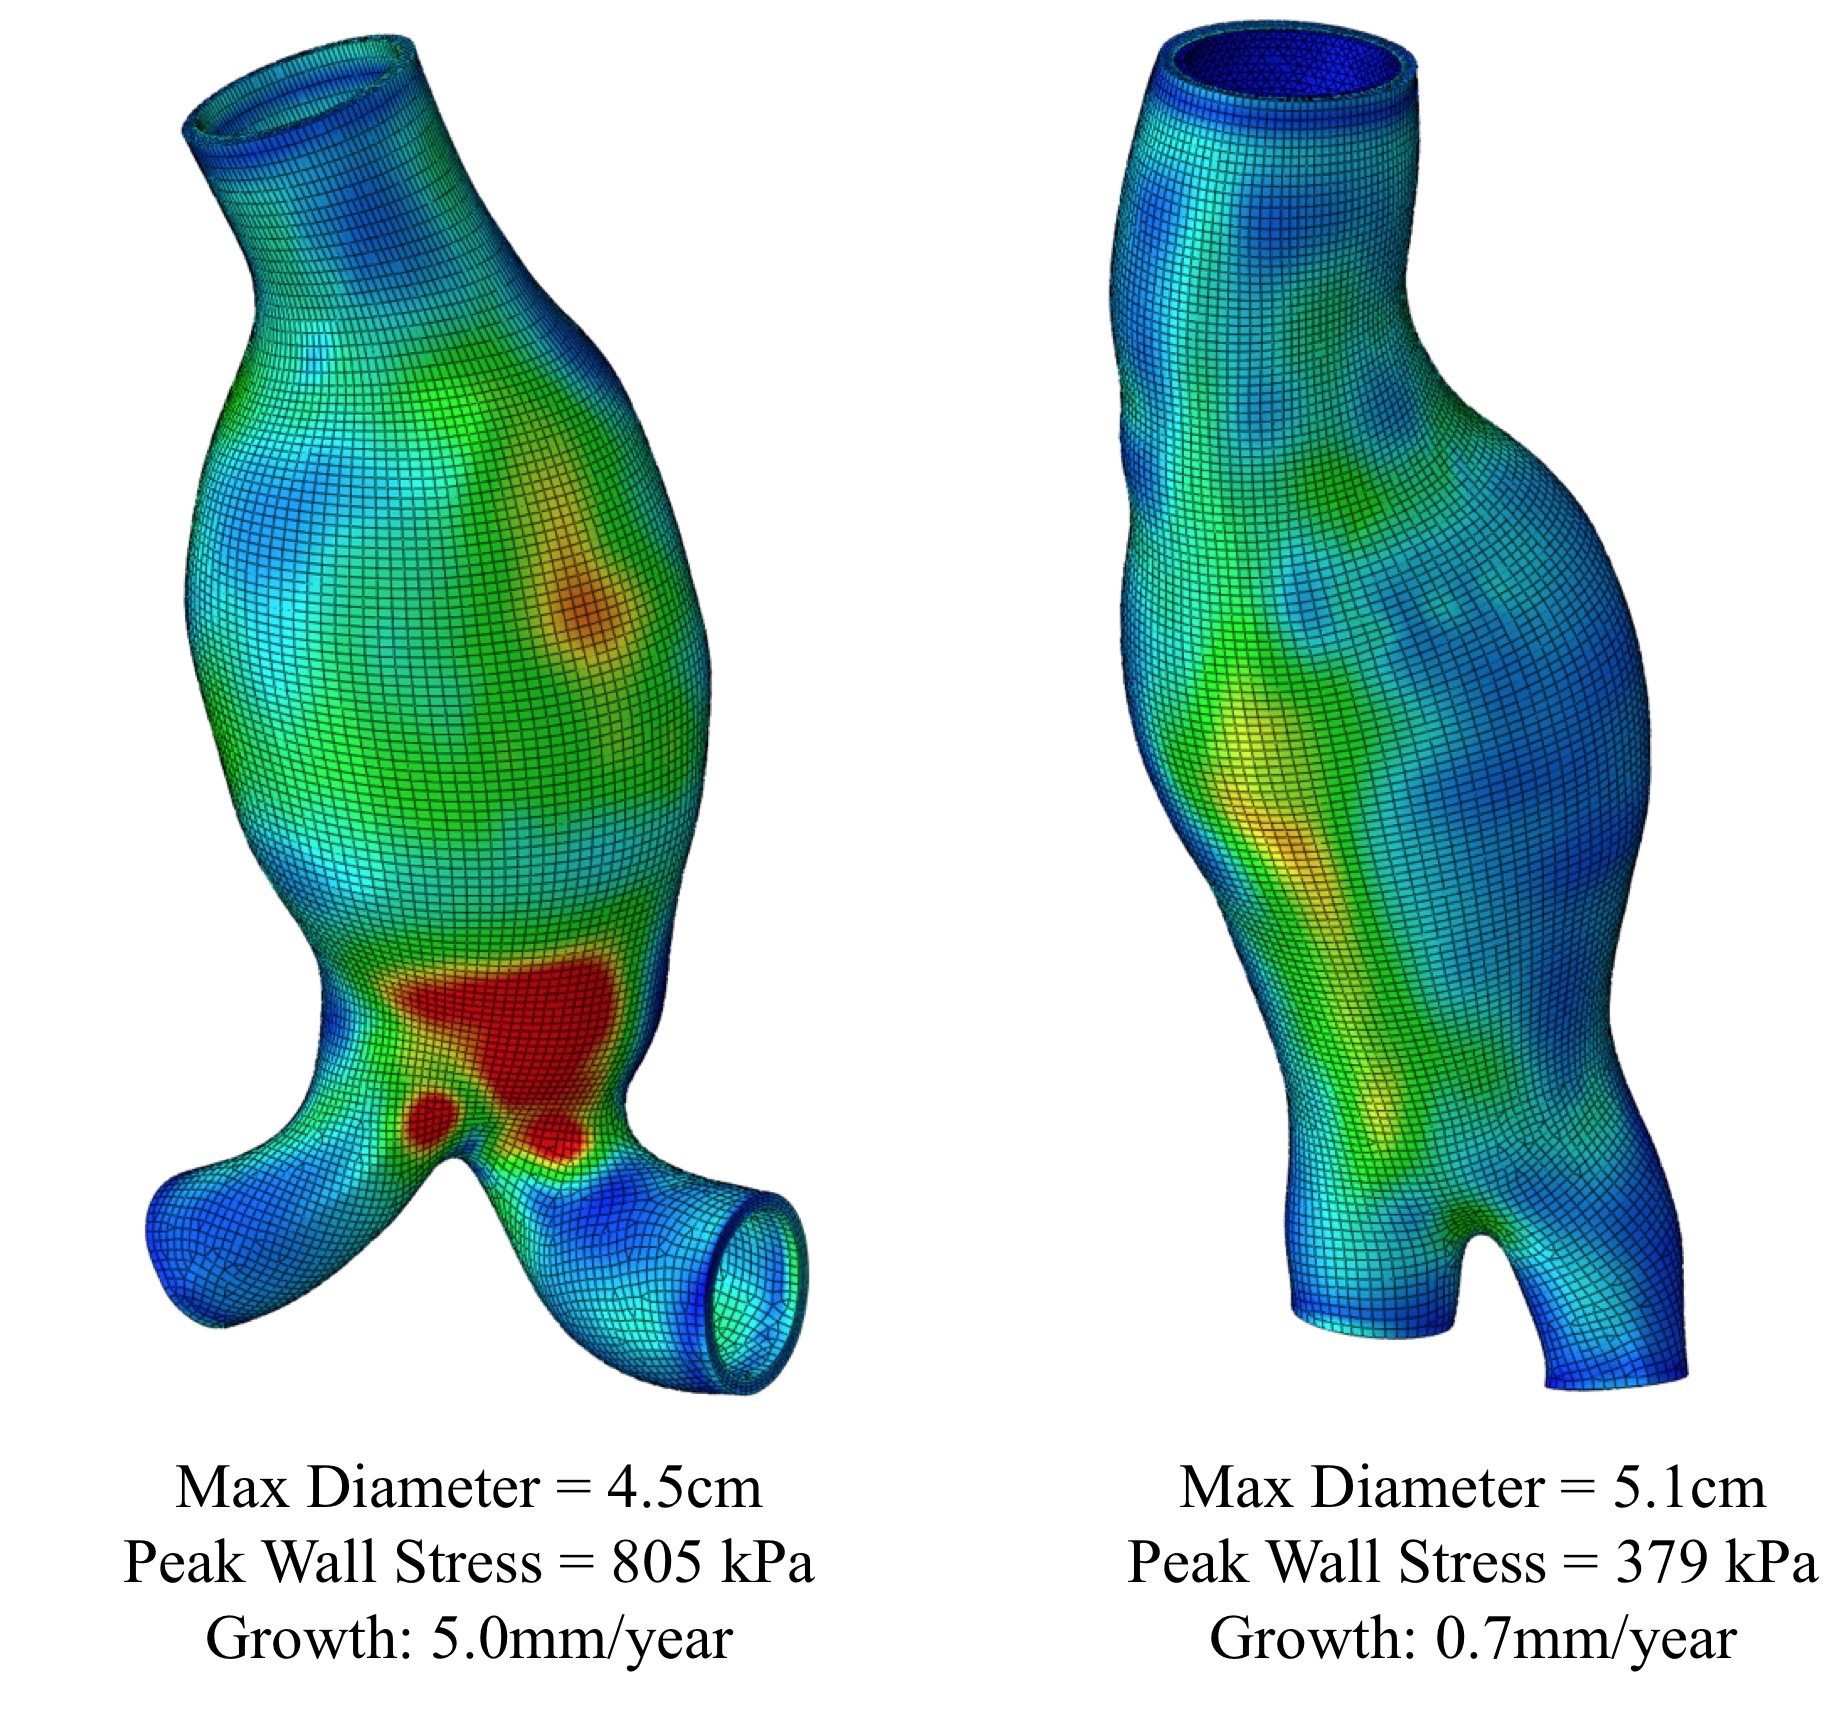
During follow up, 7 AAAs had active ILT change (3 had new ILT formation, and 4 had ILT of increasing signal intensity). The remaining 34 AAAs had stable ILT. AAAs with active ILT changes had a 3-fold increased growth rate compared to the AAAs with stable ILT (3.6±3.0mm/year versus 1.2±1.5mm/year, p=0.008, Figure 1). In 36 patients who successfully had full USPIO studies, 12 had intervention, 7 were defined as fast growers (>2.5mm/year) and 17 were slow growers (<2.5mm). The intervention and fast-growing groups were significantly more likely to have evidence of vascular inflammation compared with the slow growth group (9/12 and 5/7, versus 4/17, p=0.007, Figure 2). 10 patients with USPIO uptake had a wide range of peak wall stress (average 482±153kPa, range 325kPa to 805kPa). There was a trend that high wall stress correlated with faster growth (r=0.48, p=0.16), but without statistical significance. Figure 3 shows active ILT change in a fast growing AAA. Figure 4 shows the USPIO uptake and wall stress maps in a fast growing AAA. Figure 5 shows two cases with high and low wall stress, respectively.Discussion
To our knowledge, this is the first study to perform a comprehensive assessment of AAA risk including ILT composition, vascular inflammation and aneurysm wall stress. We found both active ILT change and delayed USPIO uptake were associated with fast AAA growth and/or intervention. Active ILT change may reflect active remodeling of the inflammatory vessel wall with bleeding from vasa vasorum which produces new/fresh ILT. Although only a small fraction of AAAs has active ILT (7/41), it is associated with 3-fold faster growth. Our USPIO results agree with recent literature1. In addition, we extend the T2* analysis to 3D, which will provide richer information on the inflammation distribution. There was no significant correlation between aneurysm wall stress and growth, possibly due to a small sample size. Aneurysm wall stress may provide additional value for differentiating fast- and slow growing AAAs, and will be the focus of further work. The major limitation of this study is the relatively small sample size. A larger cohort study is needed to identify whether these novel factors are independent predictors of AAA progression, and whether any synergistic effects exist between factors. The developed methods have the potential to improve the current patient management that relies on traditional risk factors.Conclusion
Active ILT change and vascular inflammation identified by high-resolution MRI is associated with more rapid AAA growth and intervention. Clinical imaging of these novel biomarkers has the potential to improve AAA patient risk stratification.Acknowledgements
This study is supported by NIH grants R01HL114118, R01HL123759 and K99HL136883.References
1. Richards JM, Semple SI, MacGillivray TJ, Gray C, Langrish JP, Williams M, et al. Abdominal aortic aneurysm growth predicted by uptake of ultrasmall superparamagnetic particles of iron oxide: A pilot study. Circ Cardiovasc Imaging. 2011;4:274-281
2. Nguyen VL, Leiner T, Hellenthal FA, Backes WH, Wishaupt MC, van der Geest RJ, et al. Abdominal aortic aneurysms with high thrombus signal intensity on magnetic resonance imaging are associated with high growth rate. Eur J Vasc Endovasc Surg. 2014;48:676-684
3. Li ZY, Sadat U, J UK-I, Tang TY, Bowden DJ, Hayes PD, et al. Association between aneurysm shoulder stress and abdominal aortic aneurysm expansion: A longitudinal follow-up study. Circulation. 2010;122:1815-1822
4. Zhu C, Haraldsson H, Faraji F, Owens C, Gasper W, Ahn S, et al. Isotropic 3d black blood mri of abdominal aortic aneurysm wall and intraluminal thrombus. Magn Reson Imaging. 2016;34:18-25
5. Zhu C, Tian B, Leach JR, Liu Q, Lu J, Chen L, et al. Non-contrast 3d black blood mri for abdominal aortic aneurysm surveillance: Comparison with ct angiography. Eur Radiol. 2016
6. Bols J., J. Degroote, B. Trachet, B. Verhegghe, P. Segers, J. Vierendeels. A computational method to assess the in vivo stresses and unloaded configuration of patient-specific blood vessels. Journal of Computational and Applied Mathematics. 246:10-17 2013
Figures