0837
Super-resolution 3D MRSI for Mapping 2HG and Tumor Metabolism in Patients with Mutant IDH Glioma1A. A. Martinos Center for Biomedical Imaging, Massachusetts General Hospital, Charlestown, MA, United States, 2Harvard Medical School, Boston, MA, United States, 3iCAD, Nashua, NH, United States, 4Department of Neurosurgery, Massachusetts General Hospital, Charlestown, MA, United States, 5Department of Neurology, Massachusetts General Hospital, Charlestown, MA, United States
Synopsis
To improve the spatial resolution of 3D MRSI, a feature-based nonlocal means approach utilizing the structural information of high-resolution MR images is proposed. By estimating similarity between voxels using a feature vector that characterizes the laminar pattern of brain structures, a more accurate similarity measure is achieved compared to conventional upsampling methods. The preliminary results on simulated and in vivo data indicate the proposed method has great potential for clinically neuroimaging applications.
INTRODUCTION
Magnetic resonance spectroscopic imaging (MRSI) provides complementary information with respect to conventional magnetic resonance imaging. However, obtaining high resolution MRSI is limited by several factors, such as low signal to noise ratio (SNR) and long acquisition time. To handle this difficulty, researchers proposed many methods from different perspectives, for instance, pulse sequence design and advanced reconstruction techniques. Although data acquisition and reconstruction techniques can improve the MRSI spatial resolution1,2, these may not be available in most clinical situations or small lesions may not be well delineated decreasing the utility for patient treatment with surgery and targeted therapy. In practice, high resolution structural MRI images are always available and in this work, we concentrate on developing more effective super-resolution methods3 for low resolution MRSI based on priors high resolution anatomical images. In particular, super-resolution MRSI has been shown previously for 2D single slice data4, however to date super-resolution upsampling of 3D MRSI has not been shown. It is customary that the slice direction in 3D MRSI has the lowest resolution, hence improving resolution in this direction is the most challenging.METHODS
3D low-resolution MRSI metabolite maps are upsampled for increasing their spatial resolution by proposed feature-based nonlocal means approach utilizing structural information of high-resolution T1-weighted MR images. In this method, the similarity between voxels is estimated using a feature vector which characterizes the laminar pattern of brain structures, which leads to a more accurate similarity measure in comparison with conventional patch-based methods. The pipeline includes three main steps: (1) a super-resolution initialization by total-variation based upsampling method (2) calculate the weights to update the super-resolution initialization iteratively using only high-resolution T1-weighted MR images (3) estimate the weights from the super-resolution metabolite maps from step (2) and the high-resolution T1-weighted MR images to update the metabolite maps iteratively until the metabolite maps concentration difference between current and previous iterations is small enough. Low resolution 3D MRSI data were obtained at 3T with and adiabatic spin echo spiral sequence5 using: TR/TE=1800/97, k-space matrix 46x46x10, FOV = 240x240x120 mm, 3 weighted averages, acquisition time of 18:22 min.RESULTS
The proposed methods are compared with spline, patch-based nonlocal and total variation-based upsampling methods on simulated metabolite maps and in vivo data from healthy subjects and patients with brain tumors. Proposed method 1, 2 and 3 correspond to the approach with super-resolution initialization by Spline, Nonlocal, and Total Variation, respectively.
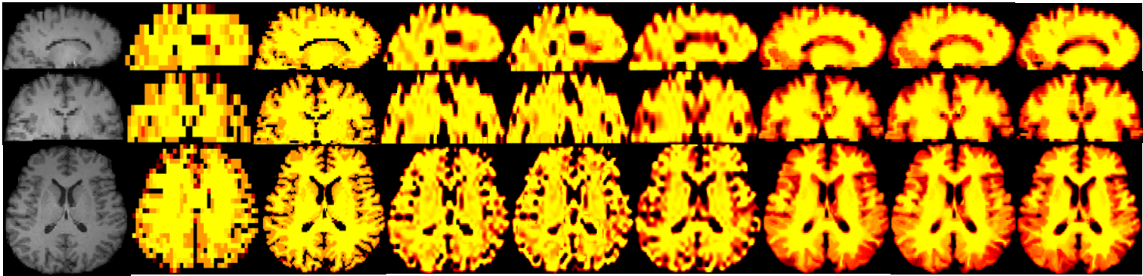
1) Simulated Metabolite Maps. We conducted MRI tissue segmentation using Freesurfer software, then simulate a high resolution N-acetylaspartate (NAA) map with size 138×138×40 in the subject brain images by those segmented tissues. This was obtained from high resolution 1mm MRI by truncating the k-space. The simulated NAA maps correspond to the brain slab that was imaged by 3D MRSI and have a resolution which are 3 times higher in plane and 4 times higher in slice direction compared to 3D MRSI. For this study, the NAA concentration was chosen to be 11 (arbitrary units) in white matter, 10 in gray matter and 0 in Cerebrospinal fluid. Two quantitative measures, namely the mean square error (MSE) and structural similarity index (SSIM) to the ground truth are used to evaluate the performance of those methods (See Table 1). Fig.1 shows the upsampling results of simulated data using different methods.
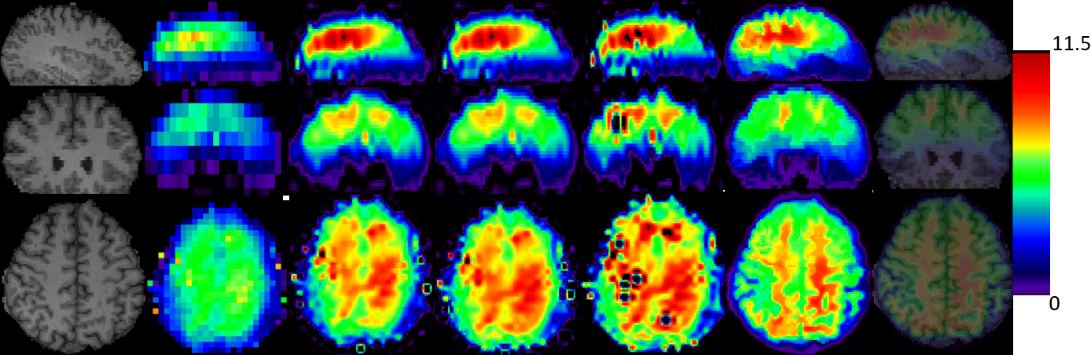
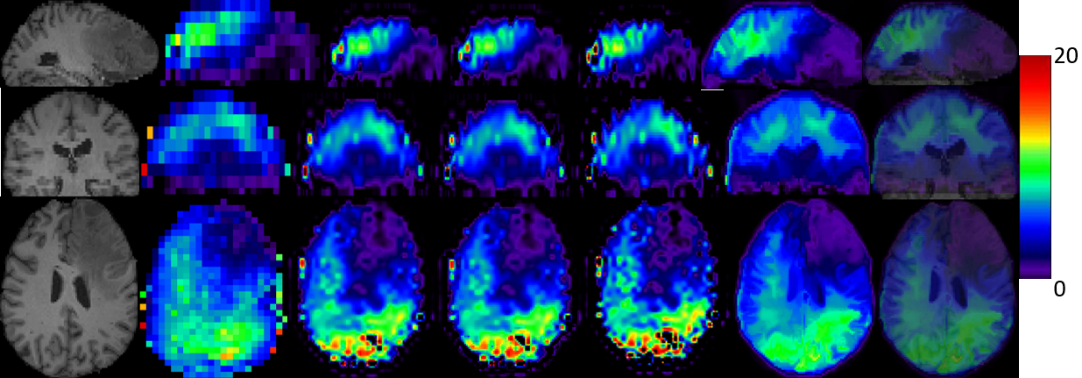
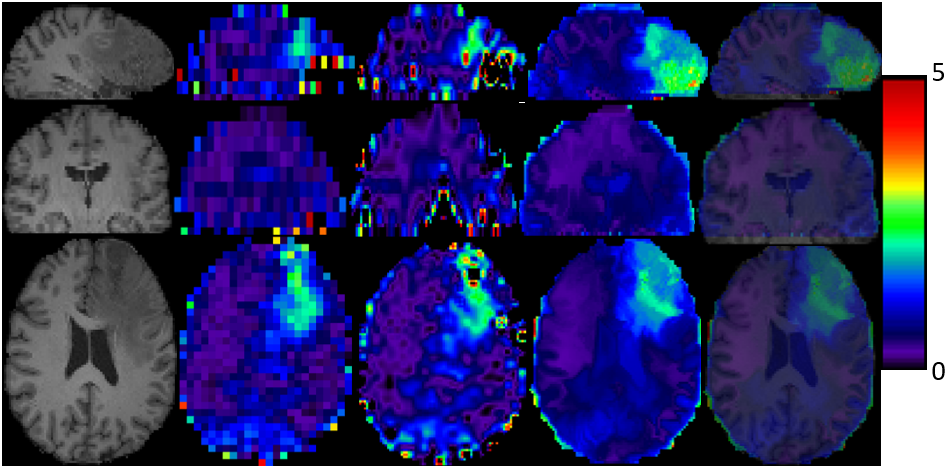
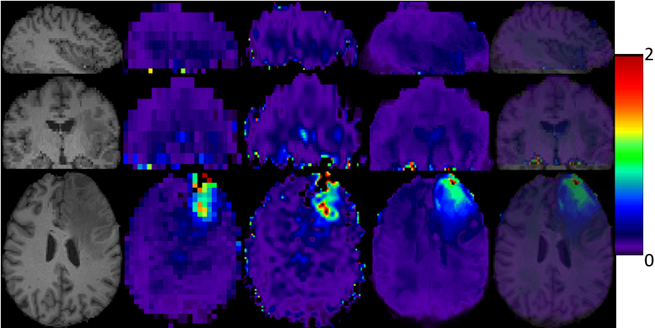
2) Metabolite Maps from In Vivo data. We also test our proposed method on metabolite maps from in vivo data acquired in healthy subjects and brain tumor patients.. 3D low-resolution 46×46×10 metabolic maps are upsampled to the size 138×138×40 by the conventional and proposed methods. The total NAA maps (NAA+NAAG) in all subjects and the relative maps of 2HG and total choline (GPC+PCh) obtained by LCModel fitting6 are used as low resolution images.
Table1 Spline Nonlocal Total-Variation Proposed Method 1 2 3
MSE //2.66 //2.96 //1.53 // 0.65 // 0.65 // 0.83
SSIM // 0.63 // 0.62 // 0.72 // 0.77 // 0.77 // 0.85
Table 1: Comparison of different upsampling methods in terms of MSE and SSIM on simulated 3D metabolite maps.
DISCUSSION/CONCLUSION
Our preliminary results indicate that the proposed feature-based nonlocal means iterative approach is promising for enhancing the spatial resolution of 3D metabolite maps by the aid of high-resolution T1-weighted MR images. It is capable of recovering structural information superior to conventional upsampling methods. In particular, good anatomical detail may be recovered in the slice direction which is the most challenging. The results from in vivo data further indicate that the proposed method has great potential for clinically neuroimaging applications in subjects with either normal anatomy or lesions such as brain tumors. Further validation and verification is underway.Acknowledgements
No acknowledgement found.References
1. Lam, F., et al. "High-resolution H-MRSI of the brain using SPICE: Data acquisition and image reconstruction', Magn Reson Med, 2015, doi: 10.1002/mrm.26019.
2. Strasser, B. et al. "(2 + 1)D-CAIPIRINHA accelerated MR spectroscopic imaging of the brain at 7T", Magn Reson Med, 201778: 429-40.
3. Jafari-Khouzani, Kourosh. "MRI upsampling using feature-based nonlocal means approach." IEEE transactions on medical imaging 33.10 (2014): 1969-1985.
4. Jain, Saurabh, et al. "Patch-based super-resolution of MR spectroscopic images: application to multiple sclerosis." Frontiers in neuroscience 11 (2017): 13.
5. Esmaeili, M., et al. "Three-dimensional MR spectroscopic imaging using adiabatic spin echo and hypergeometric dual-band suppression for metabolic mapping over the entire brain", Magn Reson Med, 2016, 2: doi: 10.1002/mrm.26115.
6. Provencher, S. W. "Automatic quantitation of localized in vivo H-1 spectra with LCModel", NMR Biomed, 2001, 14: 260-64.
Figures