0811
T1, T2, and T1ρ Magnetic Resonance Fingerprinting of the Abdomen1Department of Diagnostic Radiology, Oregon Health and Science University, Portland, OR, United States, 2Advanced Imaging Research Center, Oregon Health and Science University, Portland, OR, United States
Synopsis
T1p relaxation mapping is an intensive technique in terms of acquisition time and specific absorption rate (SAR), making it difficult to acquire in the abdomen. In this study, magnetic resonance fingerprinting (MRF) techniques are applied to simultaneously acquire T1, T2, and T1p relaxation times by adding spin lock pulses before periods of flip angle and TR modulation. MRF and conventional sequences were acquired in phantoms and the abdomen of healthy volunteers. Good agreement was found between the T1, T2, and T1p values from MRF and conventional sequences.
Purpose
Magnetic resonance fingerprinting (MRF) allows for quantitative mapping of multiple parameters simultaneously, creating inherently co-registered images in the abdomen. Previous MRF studies have primarily focused on T1 and T2 relaxation times[1,2]. T1ρ relaxation imaging is a quantitative imaging technique that has been used to assess cartilage integrity[3,4], liver fibrosis[5], and myocardial disease[6]. However, T1ρ is intensive in terms of acquisition time and specific absorption rate (SAR), making it difficult to acquire in the abdomen. In this study, the MR signal is sensitized to T1ρ relaxation by adding spin lock pulses in addition to flip angle and TR manipulation.Methods
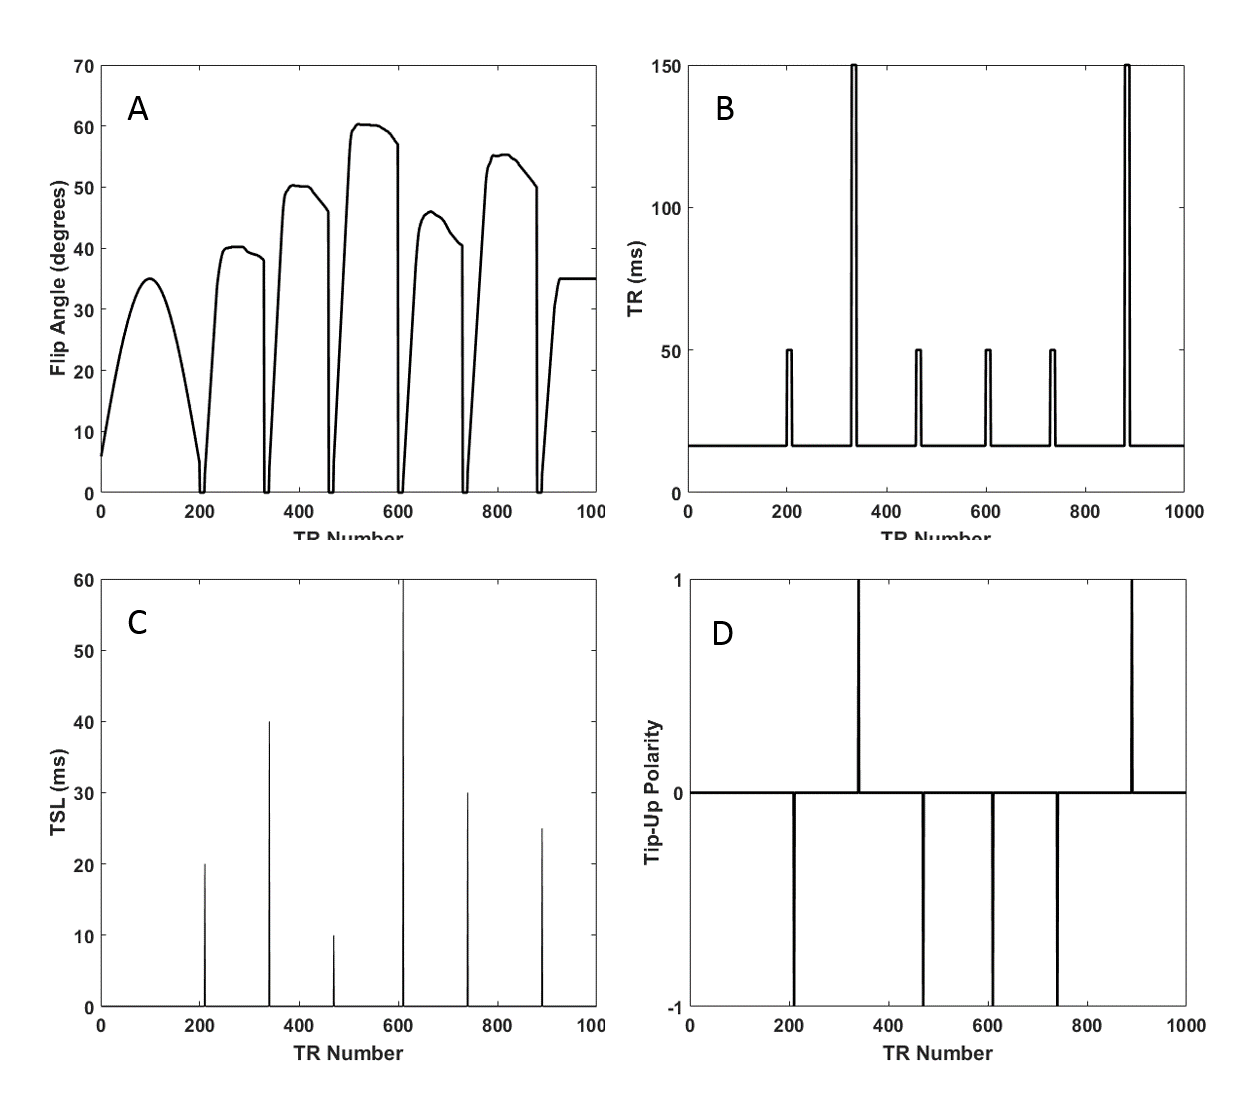
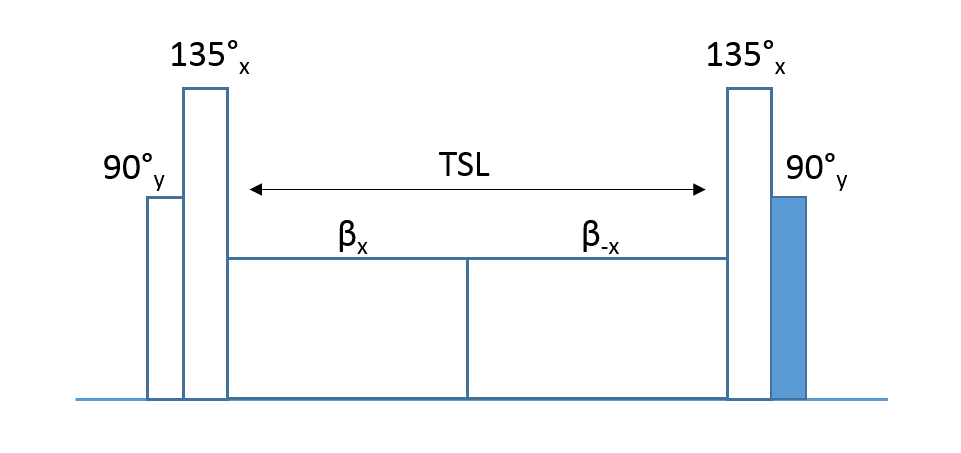
The proposed sequence is shown in Figure 1. The design approach is initially similar to conventional T1/T2 MRF, with the addition of spin lock preparations (SLPs) played before normal RF excitation at key points in the sequence. Composite pulses are used to reduce errors due to B1/B0 inhomogeneity, as shown in Figure 2[7]. The tip-up pulse at the end of the SLP (highlighted in blue) can be of two different polarities, to allow for some form of RF phase cycling.
The proposed sequence was acquired in agarose phantoms of varying concentrations and in six healthy volunteers with no history of abdominal disease or chronic abdominal pain were recruited under an IRB approved protocol (21-50 years of age, mean=32.5±11.2 years, 3 male and 3 female). Several axial slices of the abdomen were acquired with conventional T1, T2, and T1ρ mapping sequences as well as the proposed MRF sequence on a 3T Siemens PRISMA MR scanner using a 16 channel body array coil and 18 channels of the spine array coil. The fingerprinting sequence consists of an undersampled variable density spiral, which is approximately 24x undersampled at the center of k-space and 48x undersampled at the edges. Additional parameters include FOV=40cm, data matrix=256x256, TE=2.3ms, spin lock frequency=300Hz, acquisition Time=20.5s. Fat saturation pulses were played at the end of each TR along with gradient spoiling for FISP contrast. Dictionary values were generated using a Bloch simulation and simulated signal was generated for T1 values from 100-3000ms in 100ms increments, T2 from 4-120 in 4ms increments, and T1ρ from 4-120ms in 4ms increments, and normalized B1 values from 0.65 to 1.35 in 0.05 increments. To fit for T1, T2, T1ρ, the inner product between the measured signal in each pixel and each entry in the dictionary was calculated only for values matching the normalized B1 value obtained from a separately acquired B1 mapping sequence, similar to Chen et al [8].
Conventional T1 images were acquired with a variable flip angle VIBE sequence with FOV=38cm, 220x224, slice thickness=5mm, TR/TE=5.01ms/2.3ms, FAs=[3.0,7.0,11.0,15.0]. Conventional T2 images were acquired with a multi-slice turbo spin-echo sequence across four breath holds with FOV=38cm, 154x192, TR=1200ms, slice thickness=5mm, TEs=[7.7,61.6,123.2ms], acquisition time=16s per breath hold. Lastly, conventional T1ρ images were over 14 TRs, each acquired with a SLP applied before 90° excitations and a 12x undersampled spiral acquisiton. Half of the SLPs were given opposite polarity for RF phase cycling. Acquisition parameters were TR=1125ms, TE=2.7ms, FOV=40cm, TSL=[10,25,40], spin lock frequency=300Hz. Conventional T1 maps were fit using the Siemens software, while conventional T2 and T1ρ used monoexponential two-parameter fits in Matlab (Mathworks, Natick, MA).
Results
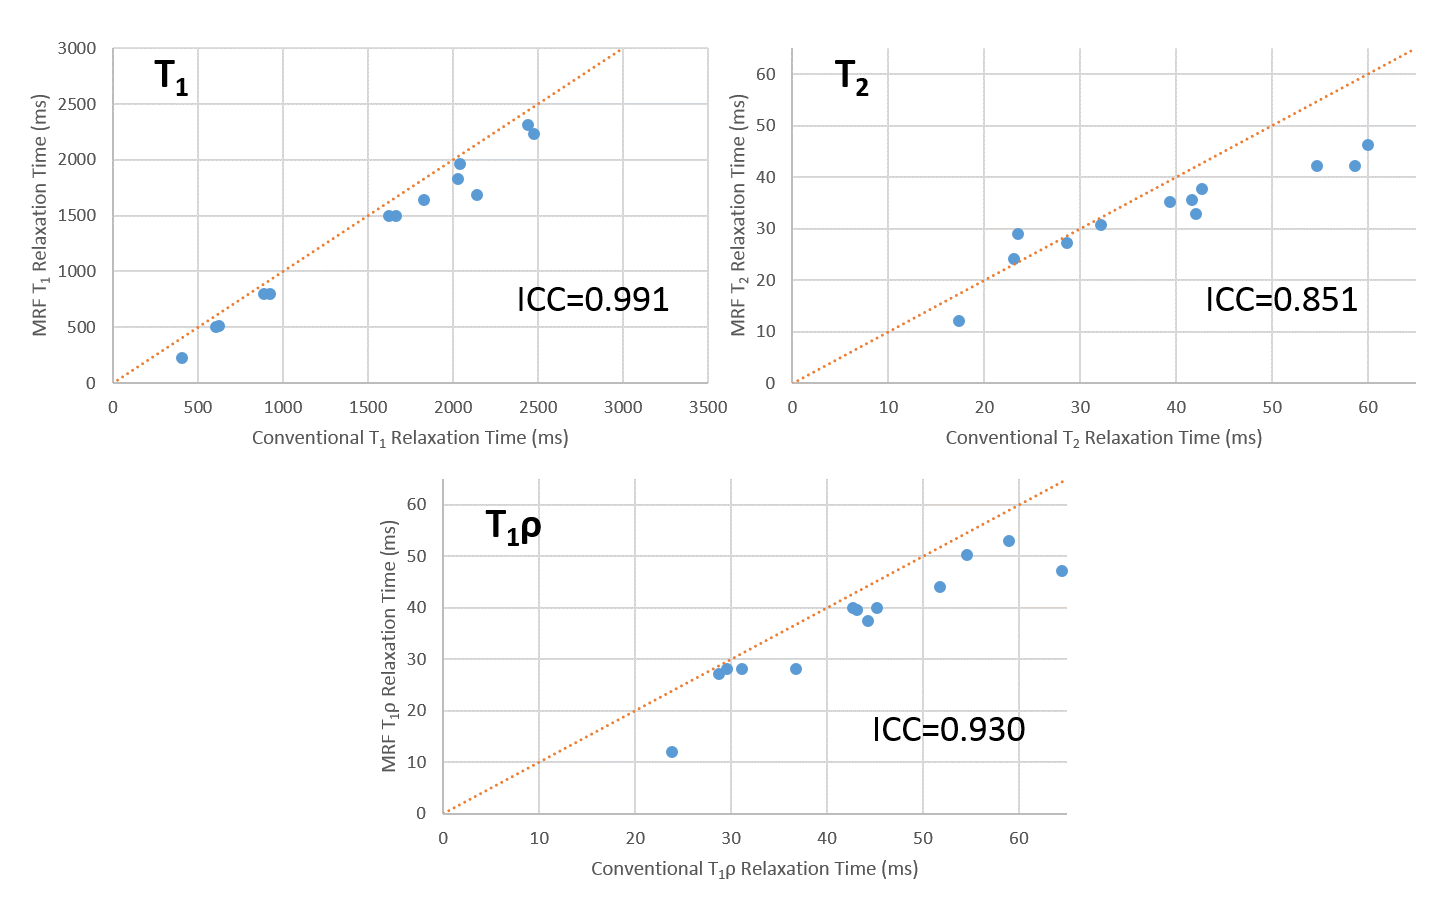
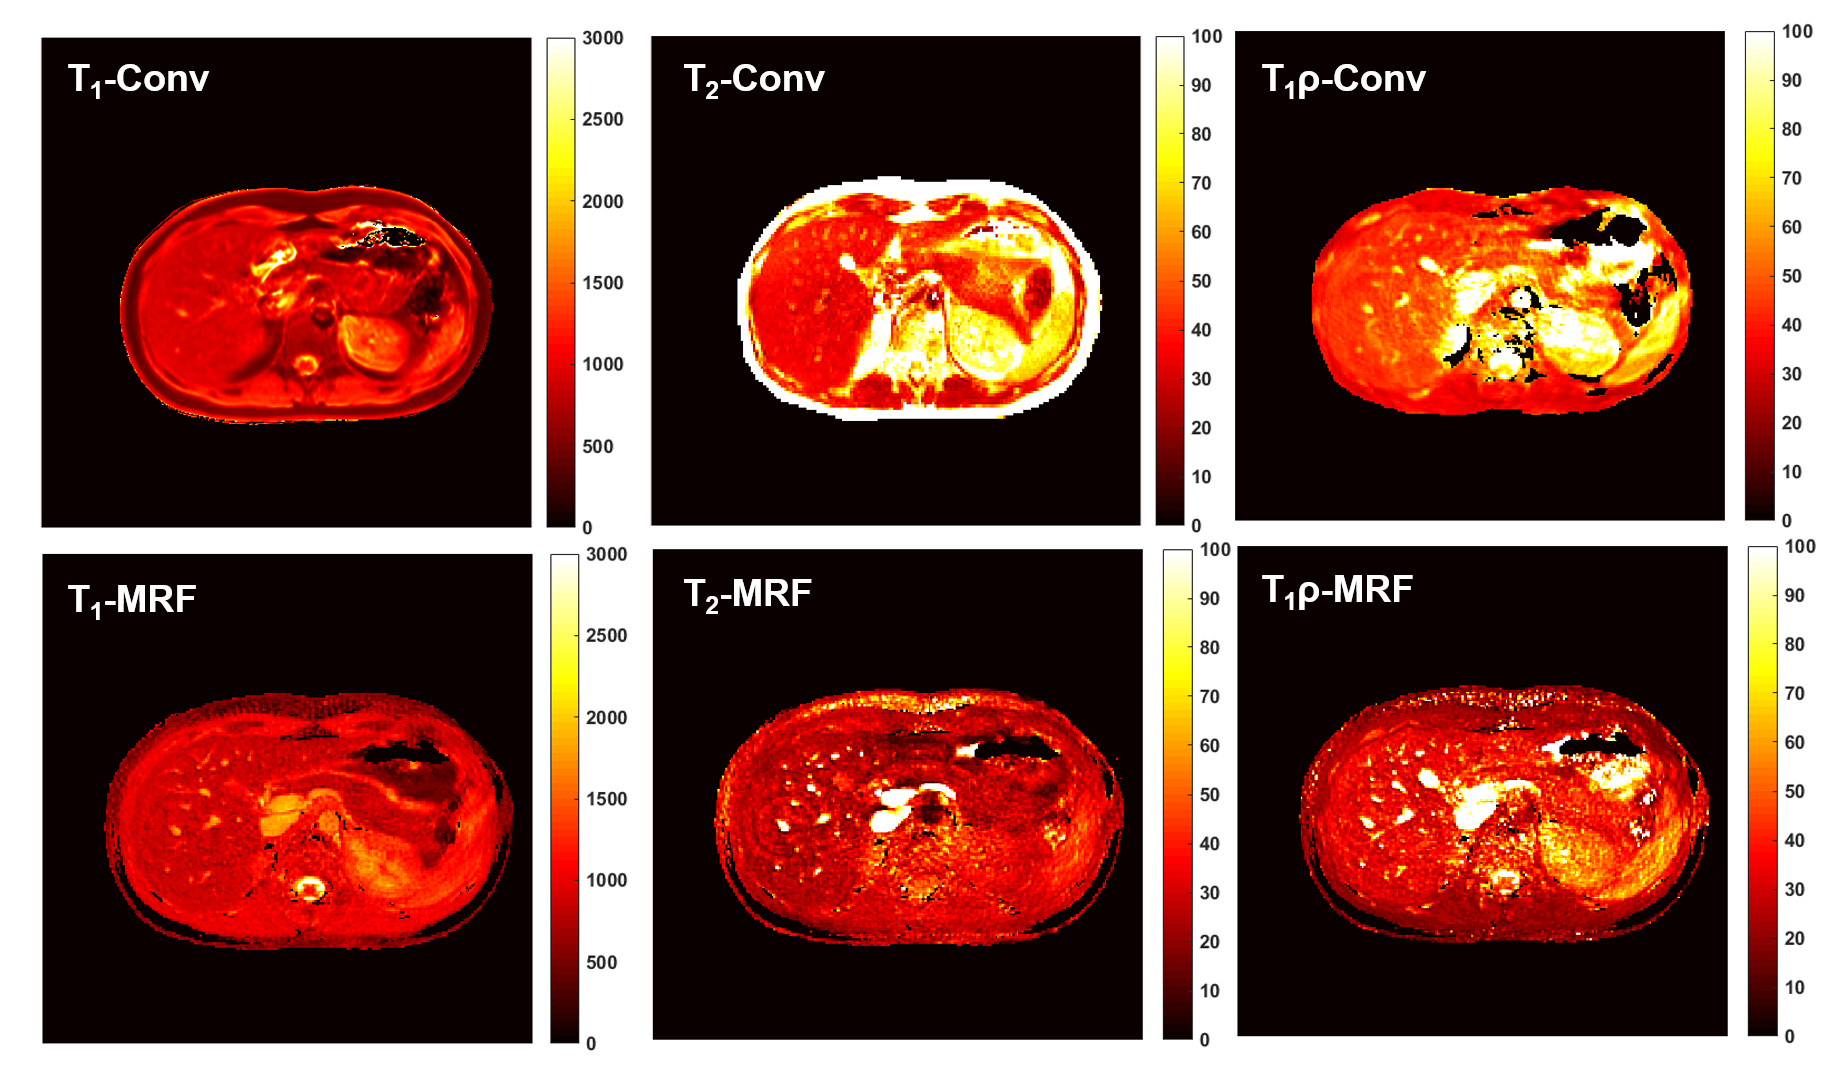
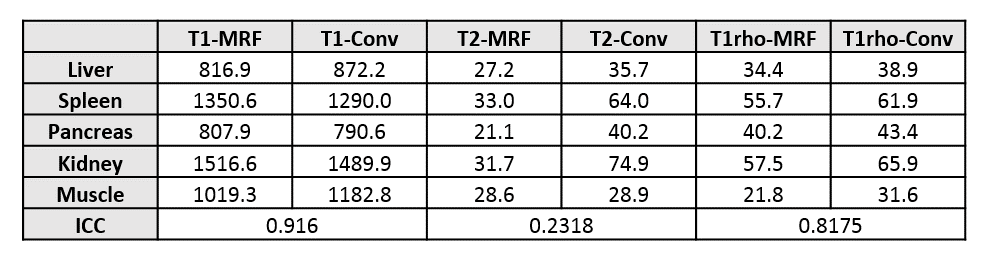
Comparisons between the mean T1, T2, and T1ρ values in phantoms for the MRF and conventional sequences are shown in Figure 3. The MRF and conventional T1, T2, and T1ρ quantitative maps for one healthy volunteer are shown in Figure 4. Mean values across several organs and the intraclass correlation coefficient (ICC) across all organs for each relaxation parameter are shown in Figure 5.Discussion
As seen in the phantom and the in vivo results, there is strong correlation between T1, T2, and T1ρ values using MRF and conventional techniques. However, while T2 correlates well between MRF and conventional in phantoms, the correlation is low in vivo, particularly in the kidneys and spleen. We speculate that is due to possible diffusion effects during the scan and also due to the inaccuracies that TSE sequences can have when measuring T2 relaxation. In addition, we see consistently higher T1ρ values compared to T2, which is expected.Conclusion
The proposed technique provides the ability to acquire T1, T2, and T1ρ maps quickly in one acquisition, with all images co-registered. The technique is low SAR compared to conventional methods and allows for correction of T1/T2 effects in T1ρ measurements, particularly T2ρ. There is also potential application in other areas of the body, including cartilage. Future work will focus on optimization of the technique, both in acquisition and reconstruction.Acknowledgements
Grant Support:This project was supported in part by a translational research grant from the V Foundation for Cancer Research and a development grant from the OHSU Advanced Imaging Research Center.References
[1] Ma, et al. Nature. 495. 187-192 March 2013. [2] Jiang, et al. MRM. 74:6 December 2015. [3] Li et al. JMRI 39:1287–1293 (2014) [4]Wang et al. Eur J Radiol. 2012 Sep;81(9):2329-36 [5]Chen et al. Magn Res Imaging 2018 Feb;46:75-80 [6] Berisha et al. PLoS One. 2016; 11(3) [7] Dixon, et al. MRM 3690-94 1996 [8] Chen, et al. Radiology. 2016 Apr;279(1):278-86.Figures