0555
Improved white matter response function estimation for 3-tissue constrained spherical deconvolution1The Florey Institute of Neuroscience and Mental Health, Melbourne, Australia, 2The Florey Department of Neuroscience and Mental Health, University of Melbourne, Melbourne, Australia
Synopsis
Multi-shell multi-tissue constrained spherical deconvolution (MSMT-CSD) and single-shell 3-tissue CSD (SS3T-CSD) decompose the diffusion MRI signal in a white matter (WM) fibre orientation distribution (FOD) and grey matter (GM) and cerebrospinal fluid (CSF) compartments. An unsupervised method was recently proposed to estimate the required WM/GM/CSF response functions. In this work, we improved WM response function estimation by leveraging WM properties across b-values, resulting in better 3-tissue CSD fit to most data. Slightly beyond the scope of this work, we also make an interesting observation in developing Human Connectome Project data.
Purpose
Multi-shell multi-tissue constrained spherical deconvolution (MSMT-CSD)[1] and single-shell 3-tissue CSD (SS3T-CSD)[2,3] decompose the diffusion MRI (dMRI) signal in separate tissue contributions; typically a white matter (WM) fibre orientation distribution (FOD) and grey matter (GM) and cerebrospinal fluid (CSF) compartments. In [3], an unsupervised method was proposed to estimate single-fibre (SF)-WM/GM/CSF response functions required for these deconvolution methods directly from the dMRI dataset itself. While more accurate[3,4] than previous strategies for GM/CSF response estimation, it still relies on an older method for SF-WM response estimation[5], designed for (single-shell) single-tissue CSD[6].
We propose an improved response estimation strategy that optimises the SF-WM response function over all b-values at once (including b=0), taking into account a multi-tissue context. We evaluate its performance by assessing the resulting 3-tissue CSD fit for multi-shell adult, single-shell baby and multi/single-shell neonatal data.
Data and Preprocessing
- Adult: multi-shell dMRI data from 27 year old healthy female, acquired on Siemens 3T Skyra: b=0,1000,2000,3000s/mm² for 16,30,45,60 gradient directions, voxel-size 2.5×2.5×2.5mm³
- Baby: single-shell dMRI data from 5 month old normally developing baby, acquired on Siemens 3T Trio: b=0,3000s/mm² for 8,60 gradient directions, voxel-size 2.5×2.5×2.5mm³
- Neonate: multi-shell dMRI data from 3 day old neonate (gestational age at birth/scan = 39.14 / 39.57 weeks), downloaded from developing Human Connectome Project (dHCP)[7] data release 1.1; acquired on Philips 3T Achieva: b=0,400,1000,2600s/mm² for 20,64,88,128 gradient directions, voxel-size 1.17×1.17×1.5mm³
The adult and baby data were denoised[8], corrected for Gibbs-ringing[9], motions/distortions[10,11], bias-fields[12]; using MRtrix3[13], FSL[14], ANTs[15].
The dHCP neonate data were preprocessed using an optimised pipeline[16]. We also considered the b=0,1000s/mm² subset as a separate single-shell dataset.
Methods
Fig.1 illustrates the main steps of the new method. First, an initial tissue segmentation is performed (as in [3]). Next, we compute a novel SF-WM tissue metric. To this end, we designed an artificial "extreme" SF-WM response function in zonal spherical harmonics (ZSH) representation: DC terms across all b-values are constant ("no average signal decay"); other terms for b=0 are zero (isotropic b=0); other even order ZSH terms for each b≠0 shell alternate negative/positive constants (ZSH projection of "flattest disk", i.e., highest anisotropy). Then, we perform 2-tissue CSD using this "extreme" SF-WM response and CSF response from the dataset itself. Next, (crucial for this metric) we normalise the resulting WM-FODs by total WM+CSF, obtaining WM tissue signal fraction ODFs. The final metric equals the maximum peak amplitude of each ODF. The metric promotes the aforementioned WM properties, and SF geometry, while penalising isotropic free ("CSF-like") diffusion. For robustness, balance and speed, we first compute the metric using ZSH Lmax=2 in all WM. We select an initial 1% best voxels, compute the metric in (only) those voxels using Lmax=6, and select the final 0.5% (of WM) best voxels.
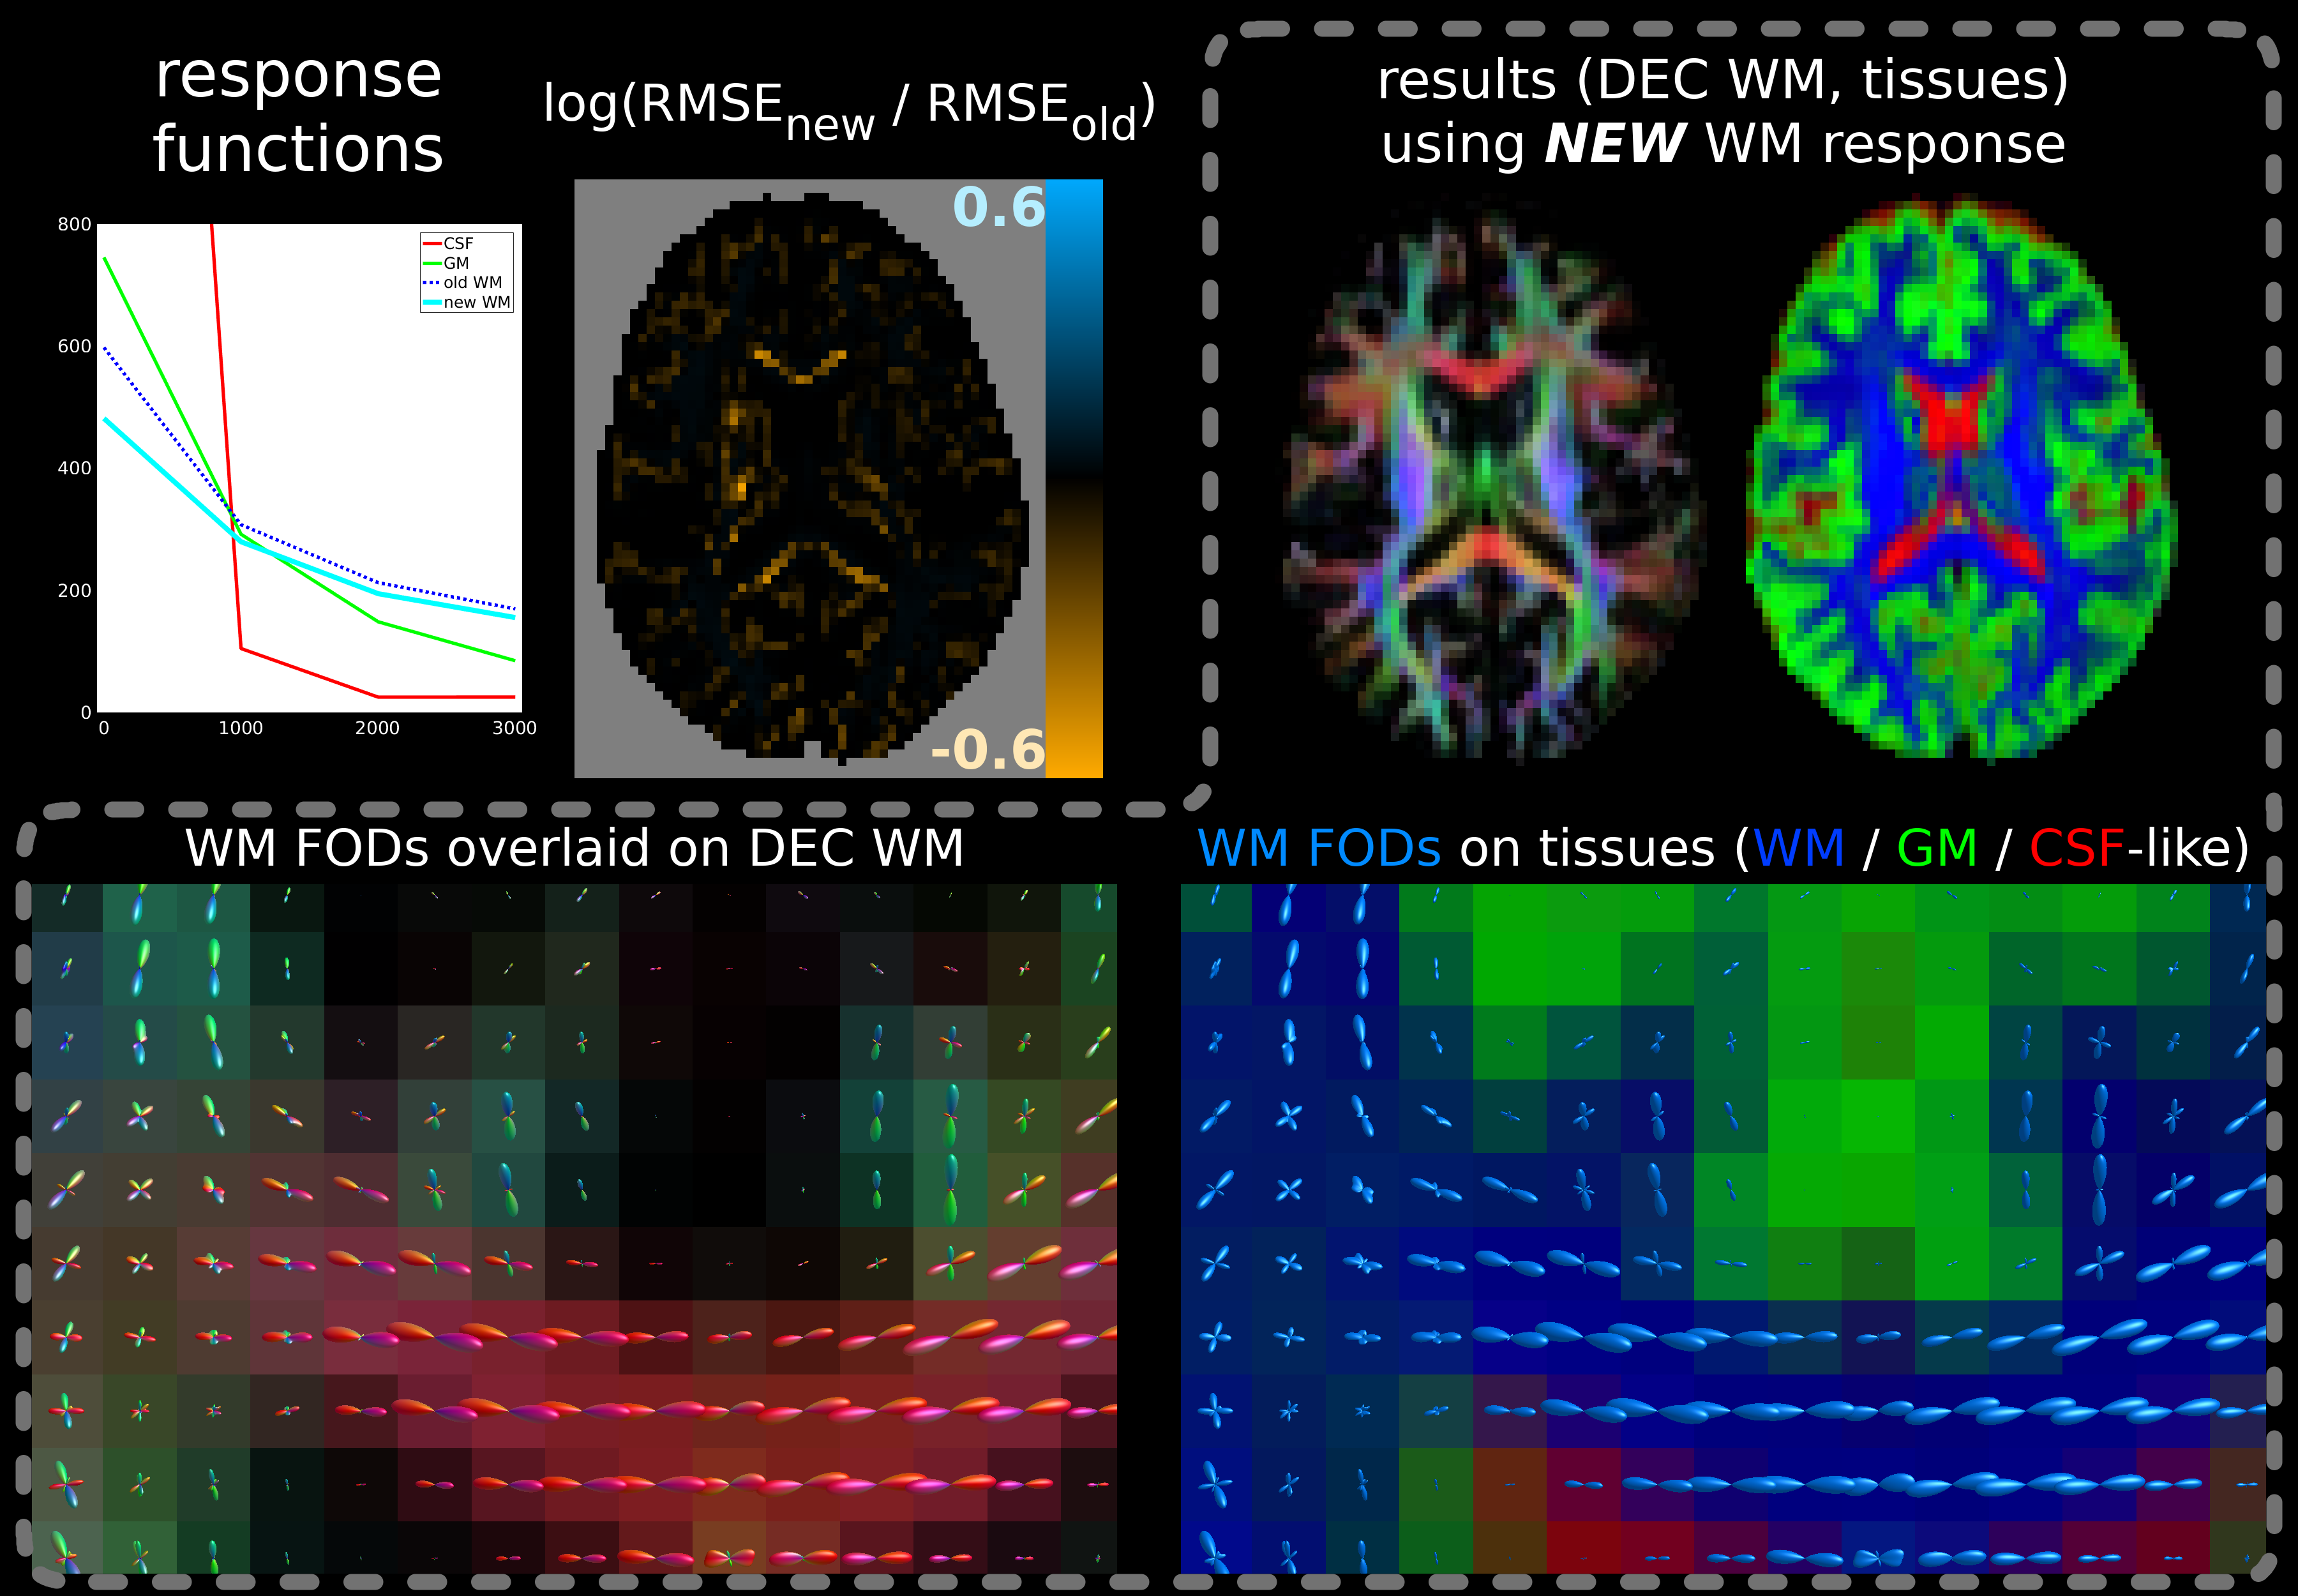
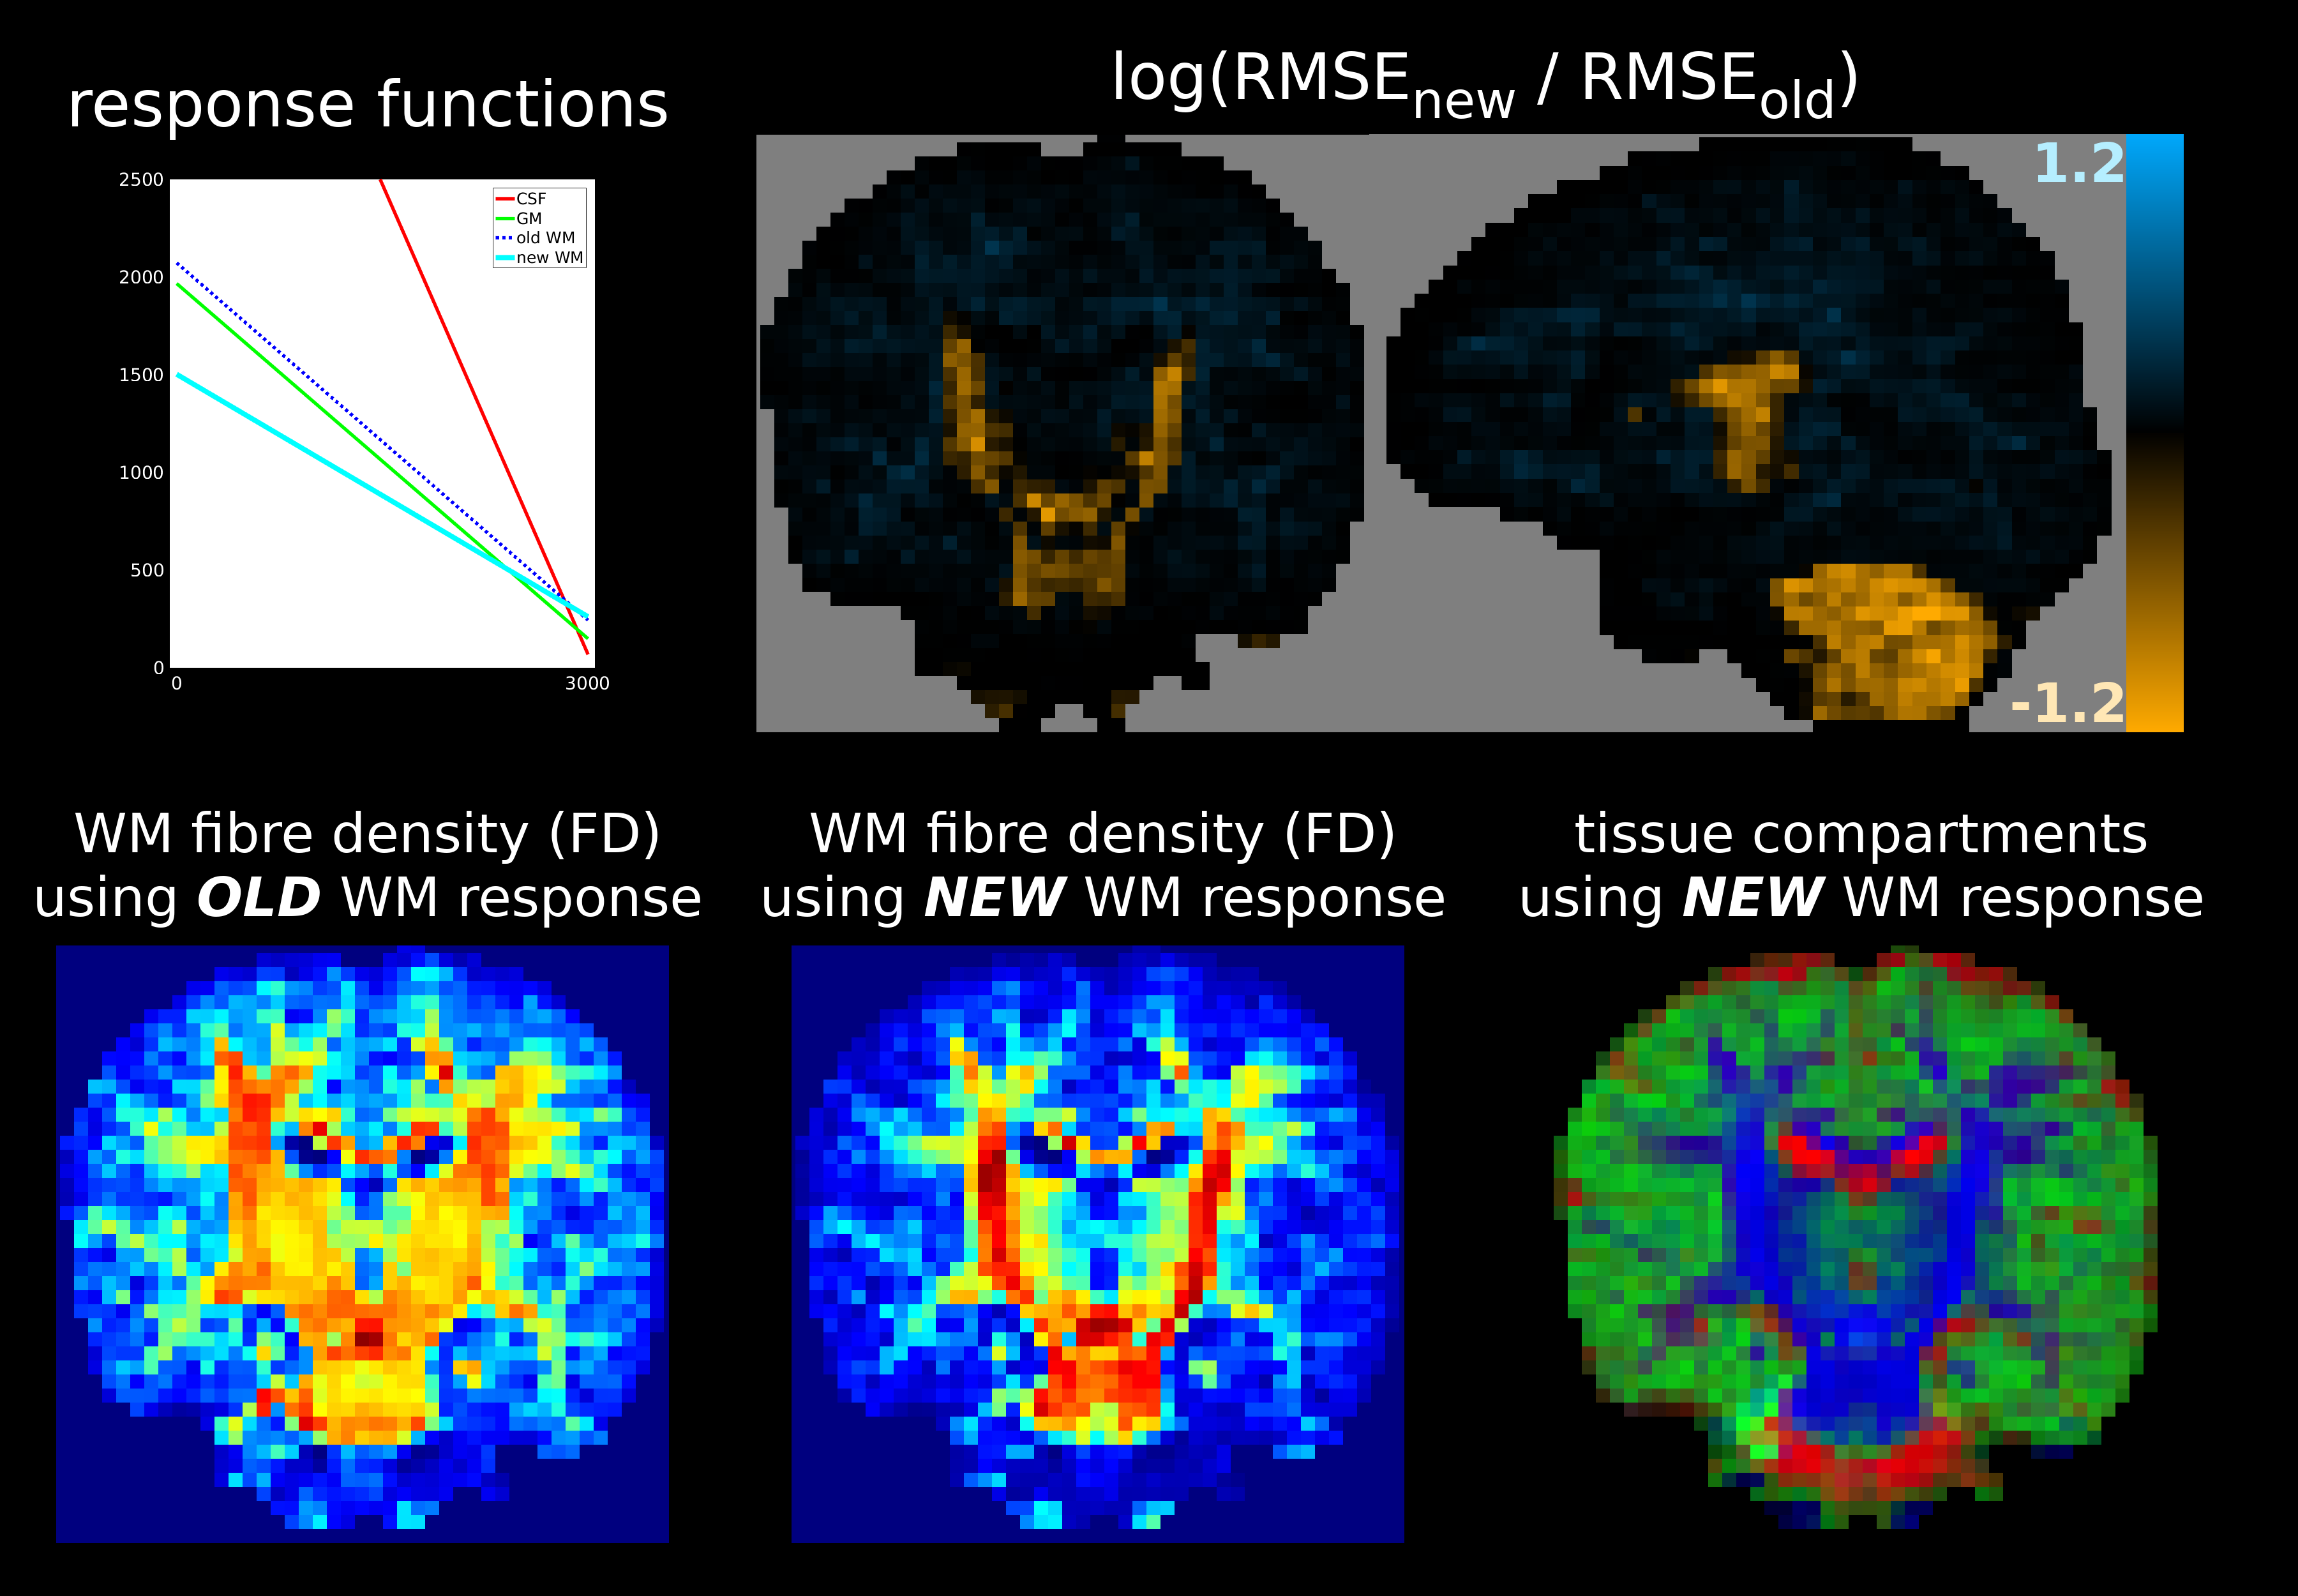
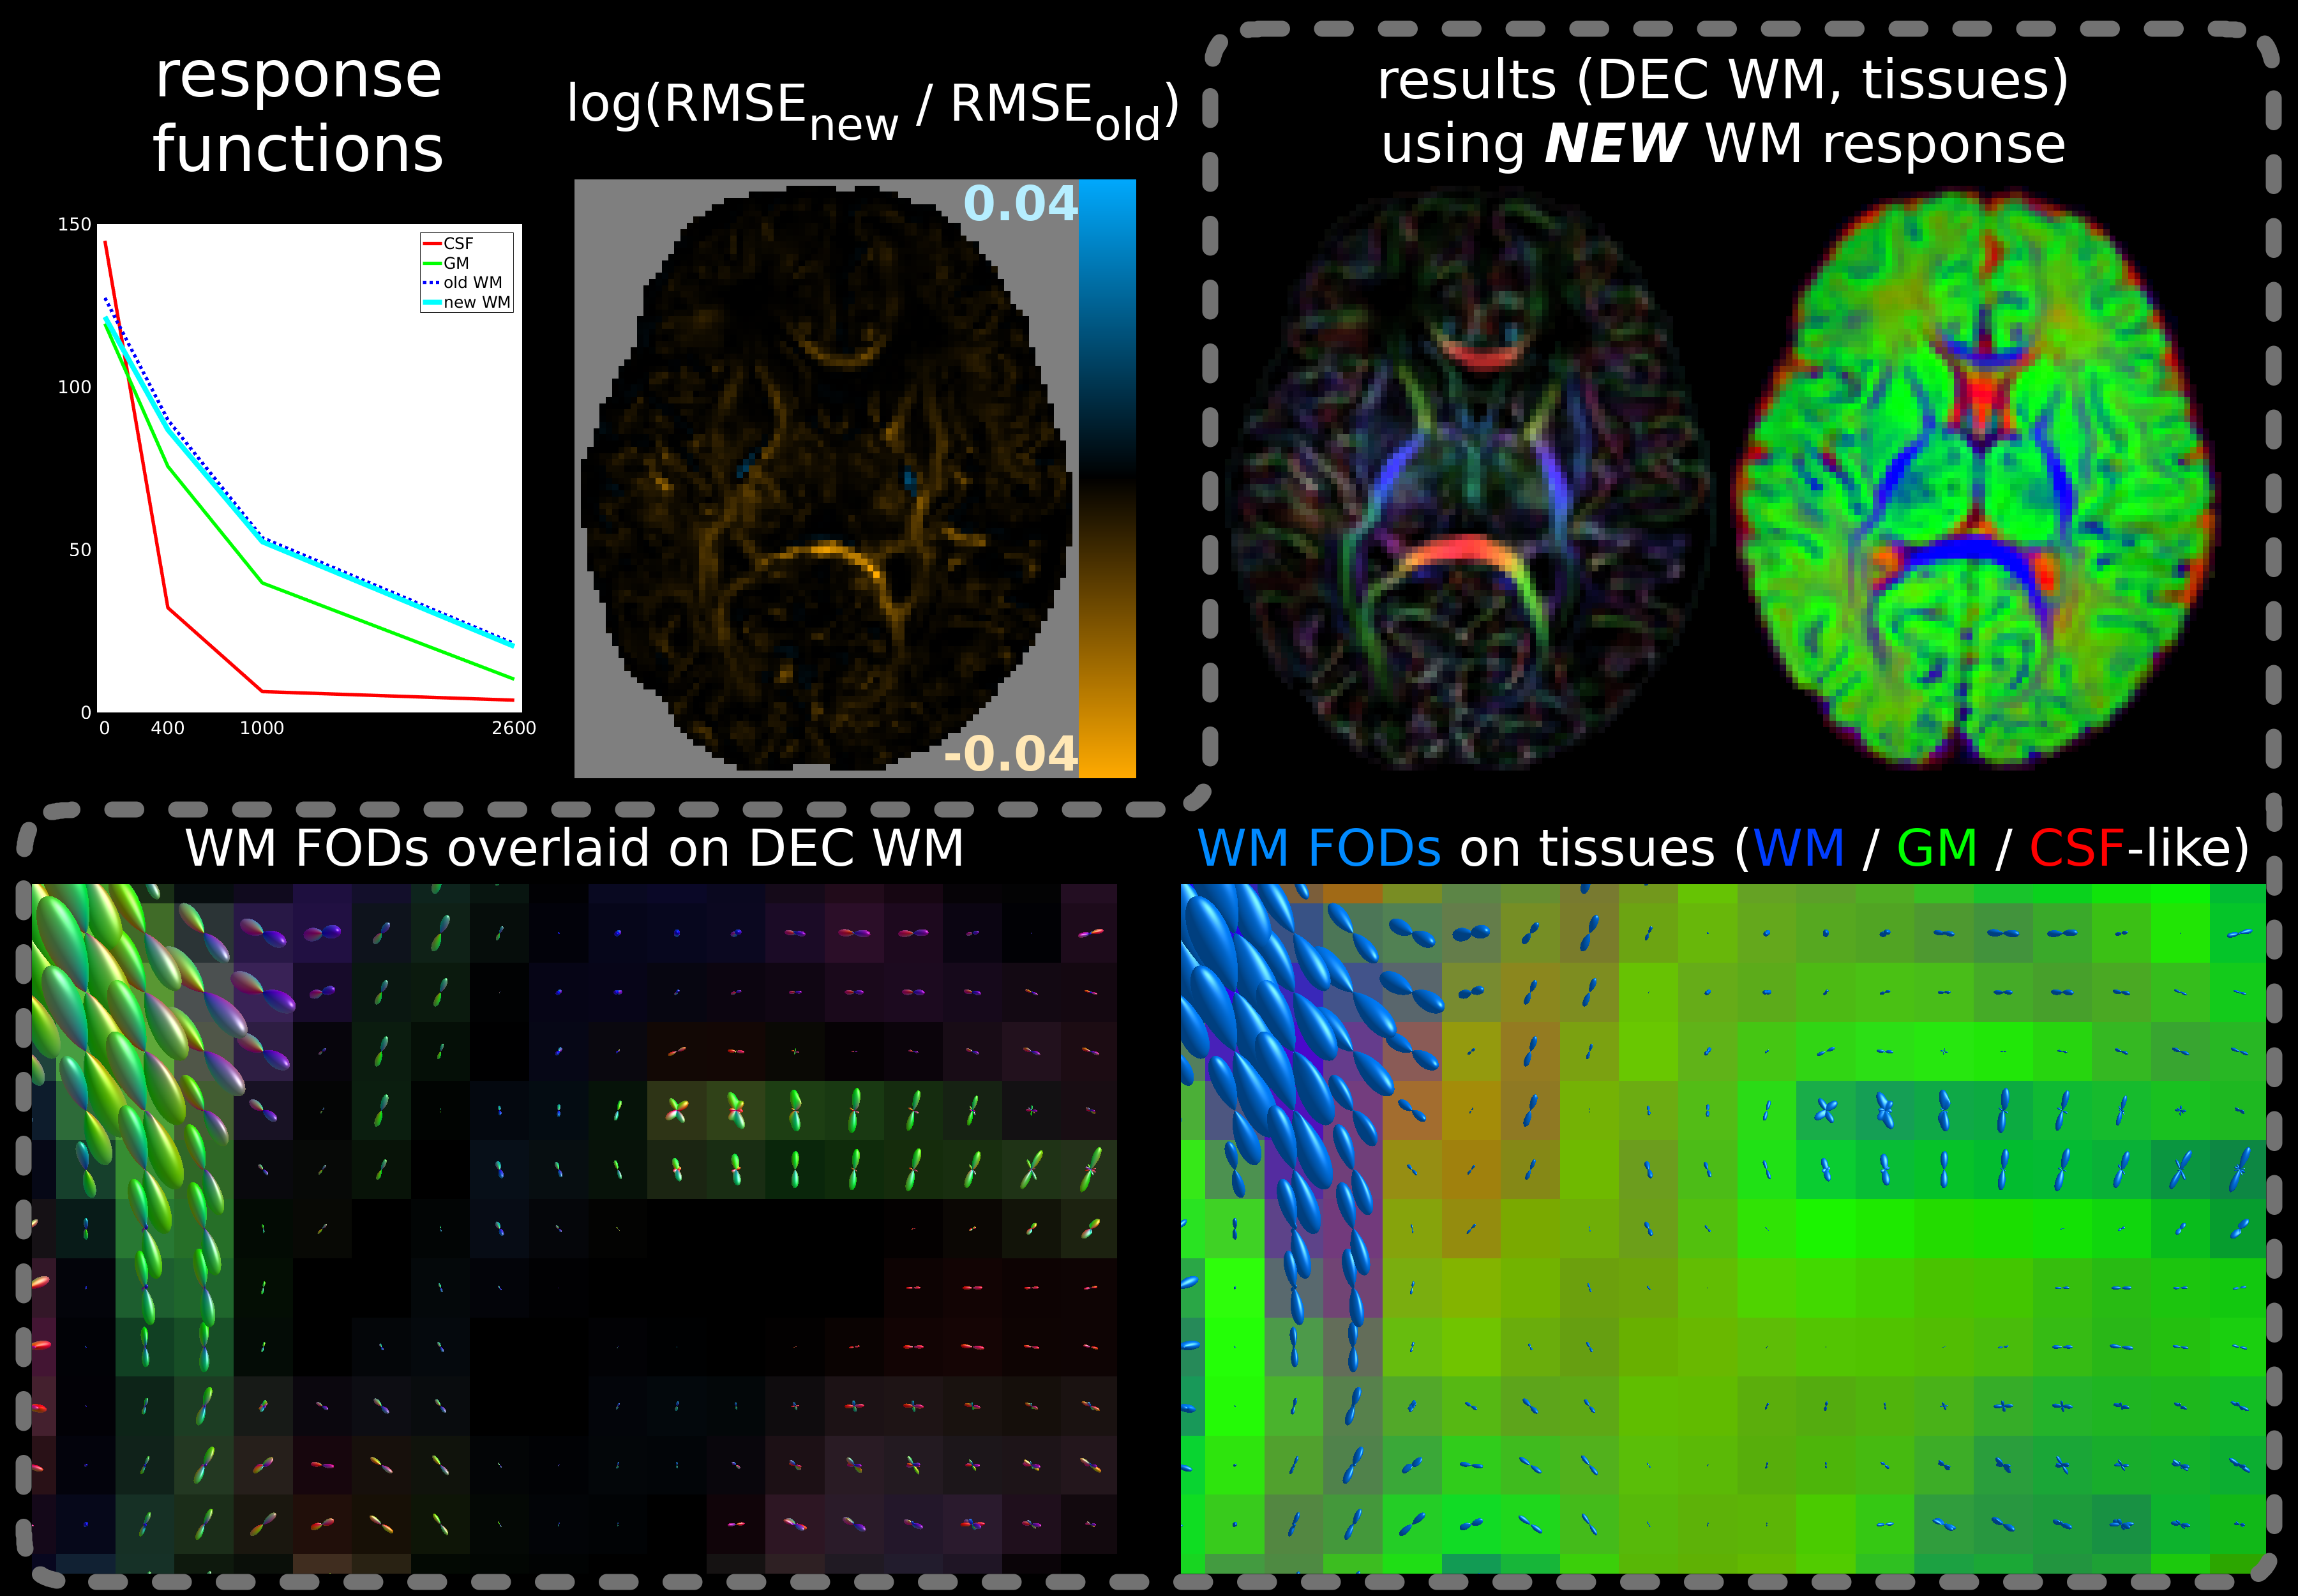
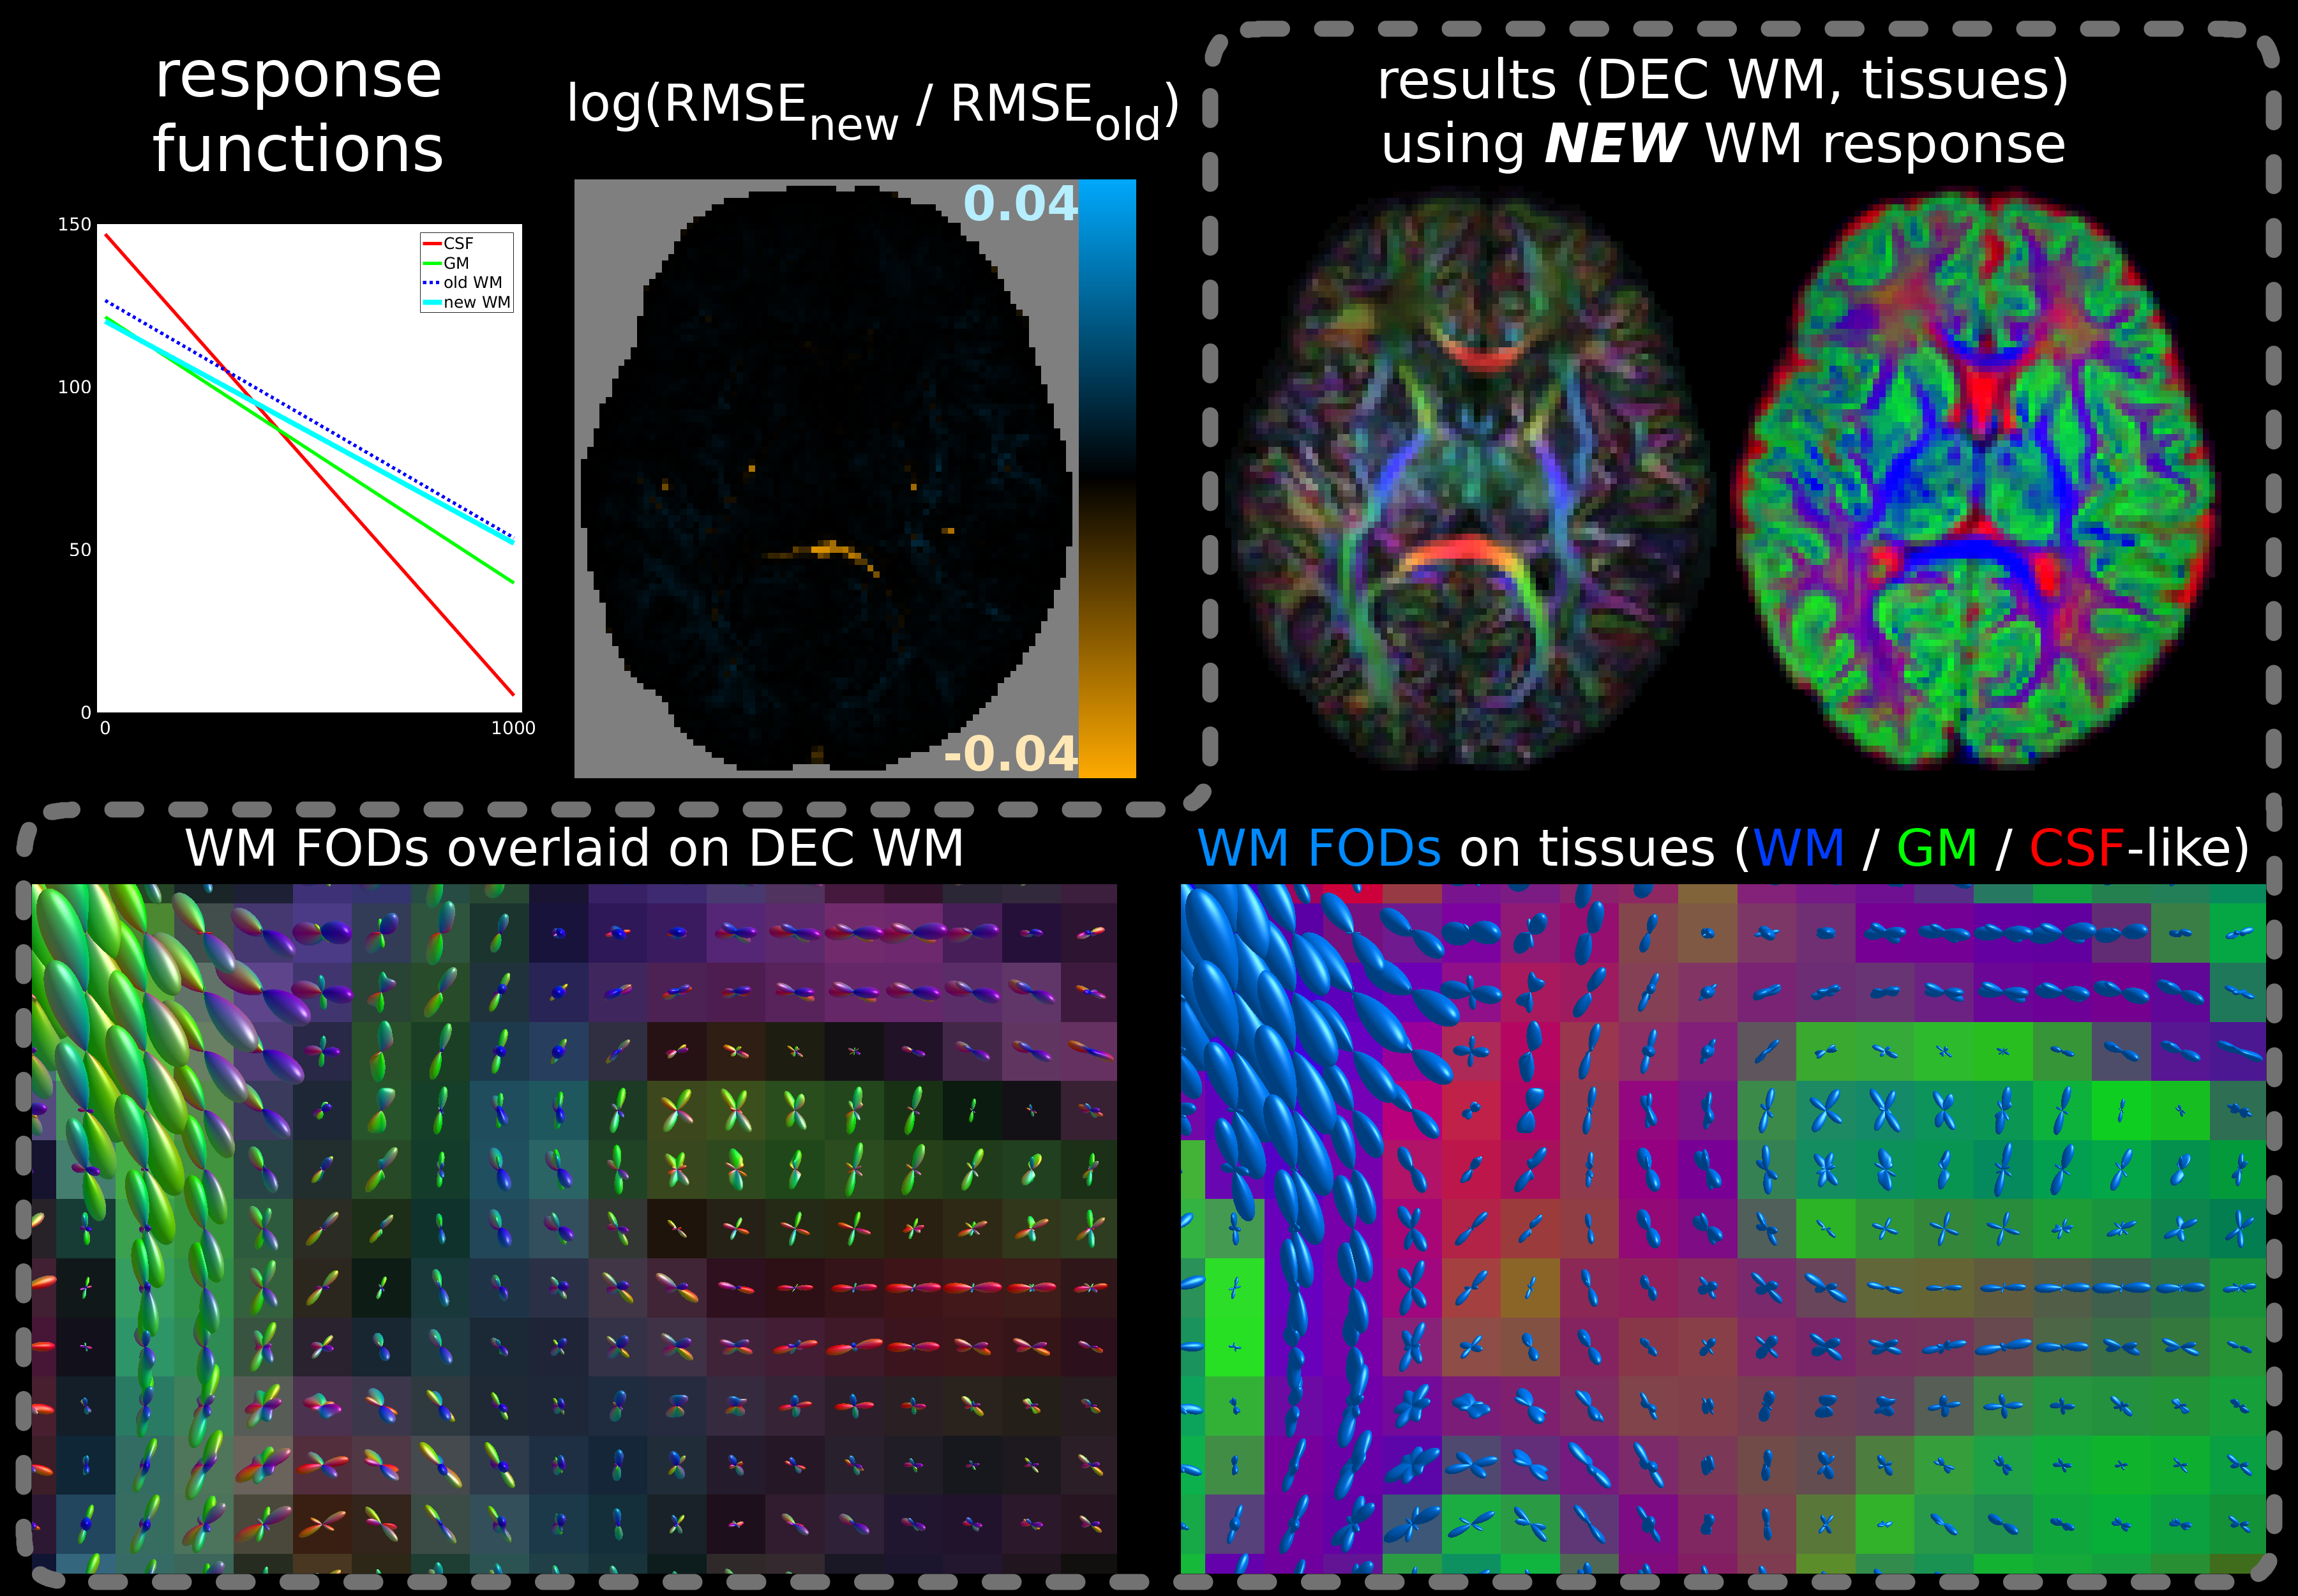
We compare the resulting response functions with those obtained using the old method[3,5], and compare/quantify the 3-tissue CSD fits using log(RMSEnew / RMSEold), where RMSE is the root-mean-square error.
Results and Discussion
Results are shown in Figs.2-5. While the shapes of the angular profiles of the SF-WM response functions (not shown) are similar between both methods, the b-value dependent signal profile from the new method consistently shows less decay.
This results in better 3-tissue CSD fit (i.e., lower log(RMSEnew / RMSEold)) in the most coherent/restricted WM environments: their (least) decaying profiles are not contained in the 3-tissue spectrum offered by the old method. Improvements vary, but reach new RMSE values decreased to less than exp(-0.6)≈55% of old RMSE values for adult data (Fig.2) and even to exp(-1.2)≈30% for baby data (Fig.3), i.e., 3× smaller RMSE. The latter comes at the cost of slightly reduced fit in other areas, yet of far lesser magnitude. In the baby data, the impact on fibre density (FD) is substantial, even resulting in visual changes to contrast (Fig.3).
For the multi-shell neonatal data, the difference in SF-WM response functions is smaller and while the fit is improved across most WM, new RMSE values are only decreased little (Fig.4). However, either fit has difficulties separating GM from WM in crossing tract areas; possibly due to very low signal-to-noise ratio at b=2600s/mm² and/or low angular contrast at b=400s/mm². This motivated our separate b=0,1000s/mm² single-shell subset selection. The difference between MSMT-CSD (Fig.4) and SS3T-CSD (Fig.5) fit outcome is substantial: SS3T-CSD resolves WM crossing areas (with varying free-water content) effortlessly and overall separates the GM well from other tissue. This was previously considered impossible for this dataset[17]. The explanation is beyond the scope of this abstract though[18].
Conclusion
We improved WM response function estimation by leveraging WM properties across b-values, resulting in better 3-tissue CSD fit to most data.Acknowledgements
No acknowledgement found.References
[1] Jeurissen B, Tournier JD, Dhollander T, Connelly A, Sijbers J. Multi-tissue constrained spherical deconvolution for improved analysis of multi-shell diffusion MRI data. NeuroImage 2014;103:411-426.
[2] Dhollander T, Connelly A. A novel iterative approach to reap the benefits of multi-tissue CSD from just single-shell (+b=0) diffusion MRI data. Proc ISMRM 2016;24:3010.
[3] Dhollander T, Raffelt D, Connelly A. Unsupervised 3-tissue response function estimation from single-shell or multi-shell diffusion MR data without a co-registered T1 image. Proc ISMRM Workshop on Breaking the Barriers of Diffusion MRI 2016:5.
[4] Dhollander T, Raffelt D, Connelly A. Accuracy of response function estimation algorithms for 3-tissue spherical deconvolution of diverse quality diffusion MRI data. Proc ISMRM 2018;26:1569.
[5] Tournier JD, Calamante F, Connelly A. Determination of the appropriate b value and number of gradient directions for high-angular-resolution diffusion-weighted imaging. NMR Biomed 2013;26(12):1775-1786.
[6] Tournier JD, Calamante F, Connelly A. Robust determination of the fibre orientation distribution in diffusion MRI: Non-negativity constrained super-resolved spherical deconvolution. NeuroImage 2007;35(4):1459-1472.
[7] http://www.developingconnectome.org
[8] Veraart J, Fieremans E, Novikov DS. Diffusion MRI noise mapping using random matrix theory. Magn Reson Med 2016;76(5):1582-1593.
[9] Kellner E, Dhital B, Kiselev VG, Reisert M. Gibbs-ringing artifact removal based on local subvoxel-shifts. Magn Reson Med 2016;76(5):1574-1581.
[10] Andersson JLR, Skare S, Ashburner J. How to correct susceptibility distortions in spin-echo echo-planar images: application to diffusion tensor imaging. NeuroImage 2003;20(2):870-888.
[11] Andersson JLR, Xu J, Yacoub E, Auerbach E, Moeller S, Ugurbil K. A comprehensive Gaussian Process framework for correcting distortions and movements in diffusion images. Proc ISMRM 2012;20:2426.
[12] Tustison NJ, Avants BB, Cook PA, Zheng Y, Egan A, Yushkevich PA, Gee JC. N4ITK: Improved N3 bias correction. IEEE TMI 2010;29(6):1310-1320.
[13] http://www.mrtrix.org
[14] Jenkinson M, Beckmann CF, Behrens TE, Woolrich MW, Smith SM. FSL. NeuroImage 2012;62(2):782-790.
[15] http://stnava.github.io/ANTs
[16] Bastiani M, Andersson JLR, Cordero-Grande L, Murgasova M, Hutter J, Price AN, Makropoulos A, Fitzgibbon SP, Hughes E, Rueckert D, Victor S, Rutherford M, Edwards AD, Smith SM, Tournier JD, Hajnal JV, Jbabdi S, Sotiropoulos SN. Automated processing pipeline for neonatal diffusion MRI in the developing Human Connectome Project. NeuroImage 2018 (in press).
[17] Pietsch M, Christiaens D, Hutter J, Cordero-Grande L, Price AN, Hughes E, Edwards D, Hajnal JV, Counsell S, Tournier JD. A framework for multi-component analysis of diffusion MRI data over the neonatal period. NeuroImage 2018 (in press).
[18] Jbabdi S, Sotiropoulos SN, Savio AM, Graña M, Behrens TE. Model-based analysis of multishell diffusion MR data for tractography: how to get over fitting problems. Magn Reson Med 2012;68(6):1846-1855.
Figures
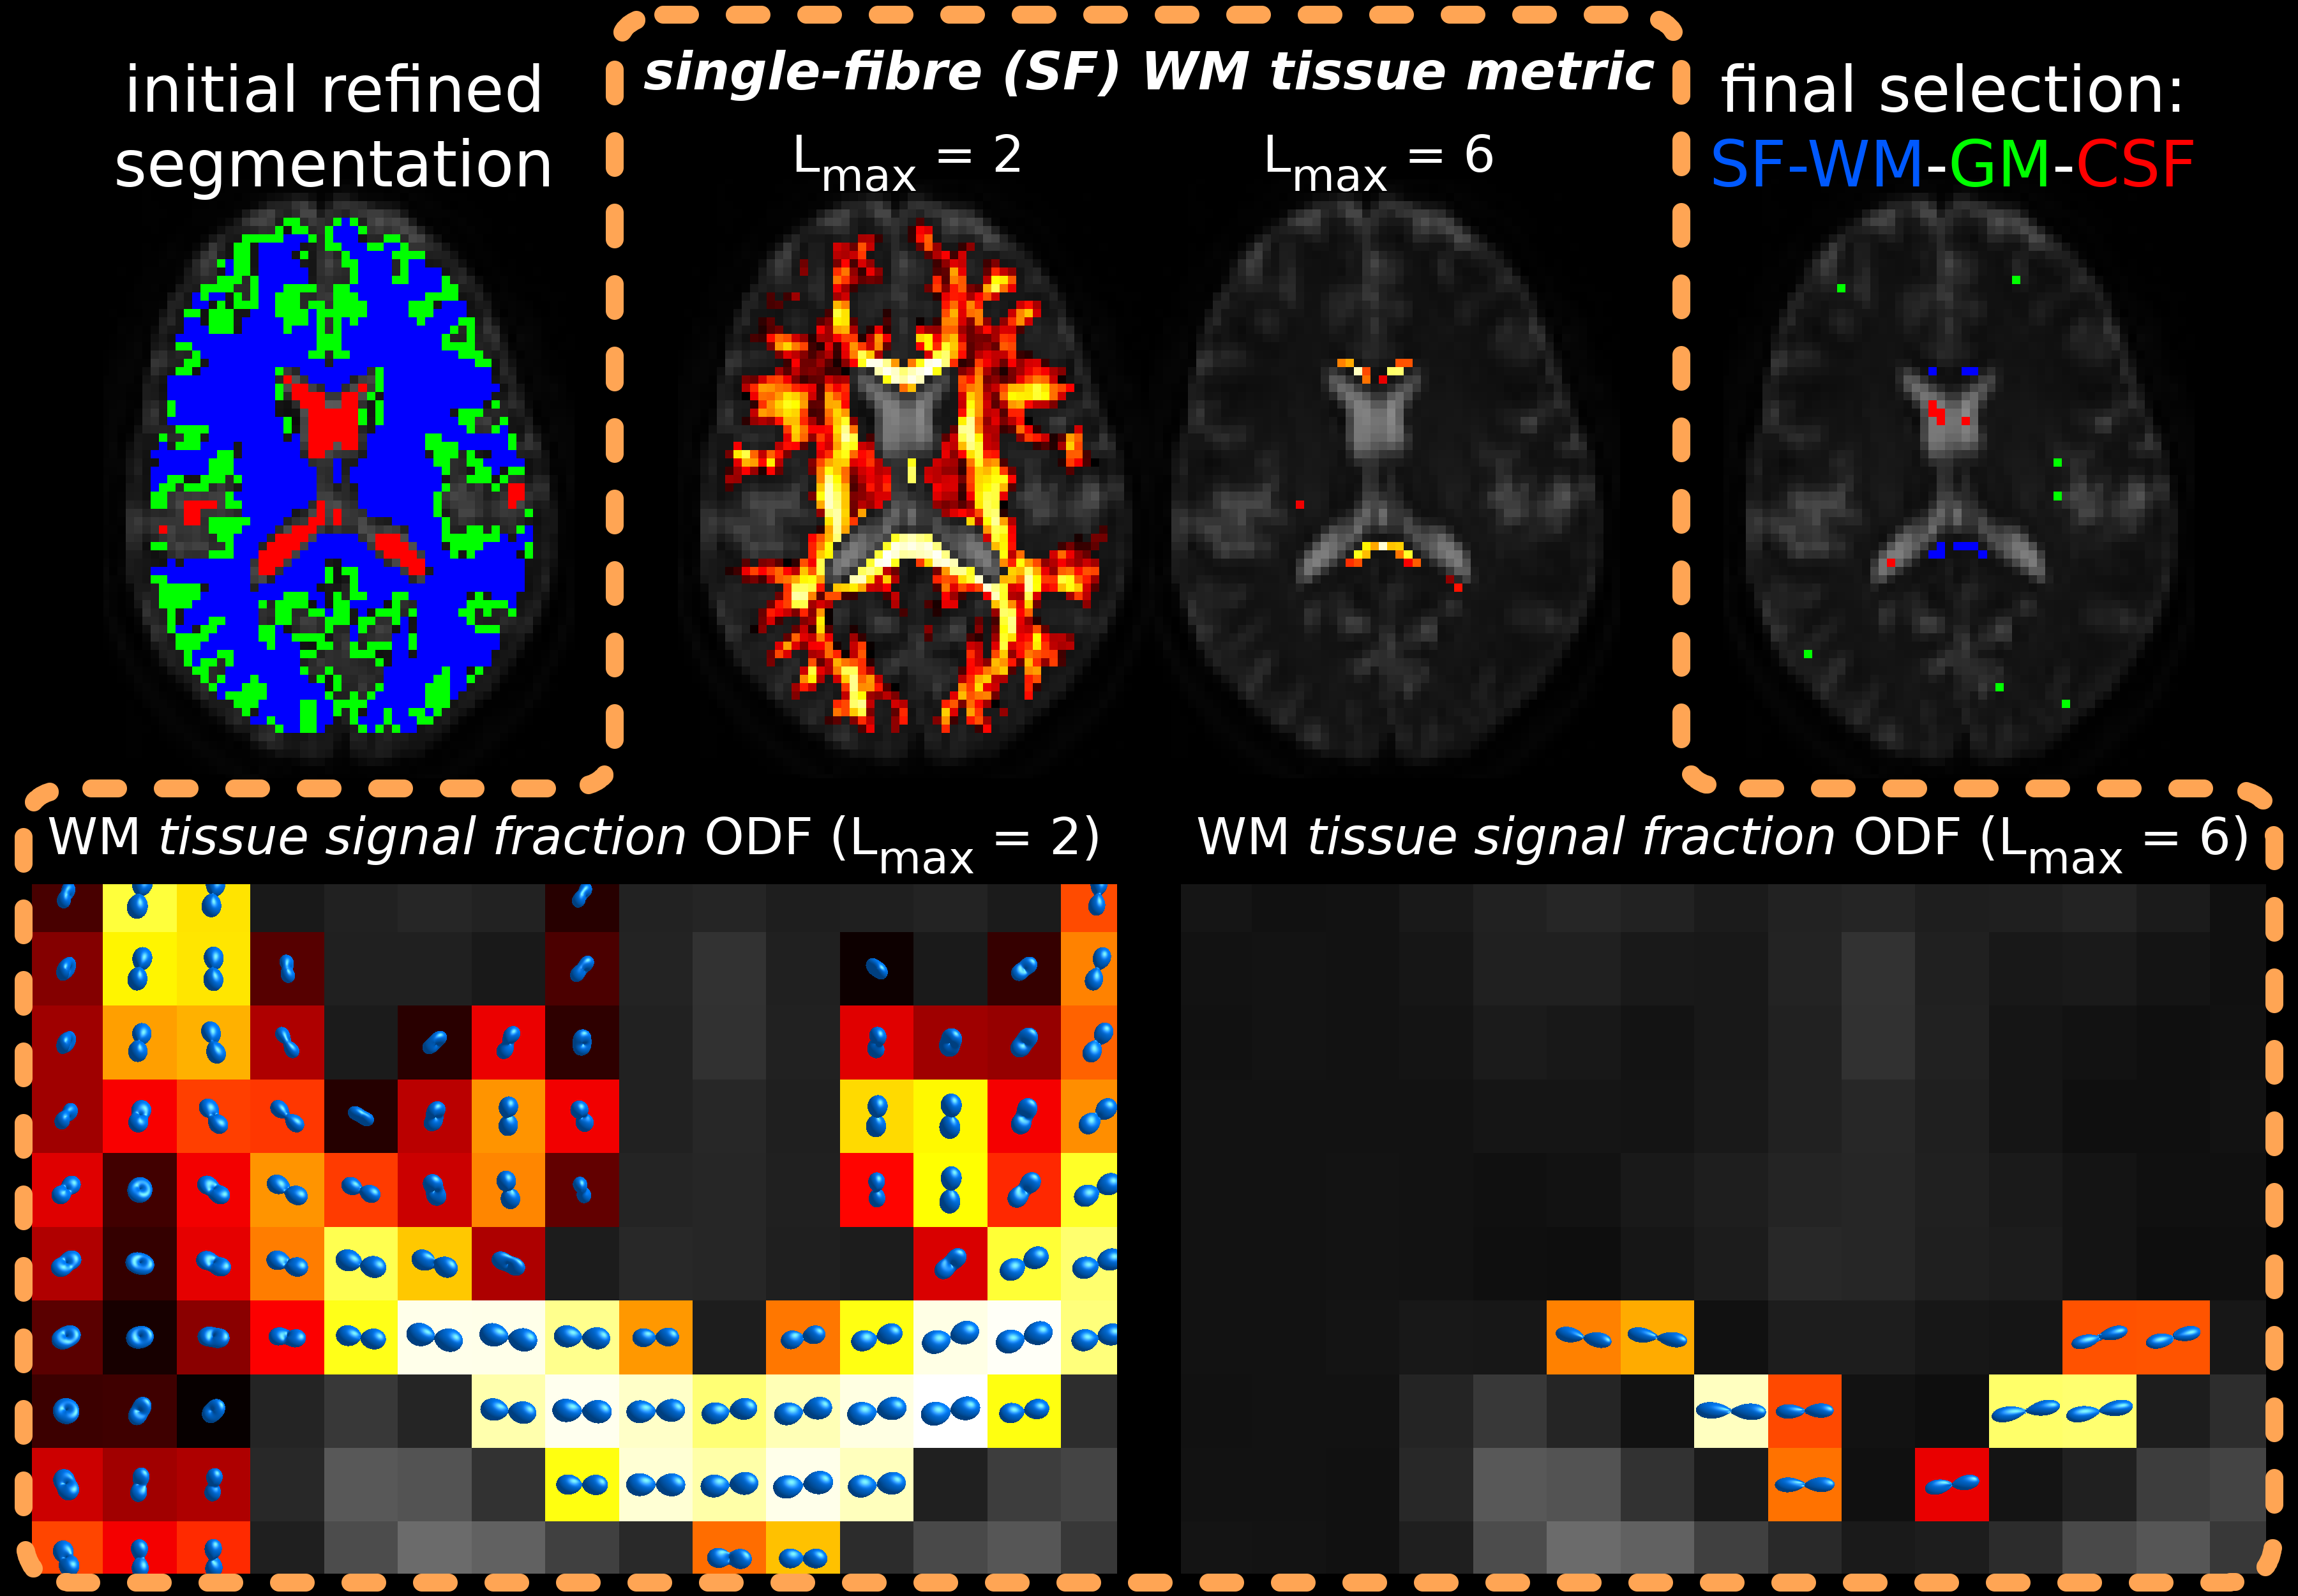
Fig.1: main steps of the method are shown along the top row:
- initial refined segmentation
- SF-WM tissue metric for all WM voxels at Lmax=2
- SF-WM tissue metric for top 1% WM voxels at Lmax=6
- final voxel selection (0.5% of WM, 2% of GM, 10% of CSF).
The bottom row shows the WM tissue signal fraction ODFs (normalised by total WM+CSF) for Lmax=2 and 6, from which both respective SF-WM tissue metrics are derived directly as the maximum peak amplitude. This promotes optimal WM properties (less signal decay, more anisotropy), and SF geometry, while penalising isotropic free ("CSF-like") diffusion.