0538
Hyperoxia calibrated fMRI for dynamic mapping of CMRO2 responses using MR-based measurements of whole-brain Yv: Comparison to standard calibration models and measurement of CMRO2 response to finger tapping1Department of Radiology, University of Pennsylvania, Philadelphia, PA, United States, 2Department of Radiology, University of Navarra, Pamplona, Spain, 3Department of Neurology, University of Pennsylvania, Philadelphia, PA, United States
Synopsis
The magnitude of neurometabolic responses to stimuli can be quantified using calibrated fMRI. Here we compare existing calibration models to Yv-based calibration. The Yv-based calibration model measures whole-brain venous oxygen saturation in the superior sagittal sinus along with BOLD changes and ASL-measured CBF changes to derive maps of the calibration constant, M, in response to a hyperoxia stimulus. M-maps were compared between the proposed and existing calibration models. Then, relative CMRO2 changes in response to a finger tapping task were computed based on the derived M-maps. A ~19% increase in CMRO2 in the motor cortex was observed.
Background and Motivation
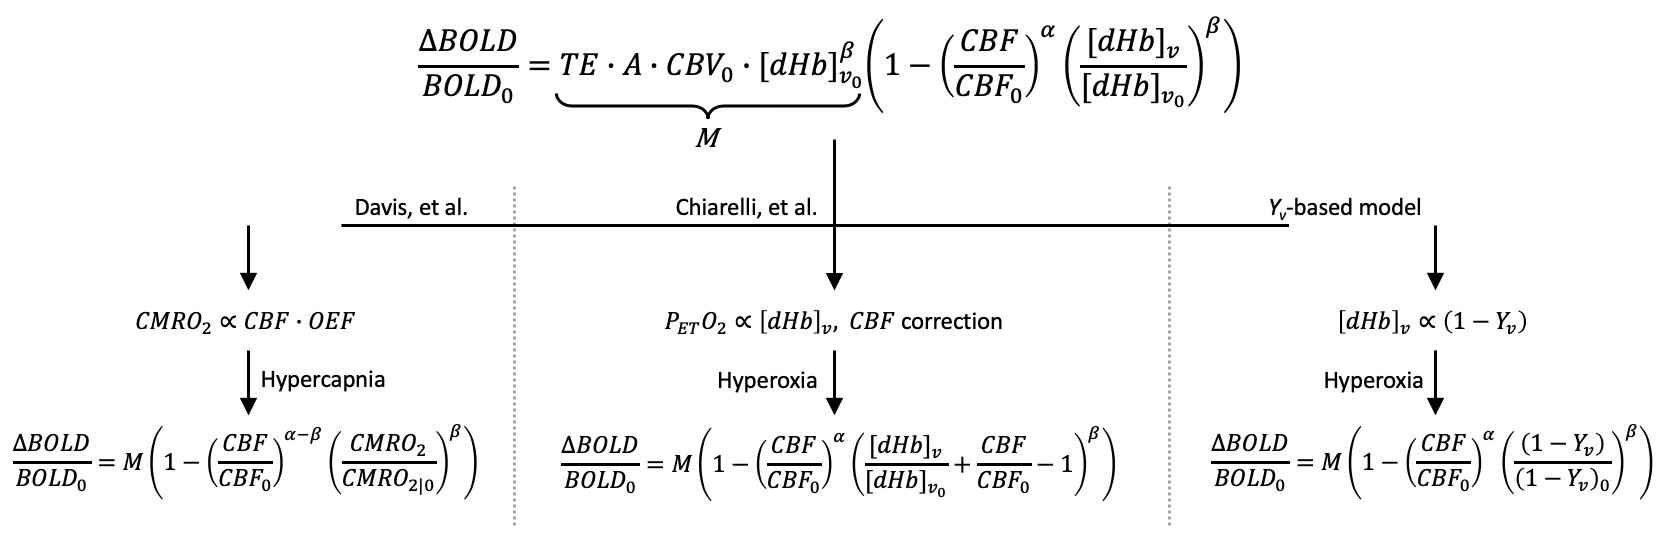
Calibrated fMRI permits quantification of changes in the cerebral metabolic rate of oxygen (CMRO2) due to a stimulus by first determining the relationship between cerebral blood flow (CBF), oxygen metabolism, and BOLD signal changes1:
$$$\frac{\Delta BOLD}{BOLD_0}=M\left(1- \left(\frac{CBF}{CBF_0}\right)^\alpha\left(\frac{[dHb]_v}{[dHb]_{v_0}}\right)^\beta\right)$$$ [1]
where M is the sequence and subject-specific calibration factor, representing the maximum BOLD signal change with full washout of deoxyhemoglobin ([dHb]), subscripts (0) represent the baseline condition relative to stimulus condition (no subscript), α (=0.18) relates CBF to cerebral blood volume, and β (=1.5) reflects relative intra- and extra-vascular BOLD signal contributions2,3. To solve for M, a calibration experiment is performed in which BOLD and CBF (quantified via arterial spin labeling, ASL) or [dHb] are simultaneously measured during an isometabolic stimulus (typically hypercapnia or hyperoxia gas breathing). Two accepted calibration strategies include the Davis, et al. model, which uses hypercapnia as a stimulus1, and a hyperoxia-based model proposed by Chiarelli, et al.4 Previously, we proposed the use of Yv-based calibration5 in which MR data are used to quantify venous oxygen saturation (Yv) in the superior sagittal sinus (SSS)6,7. Figure 1 summarizes the models. With the Yv-based calibration model, all parameters are determined from MR data (no external monitoring is required), and the calibration constant M is determined with fewer assumptions and reduced noise sensitivity compared to existing models.
Here, an interleaved, ASL, BOLD, and multi-echo GRE sequence, termed “OxBOLD”, is used to:
- Compare M-maps based on conventional and proposed (Yv-based) calibration models.
- Demonstrate the ability to quantify changes in CMRO2 in response to a finger tapping paradigm.
Methods
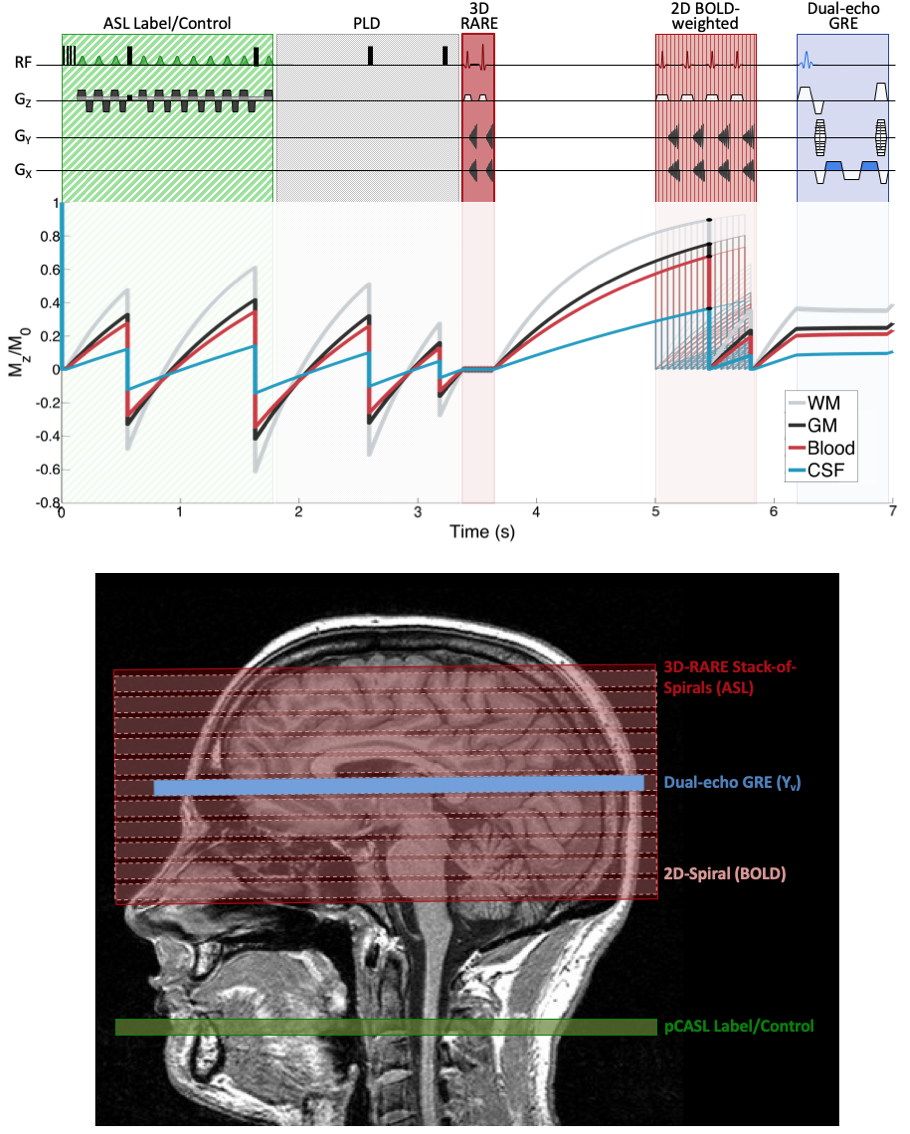
In this IRB-approved study, data were acquired at 3T in ten subjects (30.0±4.6 years, 5 male) during baseline (normocapnia/normoxia), hyperoxia, and hypercapnia conditions with OxBOLD, a 3-part interleaved sequence comprising background-suppressed 3D-RARE stack-of-spirals pCASL8, 2D BOLD-weighted spiral, and dual-echo GRE acquisitions (Figure 2). Sequence parameters include: ASL/BOLD FOV=240×240 mm2, with FOVz (or pack extent)=80 mm, ASL labeling duration/PLD=1.8/1.5s, BOLD TE=29ms; single-slice GRE data acquired near the straightest portion of the SSS with ∆TE=3.52ms; overall TR=7s, thus one ASL tag-control pair is obtained every 14s.
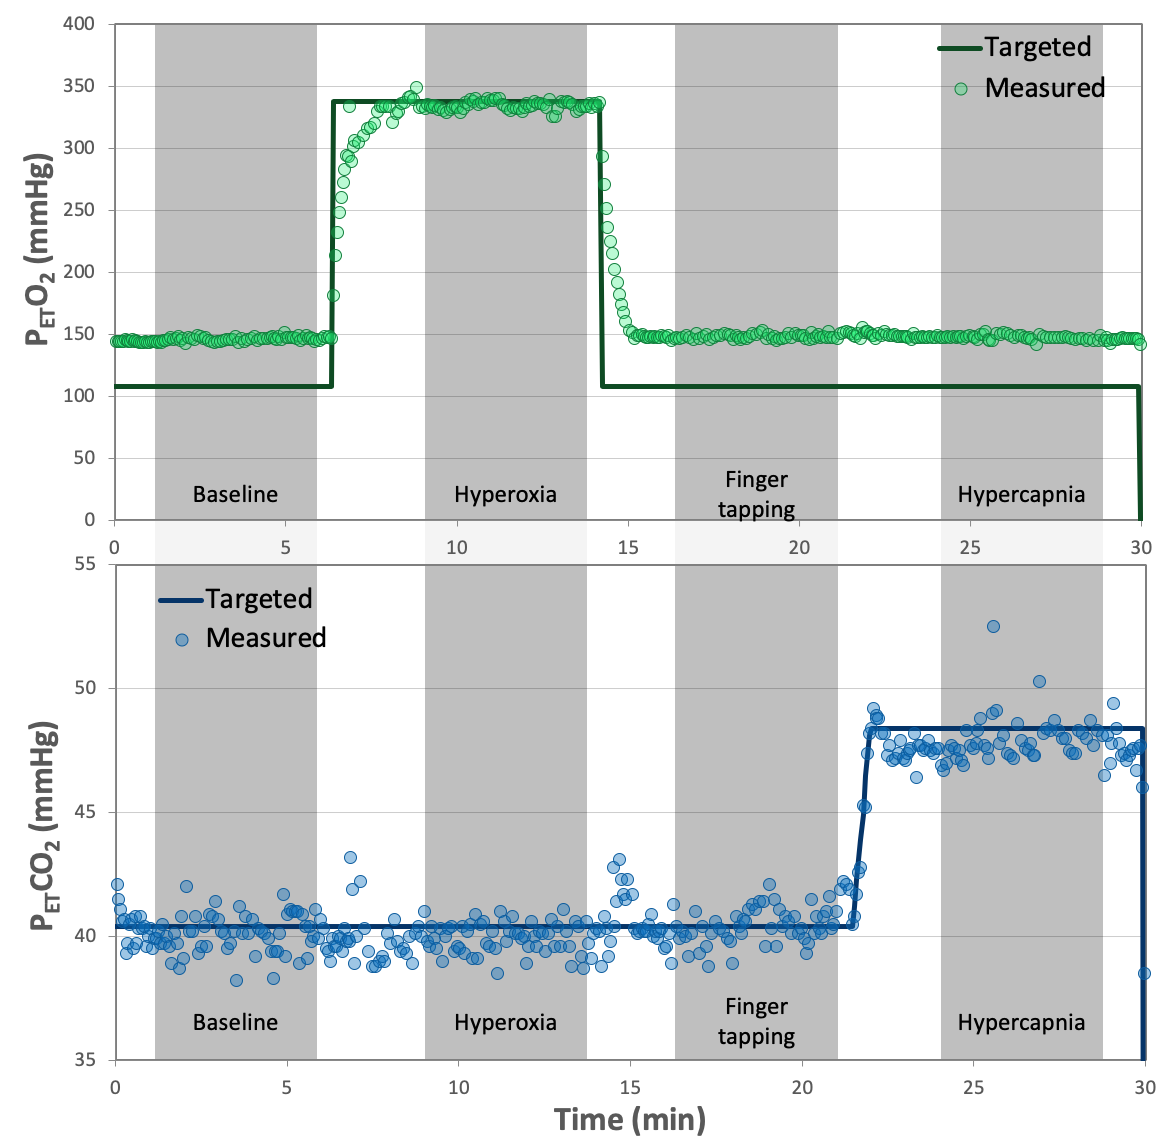
Data were collected for five minutes during each condition including (1) baseline, (2) hyperoxia (partial pressure of end tidal oxygen, PETO2=+230mmHg from baseline), (3) finger tapping interleaved with rest (normocapnia/normoxia), and (4) hypercapnia (PETCO2=+8mmHg from baseline) (Figure 3). Stimulus gases were delivered and PETO2/PETCO2 values were monitored via the RespirAct Gas Control System (Thornhill Research). Finger tapping was performed bilaterally in a block design (70s on/off repeated twice).
BOLD and ASL images for each series were registered to the initial time point and smoothed (FWHM=6mm). Perfusion was quantified from the tag-control difference, assuming blood T1=1660ms at baseline and hypercapnia9, and =1500ms during hyperoxia10. Yv was computed in the SSS via susceptometry-based oximetry from the dual-echo GRE data.6 M-maps were quantified using the Davis model1 (baseline and hypercapnia), Chiarelli model4 (baseline and hyperoxia, using PETO2 to estimate [dHb]), and the proposed Yv-based model (baseline and hyperoxia, using MR-measured Yv). Subsequently, task-based CMRO2 changes were quantified based on M-maps derived from each model.
Results
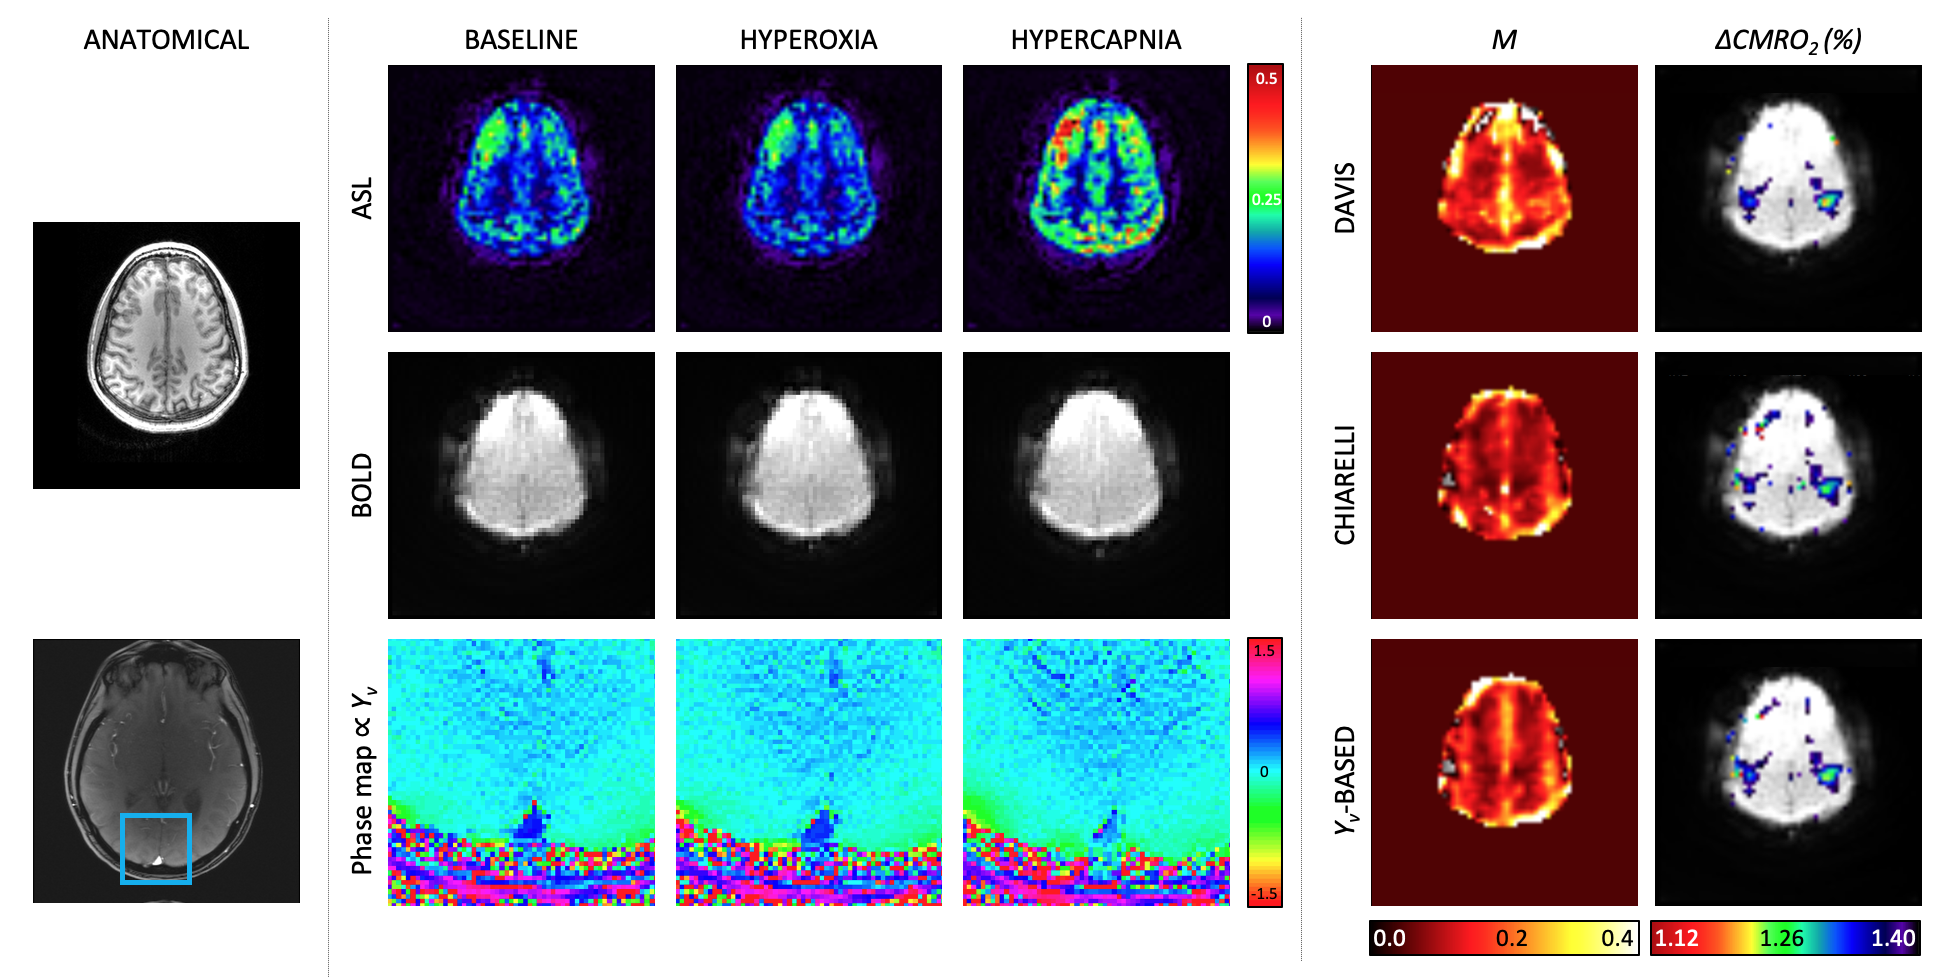
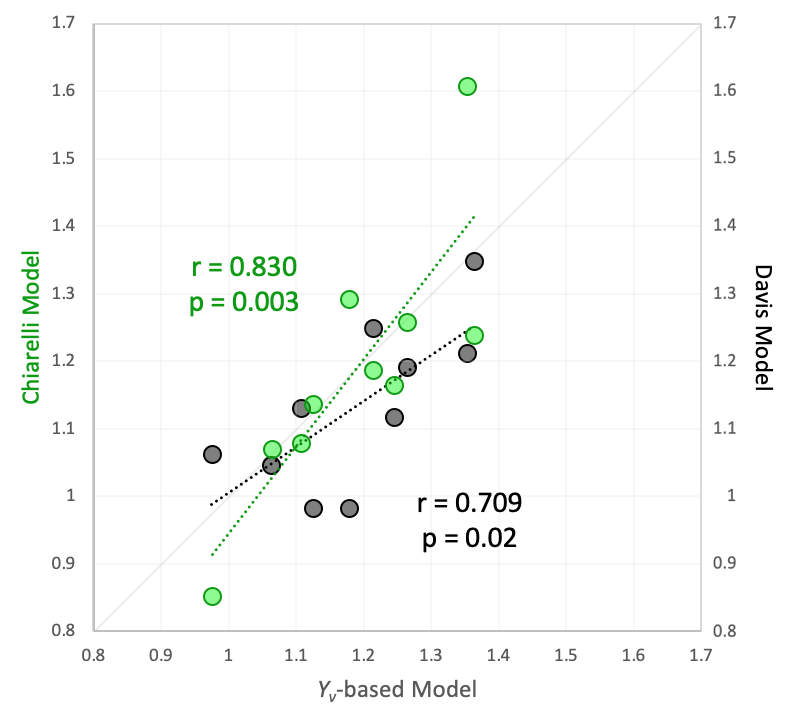
Figure 4 shows baseline and gas stimulus images for the quantified parameters, M-maps derived from each model and quantified CMRO2 responses. M-maps demonstrate plausible anatomic contrast. Average grey-matter M was 6.6±5.1% (Yv-based model), 9.3±3.8% (Davis model), and 5.7±7.3% (Chiarelli model). The finger tapping task activated regions in the motor cortex. Based on the M-maps from each calibration model, CMRO2 in the motor cortex increased by 19±12% (Yv -based model), 13±12% (Davis model), and 19±19% (Chiarelli model). There is a significant correlation between the Yv-based model and either the Davis or Chiarelli model for CMRO2 changes (Figure 5), however the correlation between the Davis and Chiarelli-based CMRO2 changes was not significant (r=0.362, p=0.3).Discussion & Conclusion
This work demonstrates the utility of OxBOLD combined with the Yv-based model for hyperoxia calibrated fMRI. Using the Yv-based model, average M-values and maps were similar to those derived from accepted models, but the proposed model directly measures whole-brain Yv, rather than relying on conversion of end tidal O2. Furthermore, the CMRO2 changes derived from the Yv-based model demonstrate better agreement with the existing models than the existing models do with each other. While the Yv-based model does assume that Yv changes in the brain are spatially uniform, it does allow for CBF changes while assuming invariant CMRO2, the latter being required for both Davis and Chiarelli models. Future studies will explore quantification of baseline CMRO2 and CMRO2 responses in absolute physiologic units through dual-gas breathing calibration.3,11Acknowledgements
The project described was supported by NIH grants R21 EB022687 and T32 EB020087.References
- Davis TL, Kwong KK, Weissko RM, Rosen BR. Calibrated functional MRI: mapping the dynamics of oxidative metabolism. Proceedings of the National Academy of Sciences. 1998;95:1834–1839.
- Boxerman JL, Hamberg LM, Rosen BR, Weissko RM. MR contrast due to intravascular magnetic susceptibility perturbations. Magn Reson Med. 1995;34:555–566
- Gauthier CJ and Hoge RD. A generalized procedure for calibrated MRI incorporating hyperoxia and hypercapnia. Hum Brai Mapp. 2013;34:1053–1069.
- Chiarelli PA, Bulte DP, Wise R, Gallichan D, Jezzard P. A calibration method for quantitative BOLD fMRI based on hyperoxia. NeuroImage. 2007;37:808– 820.
- Rodgers ZB, Englund EK, Fernandez-Seara MA, Wehrli FW. BOLD calibration with interleaved susceptometry-based oximery. Proc ISMRM. 2015:0597.
- Fernandez-Seara MA, Techawiboonwong A, Detre JA, Wehrli FW. MR susceptometry for measuring global brain oxygen extraction. Magn Reson Med. 2006; 55(5)967-973.
- Jain V, Langham MC, Wehrli FW. MRI estimation of global brain oxygen consumption rate. J Cereb Blood Flow Metab. 2010; 30(9):1598-1607.
- Vidorreta M, Wang Z, Rodríguez I, Pastor MA, Detre JA, Fernandez-Seara MA. Comparison of 2D and 3D single-shot ASL perfusion fMRI sequences. NeuroImage. 2013;66:662-671.
- Lu H, Clingman C, Golay X, van Zijl PCM. Determining the longitudinal relaxation time (T1) of blood at 3.0 Tesla. Magn Reson Med. 2004;52(3):679–682.
- Pilkinton DT, Hiraki T, Detre JA, Greenberg JH, Reddy R. Absolute cerebral blood flow quantification with pulsed arterial spin labeling during hyperoxia corrected with the simultaneous measurement of the longitudinal relaxation time of arterial blood. Magn Reson Med. 2011;67(6):1556–1565.
- Bulte DP, Kelly M, Germuska M, Xie J, Chappell MA, Okell TW, Bright MG, Jezzard P. Quantitative measurement of cerebral physiology using respiratory-calibrated MRI. NeuroImage. 2012; 60: 582–591.
Figures