0531
Contribution of sympathetic vasoconstriction to the fMRI global signal during autonomic arousals1NINDS, NIH, Bethesda, MD, United States, 2Vanderbilt University, Nashville, TN, United States, 3UC Irvine, Irvine, CA, United States
Synopsis
Recent work has suggested that the fMRI global signal (GS) in part may result from activity carried by the extensive sympathetic innervation of the extraparenchymal arteries of the brain. One of the pathways that potentially triggers sympathetic activity is the phenomenon of subcortical (autonomic) arousal, which is closely associated with the K-complex, a signature event observed in scalp EEG. In this work, we analyzed previously acquired data during sleep, and showed a strong association between fMRI GS, K-complexes, and photoplethysmography (PPG) from the finger skin, a proxy for sympathetic activity. Since sympathetic activity may be variable and elicited by a variety of stimuli during both sleep and wake, it likely plays an important, while largely overlooked role in most fMRI experiments.
Introduction
The BOLD fMRI signal is well established to originate from blood flow changes in response to neuronal activity through local (intracortical) neurovascular coupling. However, potential confounding contributions of the extracortical sympathetic innervation of cerebral arteries is less well known. In an earlier work1, studying rest and light sleep in healthy human subjects, strong correlation was observed between whole brain fMRI signal and finger skin vascular tone, measured with photoplethysmography (PPG) from the finger-tip, known to be regulated by sympathetic mechanisms. Here, to further investigate this, we analyzed concurrently acquired fMRI, EEG, and peripheral vascular tone during light sleep, and focused on fluctuations in autonomic arousal associated with K-complexes, which have a strong association with momentary increases in sympathetic activity2.Methods
Data were selected from an overnight sleep study3 focusing on segments with clean PPG signal, minimal head motion (translation less than 2 mm, rotation less than 2°), non-REM sleep or wake, and each lasting at least 5-minute duration. Overall 14 segments from 9 subjects were analyzed, of which 9 segments contained 80% to 100% of NREM stage-2 sleep (N2), and 5 segments contained 60% to 100% of wake.
BOLD fMRI data was obtained at 3T (Siemens Skyra) with gradient-echo-EPI (FA = 900, TR = 3 s, TE = 36 ms, in-plane resolution = 2.5 mm, slice-thickness = 2 mm, acceleration-factor = 2).Preprocessing of fMRI data included motion coregistration and regression, polynomial regression of low-frequency signal drifts, and slice timing correction1. PPG signals, as acquired by a pulse oximeter attached to finger-tip, were used to extract instantaneous heart rate (HR) and PPG amplitude (PPG-AMP), as indicator of vascular tone1. Respiratory volume4 (RV) was also calculated from a concurrently acquired chest belt signal.
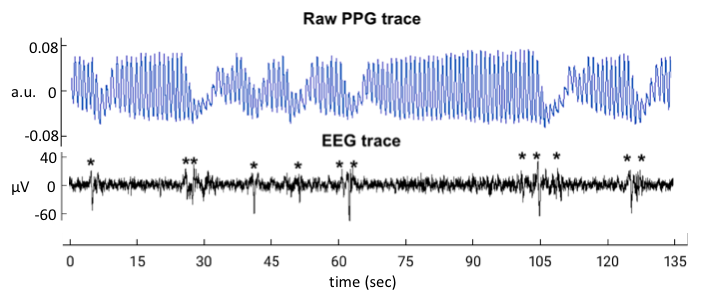
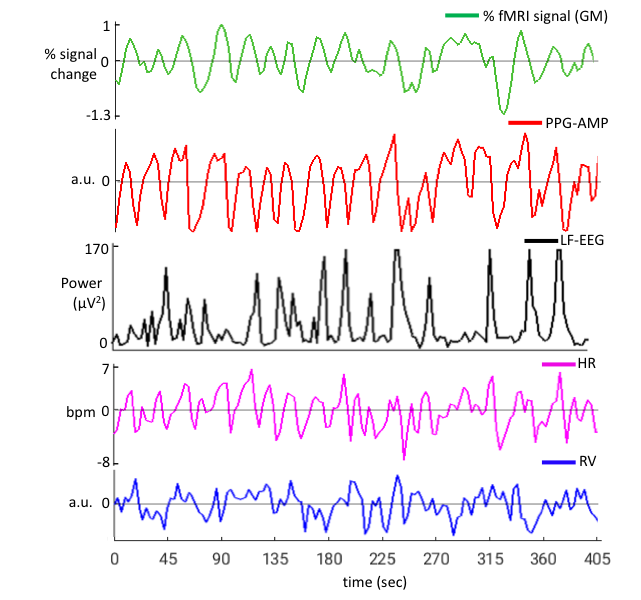
EEG and ECG were acquired concurrently during fMRI scans with a 64-channel recorder (BrainVision). Sleep stages were manually scored with BrainVision Analyzer software in 30-s epochs, after correction of MRI gradient and cardio-ballistic artifacts in the EEG5, and band-pass filtering the EEG signals from 0.3 to 35 Hz. The resulting data were used to detect K-complexes (Fig.1) automatically6.In addition, as a proxy for K-complexes7,lowfrequency EEG power (LF-EEG, 0.5-2 Hz) was also calculated using the Fp1 EEG channel. This was done for each 3 s interval aligned with successive fMRI volumes. Exemplary signal traces from a subject are given in Figure 2. Relationship between the various signals was investigated by performing lag dependent correlation on a voxel-by-voxel and region-of-interest basis.
Results
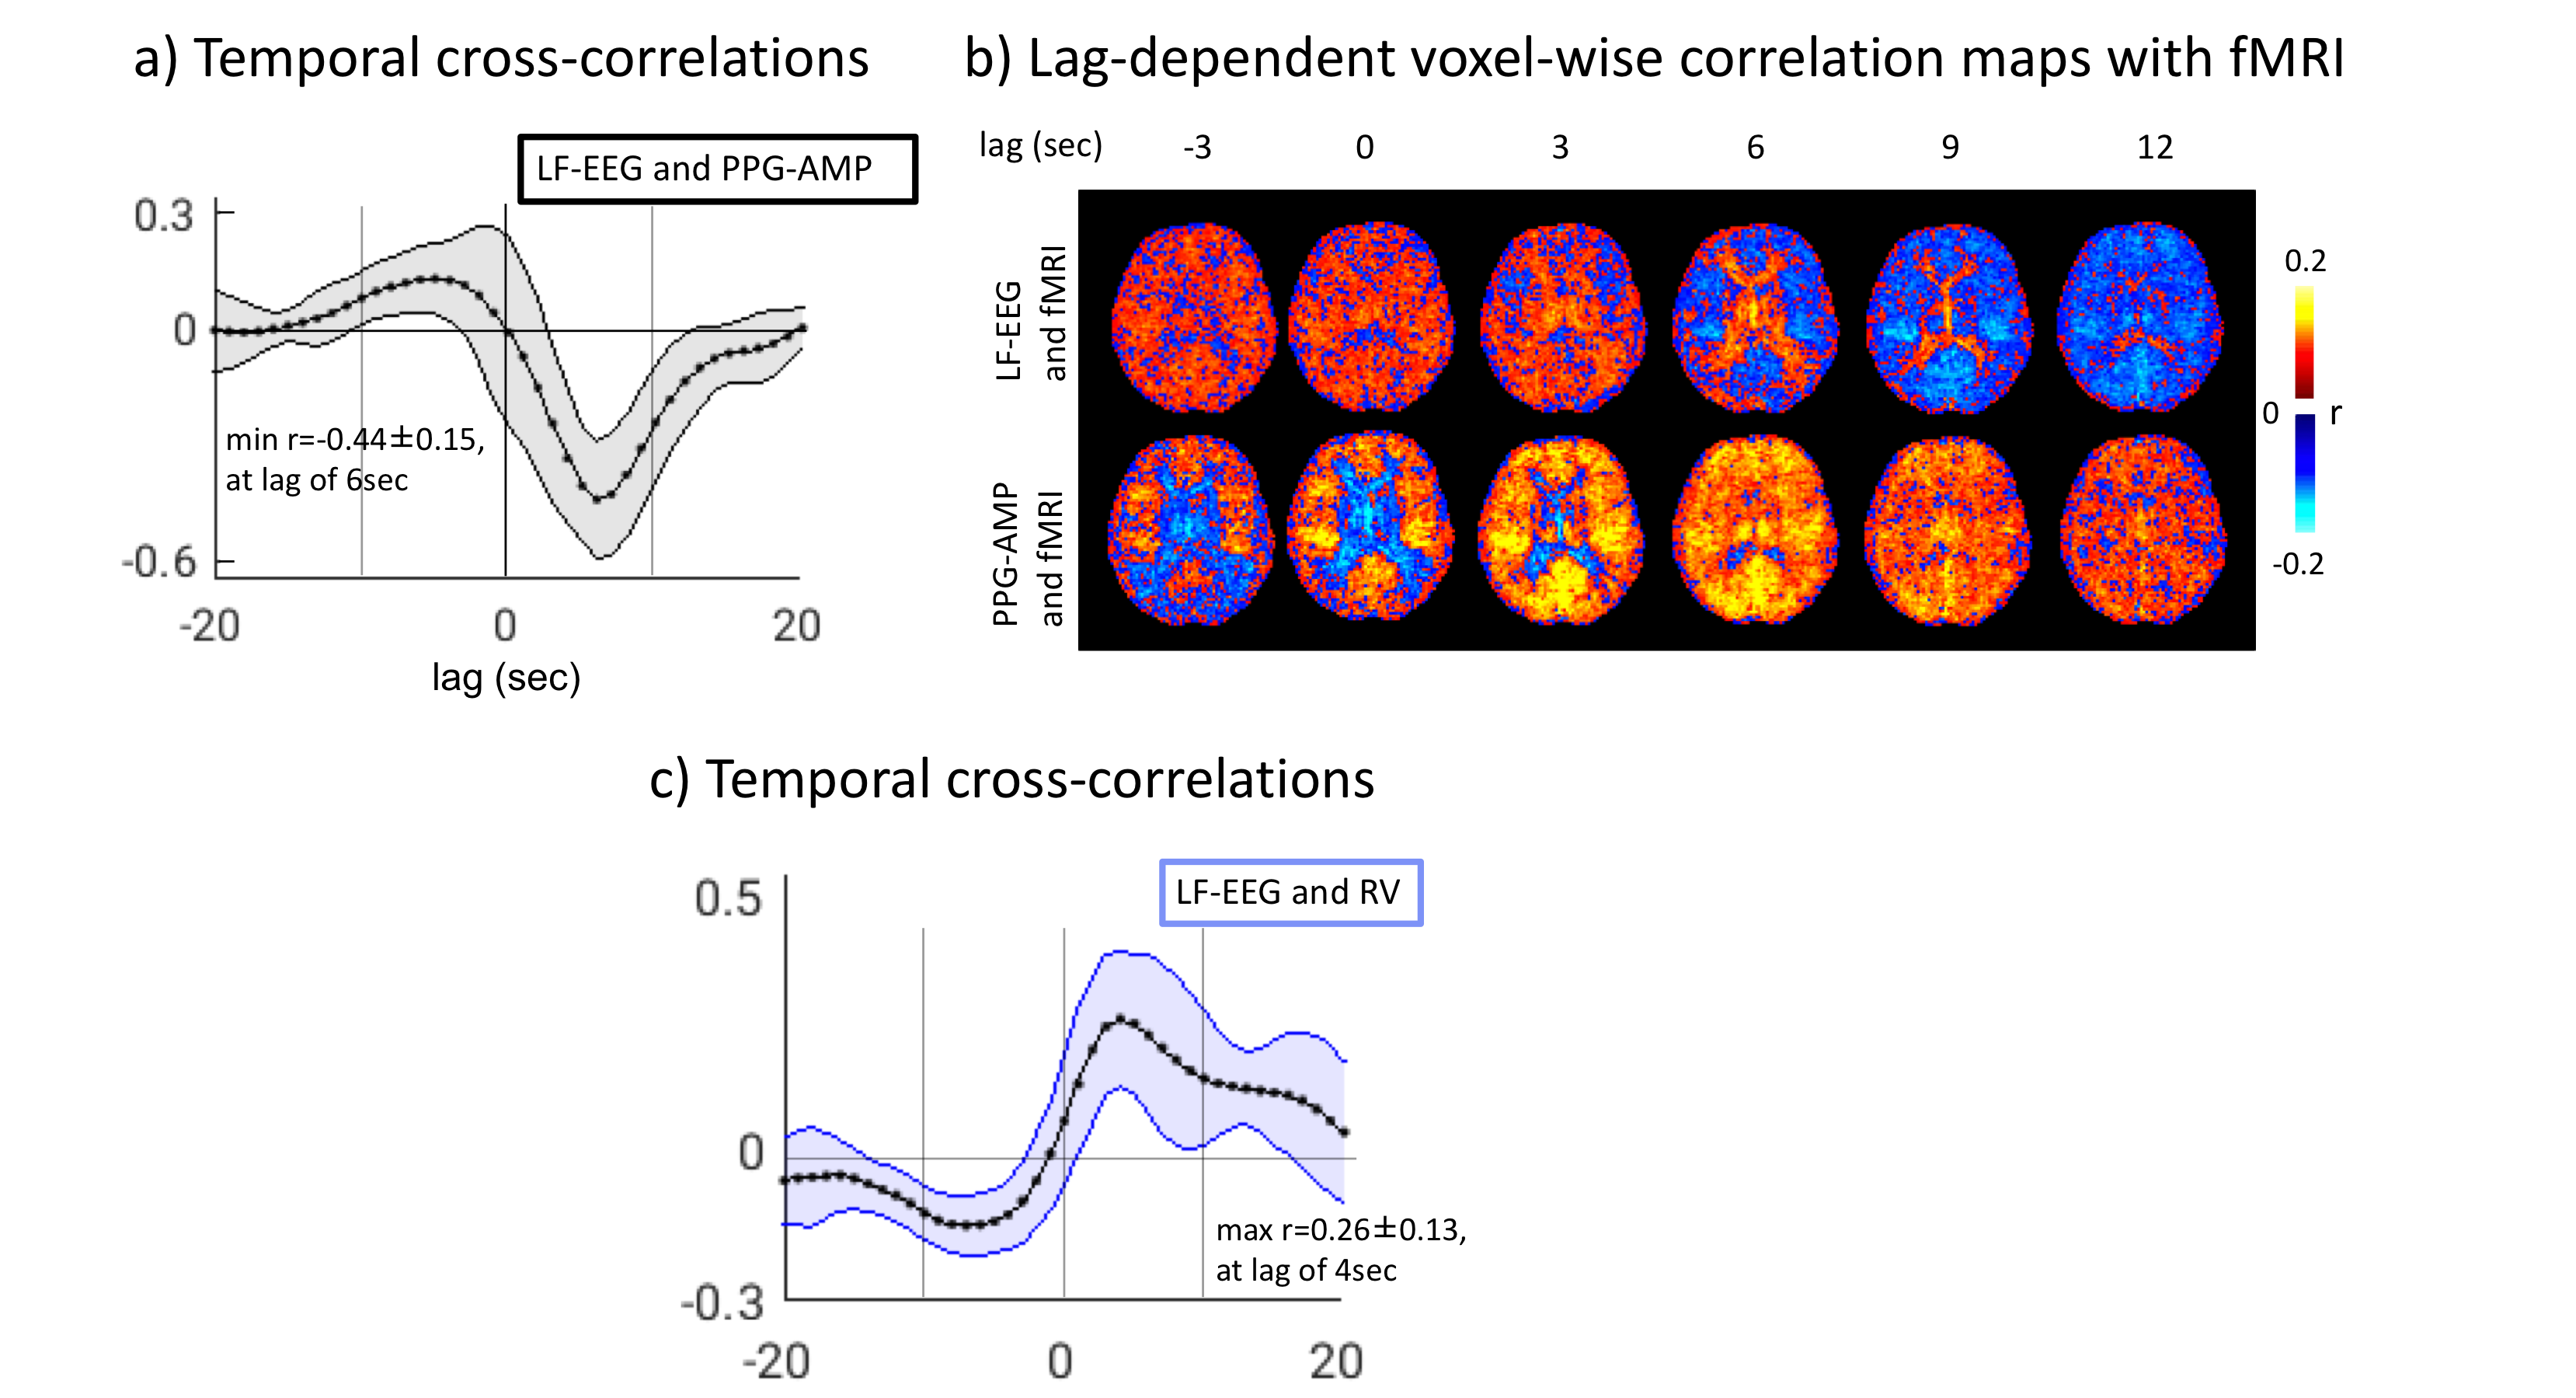
During N2 sleep, we observed a high co-occurrence (>80%) of K-complexes with PPG-AMP drops (Fig.1), which were followed by fMRI grey-matter signal decrease (Fig.2). Furthermore, we found substantial (negative) correlation between LF-EEG and peripheral vascular tone (Fig.3a), consistent with previous studies that linked this relation to sympathetic activation2,8. LF-EEG – fMRI correlation maps showed a negative correlation in grey-matter regions (i.e. increased LF-EEG, decreased fMRI signal), with a delayed negative response in white matter and ventricular regions (Fig.3b, top). They resembled the PPG-AMP – fMRI correlation maps (Fig.3b, bottom; albeit with opposite polarity and temporal shift, suggesting a common origin. Spatio-temporal patterns of correlation maps (Fig.3b) are consistent with the known vascular delay in periventricular white and cortical grey matter1. Temporal correlations of LF-EEG and RV also indicate that increases in RV are following autonomic arousals (Fig.3c).
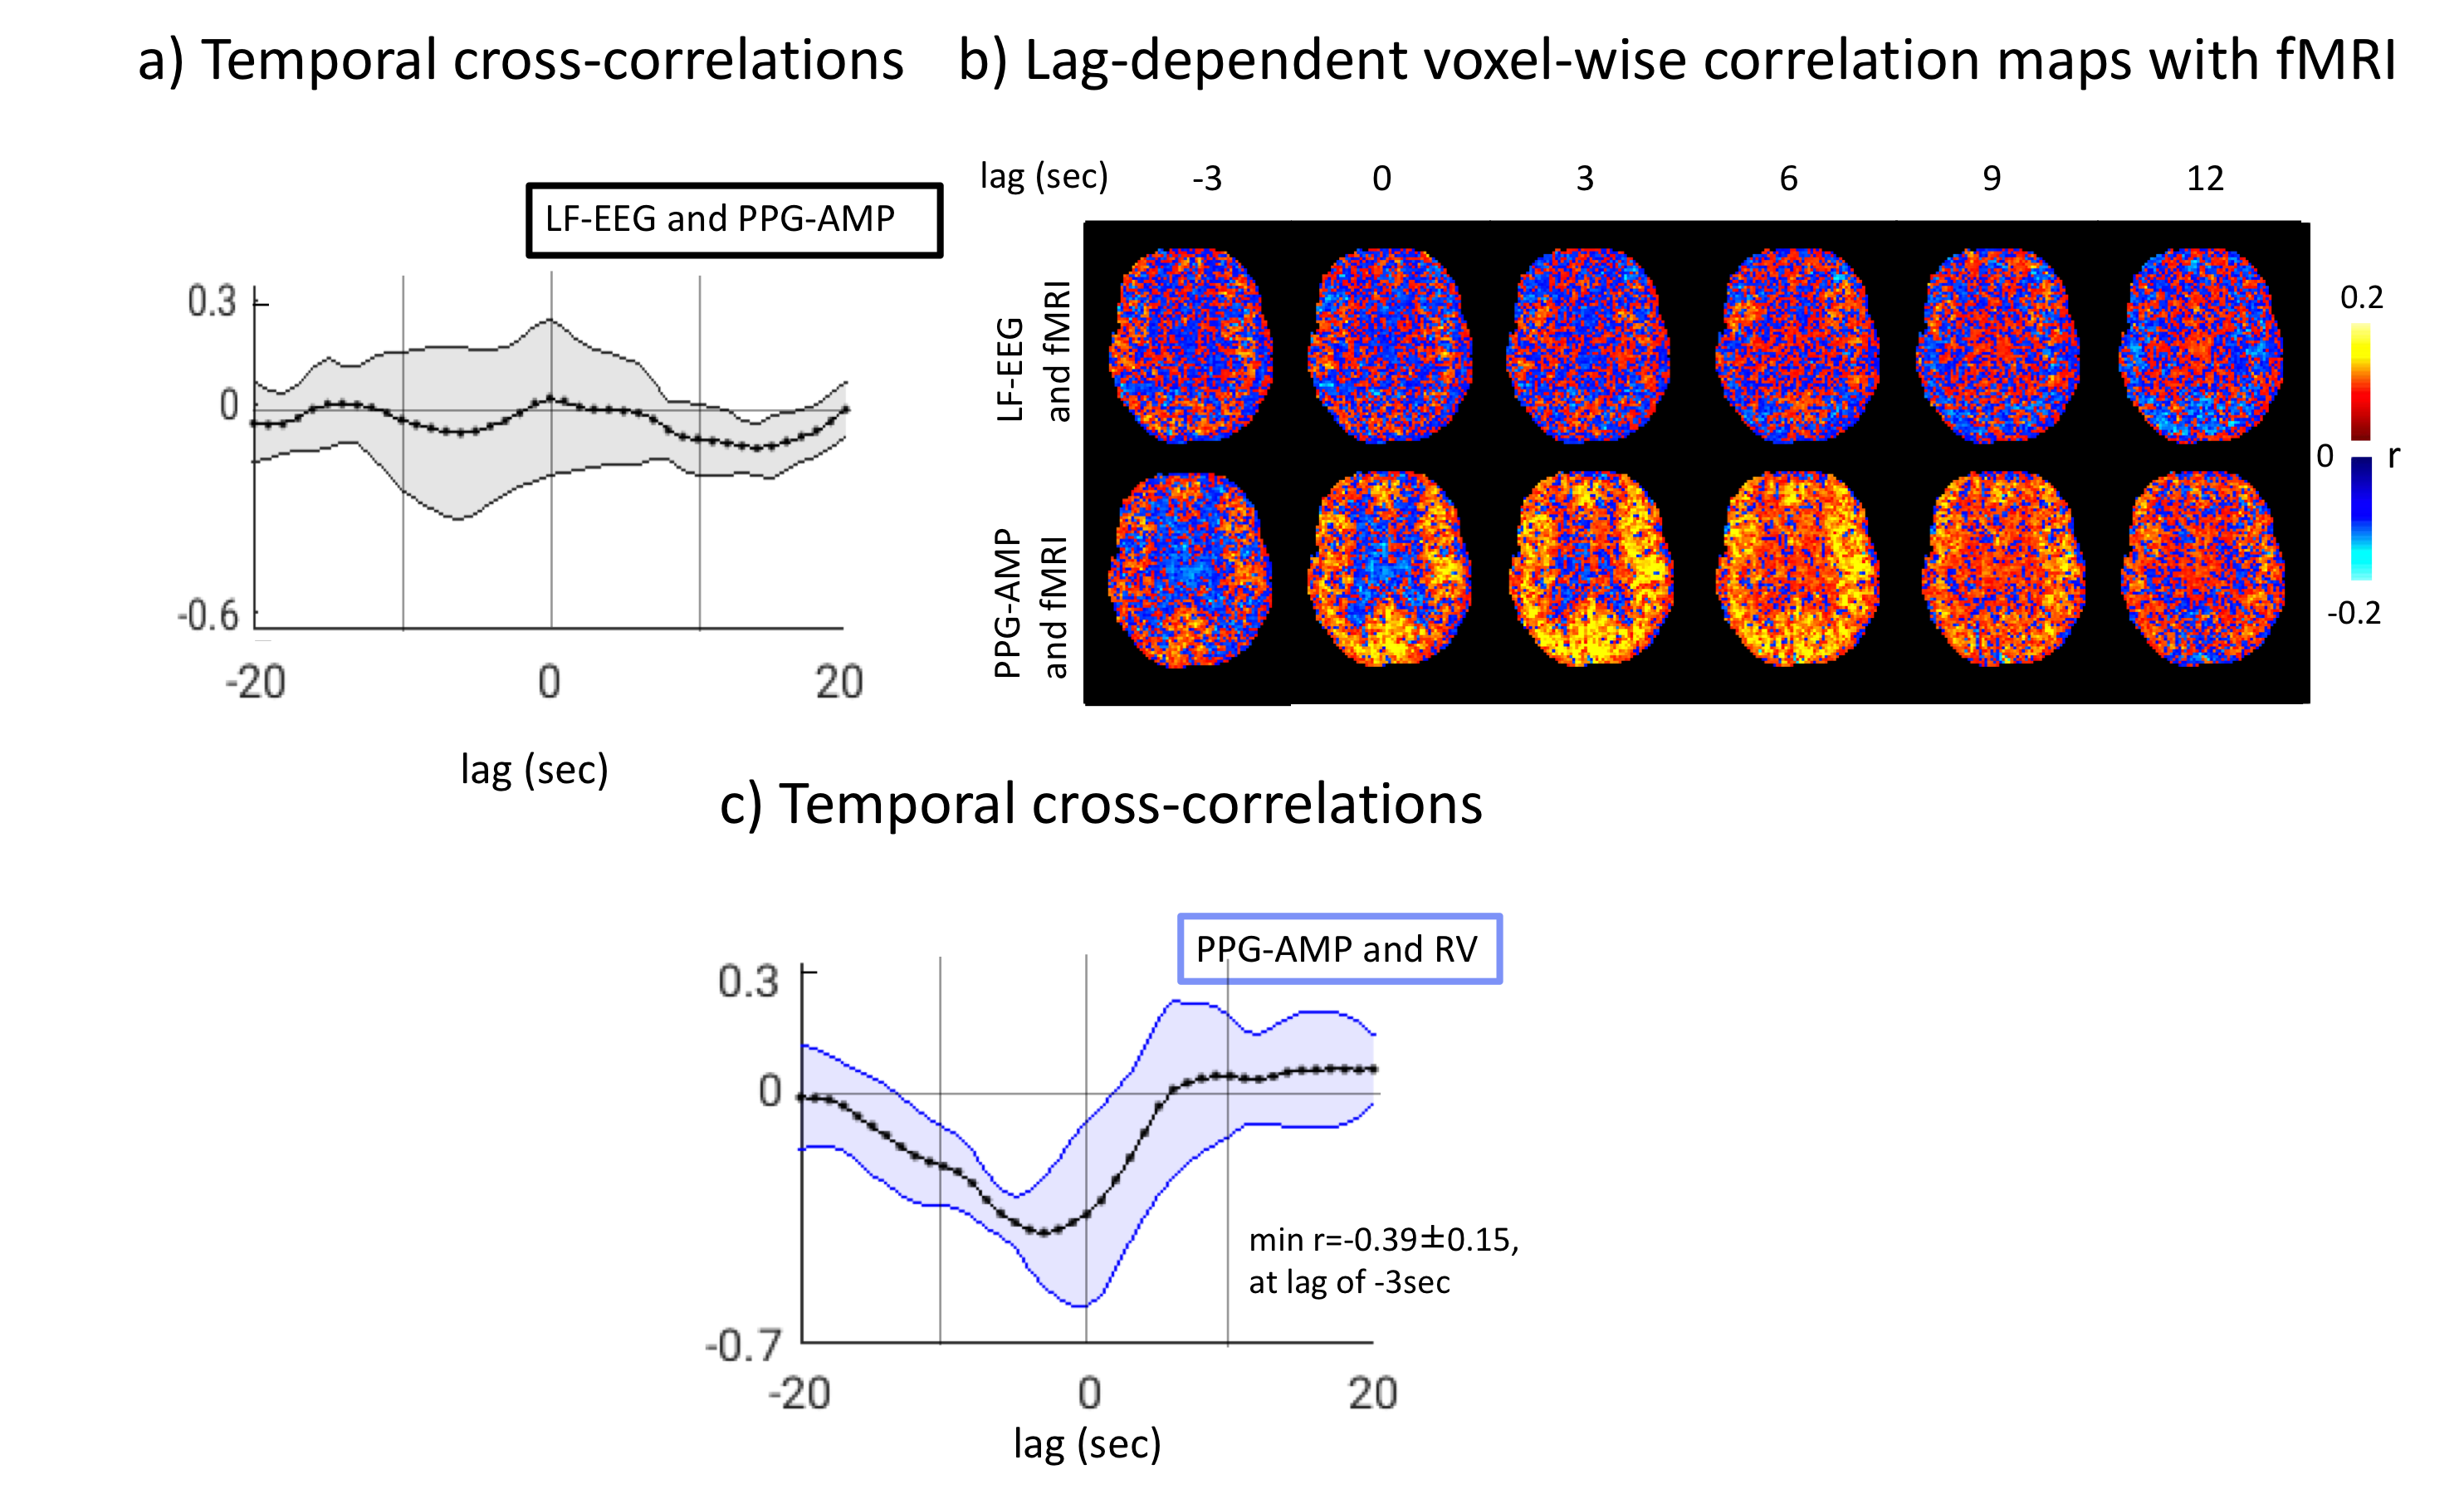
As expected, during wake, no correlation was observed between LF-EEG and PPG-AMP signals (Fig.4a). The pattern of correlation between PPG-AMP and fMRI resembled that during sleep (Fig.4b), although apparently at reduced strength. Furthermore, during wake, a strong negative correlation was found between PPG-AMP and RV, suggesting RV increases before PPG-AMP drops (Fig.4c).
Discussion
During both wake and light sleep, we observed a strong association between momentary PPG-AMP drops and reductions in fMRI global signal (GS), supporting a contribution from sympathetic vasoconstriction. During sleep, this sympathetic activity associates with and appears to be elicited by K-complexes, indicating episodic subcortical arousal. The continued association between fMRI GS and PPG-AMP during wake indicates factors other than arousal contribution to sympathetic activity, and preliminary evidence (Fig.4) suggests a relationship with RV9,10. Previous studies have indicated that other physiological and cognitive stimuli may elicit sympathetic activity as well. Due to the complex and overlapping neural substrates underlying autonomic and arousal systems, whose joint activity influences sympathetic activity, a clear mechanistic understanding remains elusive. Nevertheless, conditions typical of most fMRI experiments are conducive to variations in sympathetic activity, whose effect on GS will need to be accounted for.Acknowledgements
No acknowledgement found.References
1. Ozbay, P. S. et al. Contribution of systemic vascular effects to fMRI activity in white matter. Neuroimage 176, 541-549, (2018).
2. Ackner, B. & Pampiglione, G. Some relationships between peripheral vasomotor and E.E.G. changes. Journal of neurology, neurosurgery, and psychiatry 20, 58-64 (1957).
3. Moehlman, T. M. et al. All-night functional magnetic resonance imaging sleep studies. J Neurosci Methods, (2018).
4. Chang, C., Cunningham, J. P. & Glover, G. H. Influence of heart rate on the BOLD signal: the cardiac response function. Neuroimage 44, 857-869, (2009).
5. Iber C, A.-I. S., Chesson AL Jr., Quan SF. . AASM manual for the scoring of sleep and associated events: Rules, terminology and technical specifications. (American Academy of Sleep Medicine, 2007).
6. Combrisson, E. et al. Sleep: An Open-Source Python Software for Visualization, Analysis, and Staging of Sleep Data. Frontiers in neuroinformatics 11, 60, (2017).
7. Bastien, C. H., Ladouceur, C. & Campbell, K. B. EEG characteristics prior to and following the evoked K-Complex. Canadian journal of experimental psychology = Revue canadienne de psychologie experimentale 54, 255-265 (2000).
8. Catcheside, P. G., Chiong, S. C., Mercer, J., Saunders, N. A. & McEvoy, R. D. Noninvasive cardiovascular markers of acoustically induced arousal from non-rapid-eye-movement sleep. Sleep 25, 797-804 (2002).
9. Chalacheva, P. & Khoo, M. C. Modeling of deep breath vasoconstriction reflex. IEEE Engineering in Medicine and Biology Society. Annual Conference 2015, 7792-7795, (2015).
10. Kimmerly, D. S., Morris, B. L. & Floras, J. S. Apnea-induced cortical BOLD-fMRI and peripheral sympathoneural firing response patterns of awake healthy humans. PLoS One 8, e82525, (2013).
Figures