0521
Spinal cord atrophy in Neuromyelitis Optica is associated to spinal cord lesions and clinical disabilityLoredana Storelli1, Laura Cacciaguerra1,2, Paola Valsasina1, Sarlota Mesaros3, Jelena Drulovic3, Alessandro Meani1, Massimo Filippi1,2, and Maria A. Rocca1,2
1Neuroimaging Research Unit, Institute of Experimental Neurology, Division of Neuroscience, San Raffaele Scientific Institute, Vita-Salute San Raffaele University, Milan, Italy, 2Department of Neurology, Institute of Experimental Neurology, Division of Neuroscience, San Raffaele Scientific Institute, Vita-Salute San Raffaele University, Milan, Italy, 3Clinic of Neurology, Faculty of Medicine, University of Belgrade, Belgrade, Yugoslavia
Synopsis
Although spinal cord involvement is one of the major magnetic resonance imaging (MRI) and clinical finding in Neuromyelitis Optica (NMO), there is a lack of quantitative studies in this field. This study quantifies and localizes spinal cord atrophy in 40 NMO patients and assesses its relationship with spinal cord lesions and clinical variables. Differently from what happens in multiple sclerosis, NMO cord atrophy seems related to the occurrence of spinal cord lesions and not to a more diffuse damage. Atrophy measures are strongly correlated with global EDSS and its pyramidal and sensitive subscores, suggesting its clinical relevance.
Introduction
Spinal cord lesions are one of the main magnetic resonance imaging (MRI) finding in Neuromyelitis Optica (NMO). With the recent introduction of high field scanners and optimized MRI sequences, cord T1-hypointense lesions have become highly detectable. The aim of this study is to characterize the spatial distribution of spinal cord atrophy in NMO patients, its relation with cord T1-hypointense lesions and their correlation with clinical disability.Methods
Cord 3D T1-weighted scans were acquired from 40 NMO patients and 15 age- and sex-matched healthy controls (HC). After identifying cord T1-hypointense lesions, binary lesion masks were produced from their manual segmentation. The active surface (AS) method1 was applied to calculate cross-sectional area (CSA) of cervical and upper portion of the dorsal cord (until D3). On the basis of active surfaces, a voxel-wise assessment of T1-weighted hypointense lesion probability maps (LPM) was performed and cord atrophy was compared between groups.Results
All NMO were aquaporine4-positive and 26/40 (65%) had T1-hypointense cord lesions. LPM showed a predominant involvement of the upper cervical cord (C3-C4, 20%) and upper thoracic cord (D2, 20%), with a central distribution of lesions on the axial slices. In NMO, cord atrophy was in the anterior and posterior columns with a significant damage at C3-C4 (p<0.001) and D2 (p<0.01) segments and co-localized with focal cord lesions. Both cord T1-hypointense lesions and atrophy correlated with Expanded Disability Status Scale (EDSS) at cervical level (p<0.01). Pyramidal and sensitive EDSS subscores correlated with atrophy at lower cervical and upper thoracic level (p<0.01) (Figure 1). NMO patients without spinal cord lesions had no significant cord atrophy compared to HC.Discussion
In NMO there is evidence of focal areas of spinal cord atrophy, corresponding to regions of higher lesional involvement. Such evidence suggests the existence in this condition of a focal, inflammatory-driven mechanism of damage rather than a primary neurodegenerative and diffuse process.Conclusions
Differently from what happens in multiple sclerosis, NMO cord atrophy seems related to the occurrence of spinal cord lesions and not to a more diffuse damage. Atrophy measures are strongly correlated with global EDSS and its pyramidal and sensitive subscores.Acknowledgements
No acknowledgement found.References
1. Horsfield M.A., Sala S., Neema M., et al., Rapid semi-automatic segmentation of the spinal cord from magnetic resonance images: application in multiple sclerosis. Neuroimage. 2010, 50:446–55.Figures
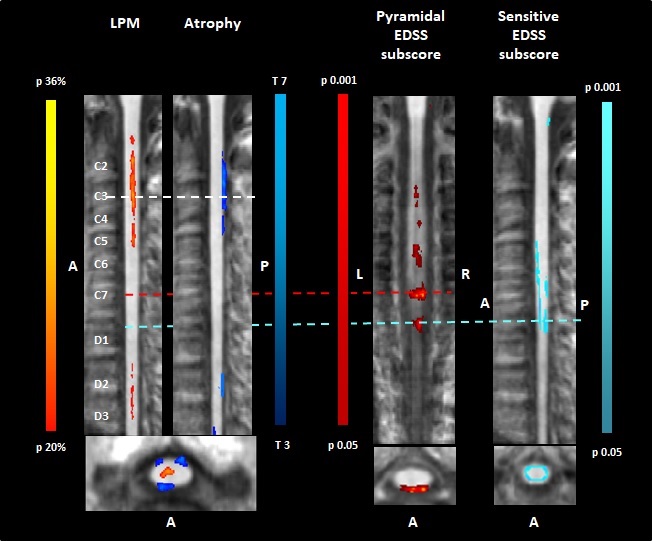
Figure 1. Figure shows lesion probability map and regions
of significant atrophy in the spinal cord of NMO patients (left side).
Correlations between atrophy and pyramidal/sensitive subscores of the EDSS are
shown on the right side. P and T ranges are represented in the colour bars. Abbreviations:
LPM= lesion probability map; A=anterior; P=posterior; L=left; R=right.